
- Homeowners are staying put longer than they were in the early aughts. That’s largely because older Americans are aging in place and it’s difficult to find and afford houses, but partly because it was easy to get mortgages in the early 2000s.
- Tenure has declined a bit from its 2020 peak due to the pandemic moving frenzy.
- Homeowners hanging onto houses is contributing to the inventory shortage and rising home prices.
- California homeowners typically stay put longest, partly because of a state property-tax incentive. Homeowners move most often in relatively affordable southern metros like Louisville, KY and Nashville.
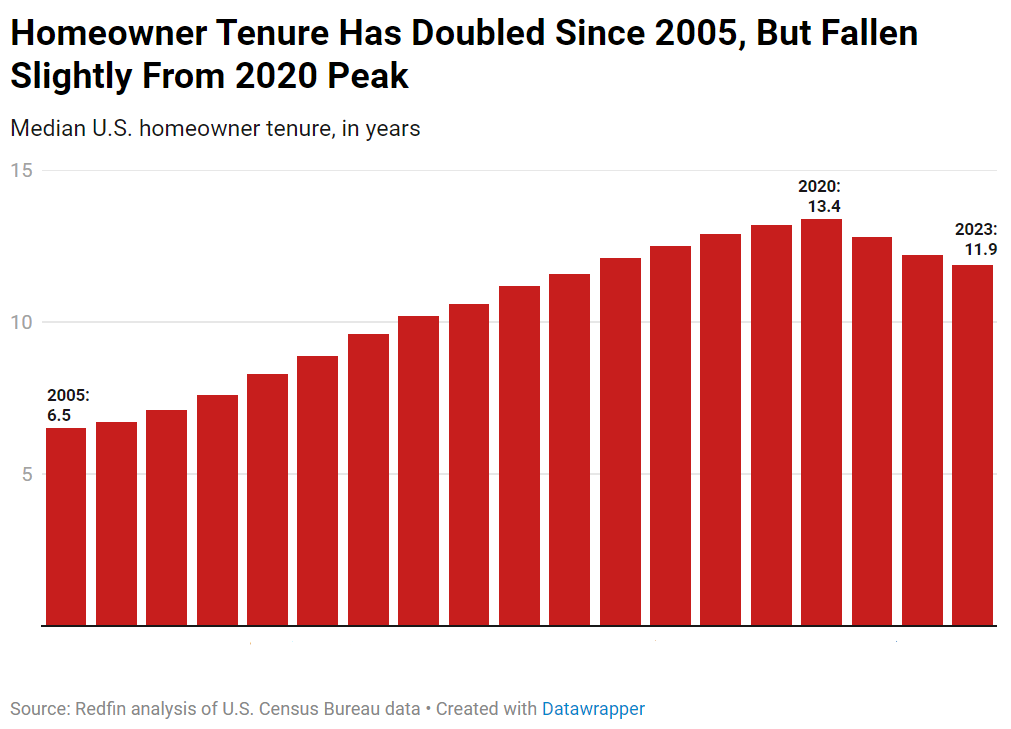
The typical U.S. homeowner has spent 11.9 years in their home, up from 6.5 years two decades ago.
Homeowner tenure peaked at 13.4 years in 2020, just when the pandemic set off a moving frenzy, and has declined since then.
This data is from a Redfin analysis of median homeowner tenure by year in the U.S. as of 2023, using historical county records. Home tenure for 2023 is defined as the number of years between the most recent sale date of a home and December 1, 2023. Data on homeowner tenure by generation is from a Redfin analysis of the U.S. Census Bureau’s 1-year American Community Survey in 2022, the most recent year for which the data is available.
Baby boomers are aging in place, driving homeowner tenure up
Older Americans staying in their homes is the driving force behind longer homeowner tenure. Nearly 40% of baby boomers have lived in their home for at least 20 years, and another 16% have lived in their home for 10-19 years. For Gen Xers, more than one-third (35%) have lived in the same home for at least 10 years.
Millennials typically stay in homes for shorter periods, largely because they’re younger and partly because they switch jobs more than older generations. Less than 7% of millennials have lived in their home for 10 years or longer, 13% have lived in their home for 5-9 years, and 30% have lived in their home for less than five years. Nearly all Gen Zers who own a home have had it for less than five years, which stands to reason because the oldest Gen Zer was 26 in 2023.
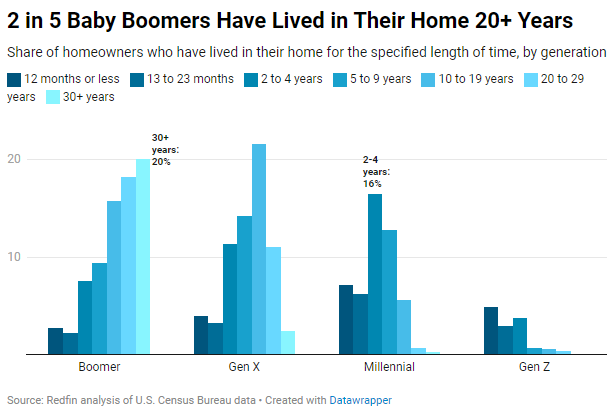
The time periods for each generation noted in the chart above don’t add up to 100%. That’s because not everyone owns a home; the remainder are either renters or living in institutions like assisted living facilities.
Baby boomers and Gen Xers have an outsized impact on overall housing-market trends for a few reasons. One, the American population is aging: Roughly 17% of people in the U.S. were 65 and older as of 2020, up from 13% in 2010. Two, they’re most likely to own homes: Nearly 80% of baby boomers and 72% of Gen Xers own their home, compared to 55% of millennials and 26% of Gen Zers.
There are several reasons why homeowner tenure has increased since the early aughts:
- Older Americans are hanging onto their homes because they’re financially incentivized to do so. Most (54%) baby boomers who own homes own them free and clear, with no outstanding mortgage. For that group, the median monthly cost of owning a home–which includes insurance and property taxes, among other things–is just over $600 (similar to the monthly cost for other generations with no outstanding mortgage, but other generations are far less likely to own homes free and clear).
- Nearly all boomers who do have a mortgage have a much lower rate than they would if they sold and bought a new home with today’s 7%-ish rates.
- Some state tax systems have policies that make it financially beneficial for people to stay in their homes as they get older. Texas homeowners over 65 can defer property taxes until the home is sold, and in California, Proposition 13 limits property-tax increases.
- Many older Americans prefer aging in their family home rather than moving to a different house or entering an assisted-living facility: Nearly 9 in 10 Americans between 50 and 80 years old said in a recent survey it’s important to stay in their homes as they get older. And with medical and tech advancements, it’s increasingly possible to do so.
- It was cheap and easy to move in the early 2000s. More people than usual were able to get mortgages and buy homes because mortgage-lending standards were loose, which ultimately led to the subprime mortgage crisis.
People hanging onto their homes is contributing to the inventory shortage
Lack of homes for sale and high housing costs contributes to people staying in their homes longer, and people staying in their homes longer contributes to lack of inventory and pushes prices higher.
Long homeowner tenure, particularly among baby boomers, is an obstacle for young first-time buyers trying to break into the market. A recent Redfin analysis found that empty-nest baby boomers own twice as many three-bedroom-plus homes than millennials with kids. Some young families are turning to new construction, and others are renting homes.
Homeowner tenure has dropped 1.5 years from its 2020 peak and is expected to stay flat
Homeowner tenure has declined slightly each year since 2020 because the pandemic kicked off a moving frenzy, with remote work and record-low mortgage rates leading to more homes changing hands in 2021 than any year since 2006.
Moving forward, we expect homeowner tenure to stay flat or increase slightly for the foreseeable future. Existing-home sales hit a 15-year low last year, with many homeowners locked in by low mortgage rates, and while sales should pick up a bit this year, it’ll be more of a trickle than a flood.
Metro-level highlights: Homeowner tenure, 2023
-
- Homeowners stay put longest in California. The typical Los Angeles homeowner has lived in their home for 18.7 years, followed by 17.8 years in San Jose, CA. Next come Cleveland, OH (17.4), San Francisco (16.7) and Memphis, TN (16.5). Californians tend to hold onto their homes for a long time partly because they’re incentivized to do so by Proposition 13.
- Homeowners move most often in relatively affordable metros, mostly in the South. Tenure is shortest in Louisville, KY (7.4 years) and Las Vegas (8). Next come Nashville, TN, Charlotte, NC and Raleigh, NC, which each have a median tenure of 8.5 years. Tenure is shorter in those metros partly because they have been popular migration destinations over the last few years, which means a lot of homes have changed hands recently.
| Metro-level summary: Homeowner tenure, 2023
Median homeowner tenure, in years 41 most populous U.S. metros for which we have sufficient data |
|||||
| U.S. metro area | Median homeowner tenure (2023) | Median homeowner tenure (2022) | Median sale price (2023) | Median sale price, YoY change (2023) | Active listings, YoY change (2023) |
| Atlanta, GA | 8.9 | 8.7 | $378,795 | 4% | -20% |
| Baltimore, MD | 15.6 | 15.5 | $350,000 | 5% | -7% |
| Birmingham, AL | 9.6 | 9.7 | $280,000 | 4% | -2% |
| Buffalo, NY | 11.7 | 11.5 | $235,000 | 9% | -8% |
| Charlotte, NC | 8.5 | 8.3 | $375,000 | -3% | -6% |
| Chicago, IL | 15.2 | 15.3 | $306,500 | 8% | -19% |
| Cincinnati, OH | 13.3 | 13.4 | $265,000 | 8% | -21% |
| Cleveland, OH | 17.4 | 17.1 | $199,900 | 4% | -9% |
| Columbus, OH | 11.3 | 11.9 | $315,000 | 5% | -2% |
| Denver, CO | 9.3 | 8.8 | $550,000 | 0% | -2% |
| Detroit, MI | 13.2 | 14.1 | $170,000 | 6% | -8% |
| Hartford, CT | 13.4 | 13.2 | $327,950 | 15% | -28% |
| Jacksonville, FL | 10.0 | 10.3 | $372,112 | 4% | -9% |
| Las Vegas, NV | 8.0 | 7.6 | $420,000 | 5% | -31% |
| Los Angeles, CA | 18.7 | 18.2 | $850,000 | 7% | -14% |
| Louisville, KY | 7.4 | 6.9 | $251,000 | 5% | 2% |
| Memphis, TN | 16.5 | 16.2 | $257,990 | -1% | 15% |
| Miami, FL | 11.7 | 12.5 | $510,000 | 12% | 1% |
| Milwaukee, WI | 11.0 | 11.1 | $280,000 | 6% | -2% |
| Minneapolis, MN | 10.3 | 10.2 | $355,000 | 2% | -1% |
| Nashville, TN | 8.5 | 8.2 | $450,000 | 0% | -2% |
| New Orleans, LA | 15.6 | 15.1 | $265,000 | -5% | 26% |
| New York, NY | 15.4 | 15.4 | $700,000 | 8% | -15% |
| Oklahoma City, OK | 11.4 | 11.4 | $250,000 | 6% | 5% |
| Orlando, FL | 8.6 | 8.5 | $400,000 | 3% | 11% |
| Philadelphia, PA | 16.1 | 15.7 | $250,000 | -3% | -7% |
| Phoenix, AZ | 8.6 | 8.3 | $444,990 | 5% | -18% |
| Pittsburgh, PA | 15.5 | 15.3 | $217,000 | 10% | -3% |
| Portland, OR | 11.4 | 11.3 | $530,000 | 5% | -5% |
| Providence, RI | 16.3 | 15.6 | $447,500 | 10% | -12% |
| Raleigh, NC | 8.5 | 8.2 | $432,671 | 1% | -34% |
| Richmond, VA | 15.4 | 15.2 | $370,599 | 9% | -3% |
| Riverside, CA | 12.2 | 12.4 | $550,000 | 5% | -15% |
| Sacramento, CA | 11.6 | 11.9 | $560,000 | 8% | -15% |
| San Diego, CA | 15.0 | 15.4 | $840,000 | 10% | -16% |
| San Francisco, CA | 16.7 | 16.3 | $1,297,500 | -1% | -13% |
| San Jose, CA | 17.8 | 17.3 | $1,400,000 | 11% | -16% |
| Seattle, WA | 13.0 | 12.7 | $750,000 | 6% | -22% |
| Tampa, FL | 9.0 | 8.9 | $375,000 | 1% | 9% |
| Virginia Beach, VA | 11.9 | 12.7 | $330,000 | 6% | -5% |
| Washington, DC | 13.6 | 14.0 | $524,900 | 7% | -14% |


