
Record-setting declines include a more than 10% decrease in new listings from a year earlier and a 9% drop in total number of home sales in a single month.
This is possibly the most unusual Market Tracker report that Redfin has ever published. At the beginning of March, the housing market was stronger than ever, with February marking the eighth straight month of increases in home sales, and the U.S. economy was relatively stable. By the end of March, that run had come to an end and everything had been thrown into extreme disarray as the spread of the coronavirus turned the housing market upside down. Therefore, the picture we get by looking at the entire month as a whole will understate the stalled condition of the market as we headed into April.
Buyers and sellers both retreated as the U.S. coronavirus crisis turned into a national emergency in March. Home sales slipped and the number of homes listed for sale plunged, although the U.S. median home sale price continued to increase, gaining 7.1% year over year and 3.3% month over month to $303,200.
When trying to understand the apparent strength of home prices in March it is important to remember that most of the homes sold during the month actually went under contract in February, before the coronavirus began to shut down the U.S. economy.
However, new list prices are a more leading indicator and asking price growth slowed from 8% in mid-March to flat year over year as of mid-April. If the shutdown is impacting home sale prices, we won’t expect to see that until the April and May data, which will reflect homes that went under contract in March and April.
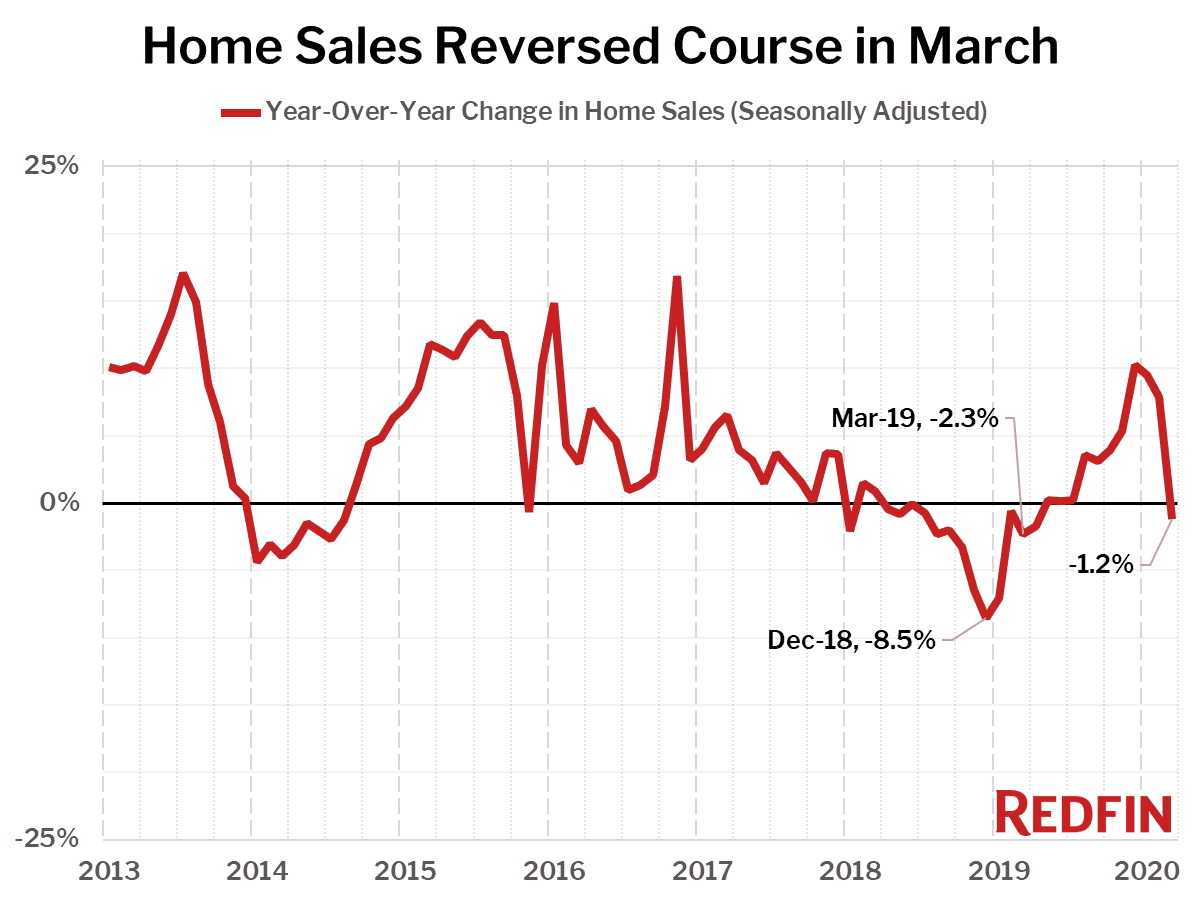
March home sales, which were only partially impacted by the coronavirus shutdowns, dropped 9.1% nationwide from February on a seasonally-adjusted basis, the largest decline on record (our data for this statistic goes back to January 2012). Home sales also fell 1.2% year over year in March, the first decline in nine months, and by the last week of the month they were down 11.5% from the same period a year earlier. The markets with the biggest declines in home sales from a year ago were all in New York State: Rochester (-18.5%), New York (-18.3%) and Nassau County (-17.3%).
| Market Summary | March 2020 | Month-Over-Month | Year-Over-Year |
|---|---|---|---|
| Median sale price | $303,200 | 3.3% | 7.1% |
| Homes sold, seasonally-adjusted | 511,000 | -9.1% | -1.2% |
| New listings, seasonally-adjusted | 551,600 | -12.5% | -10.8% |
| All Homes for sale, seasonally-adjusted | 1,909,500 | -7.0% | -13.0% |
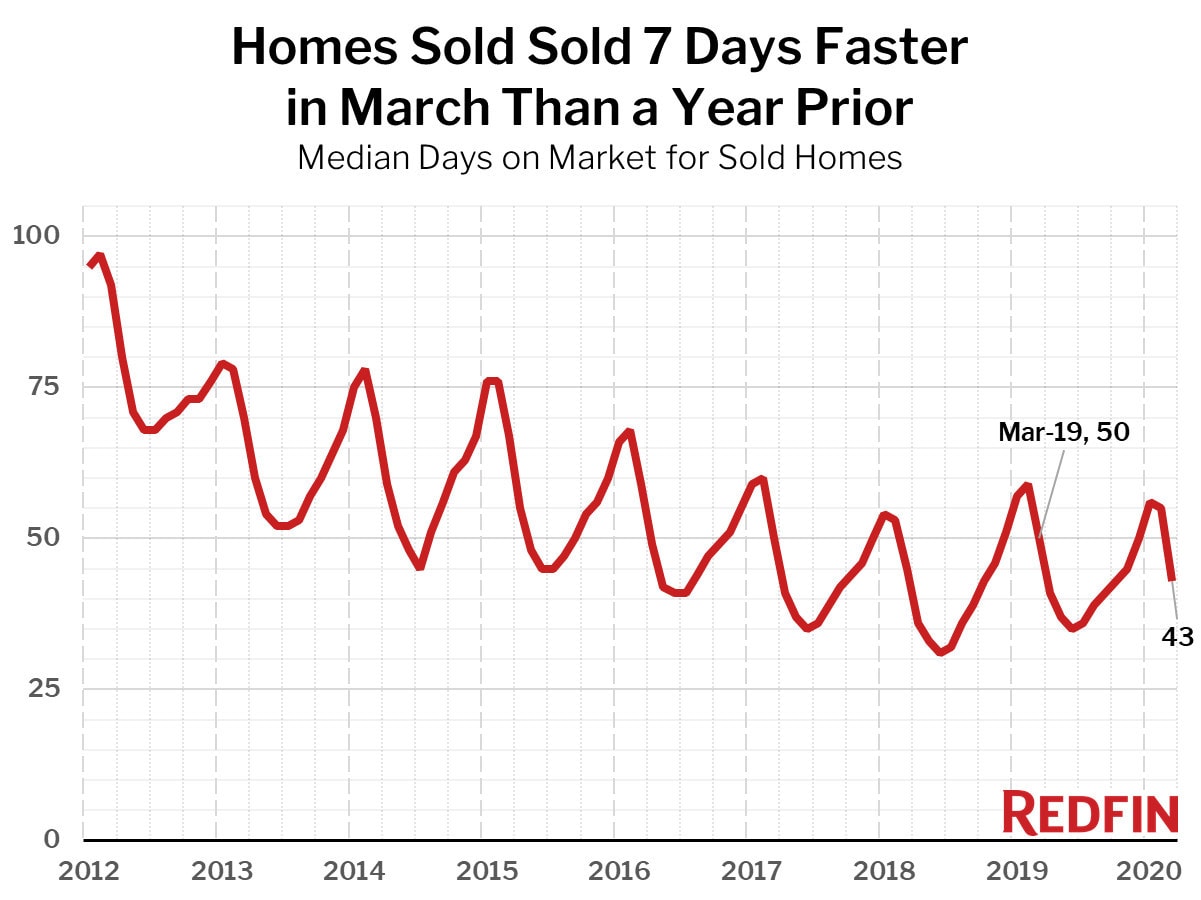
| Median days on market | 43 | -12 | -7 |
| Months of supply | 2.4 | -0.6 | -0.6 |
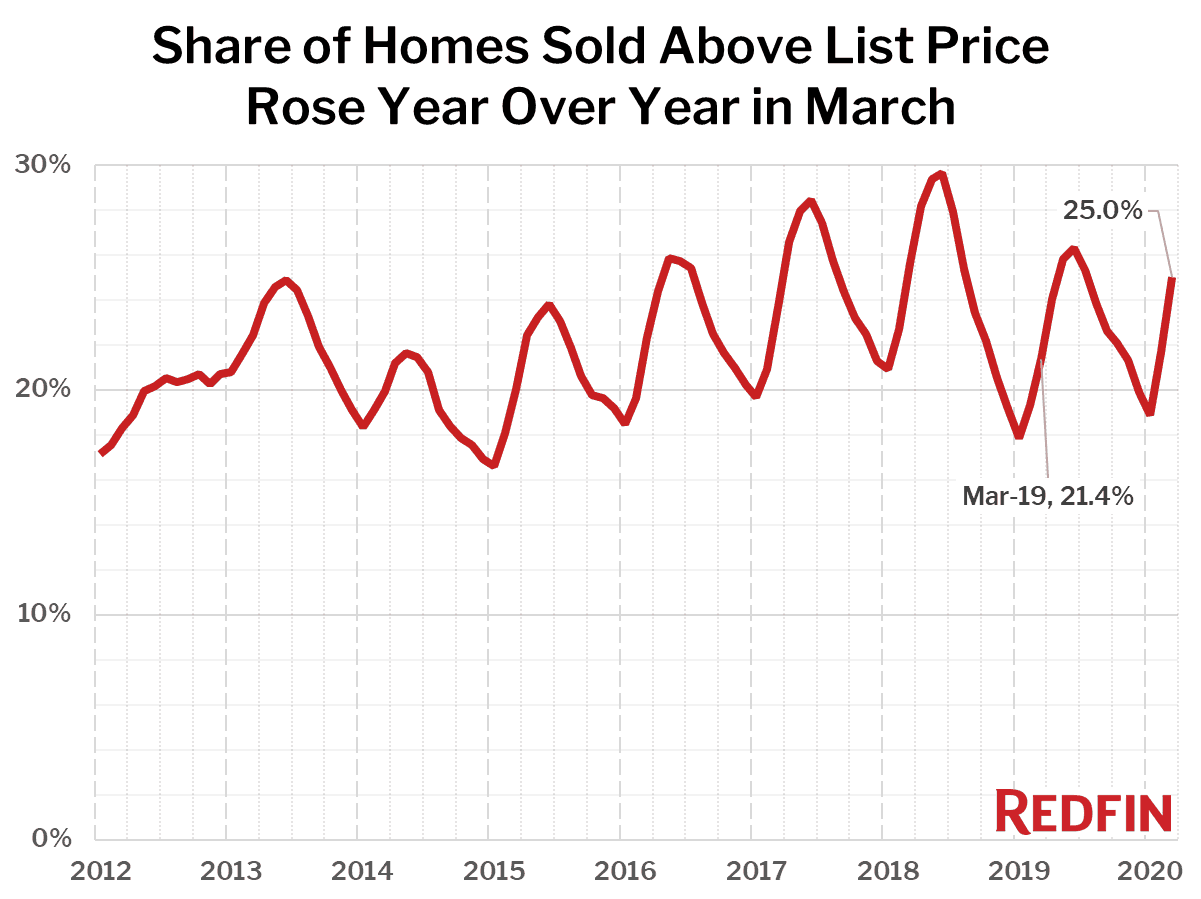
| Sold above list | 25.0% | 3.3 pts† | 3.6 pts† |
| Median Off-Market Redfin Estimate | $295,300 | -1.4% | 2.0% |
| Average Sale-to-list | 98.6% | 0.5 pts† | 0.5 pts† |
“The impacts of the coronavirus hit the economy hard in mid-March, as we have been reporting in our weekly data, but it’s good to step back and take an aggregated look at the market,” said Redfin lead economist Taylor Marr. “Real estate activities nearly ground to a halt in some parts of the country by the end of March, disrupted by shelter in place laws. Right now, sellers need to decide if they’ll list their home for sale among all the economic uncertainty. On one hand, the number of homes for sale is down more than 20% in recent weeks, even more than the 13% drop we saw for the full month of March, and home prices have so far held better than anyone expected. On the other hand, jobless claims continue to pile up and it is getting increasingly difficult to get a mortgage, which could limit buyer demand. How the market shapes up through the rest of spring will depend heavily on unemployment and the availability of credit.”
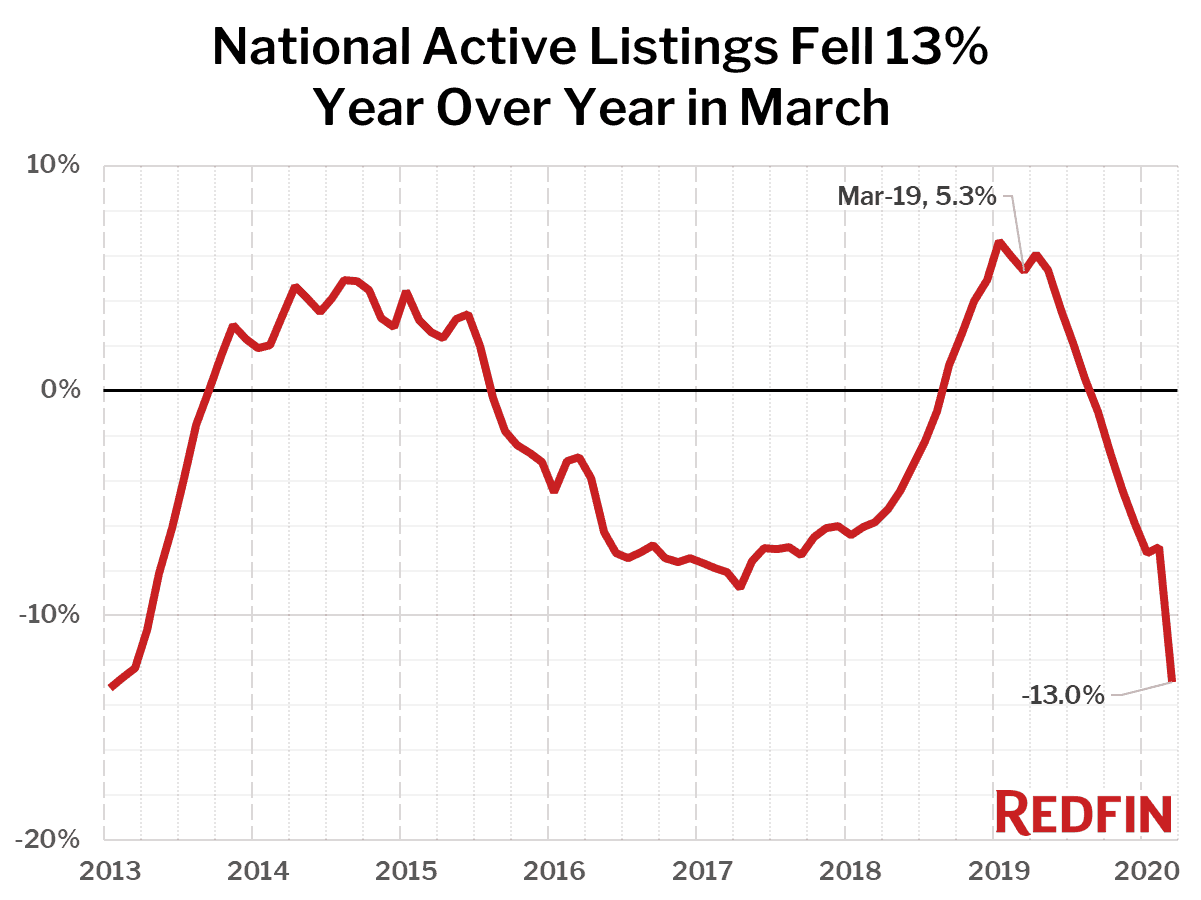
The national count of active listings of homes for sale fell 13% year over year during March, the biggest drop since January 2013 and the seventh straight month of declines. By the last week of the month, listings were down 18.8% from the same period a year earlier. There were fewer homes for sale last month than any time since at least January 2012, which is as far back as we have recorded this measure. Just three of the 85 largest metros tracked by Redfin posted a year-over-year increase in the count of seasonally-adjusted active listings of homes for sale, led by Omaha (+9.9%), Minneapolis (+5.3%) and El Paso (+1.3%). Active listings is a count of all homes that were for sale at any time during the month.
Compared to a year ago, the biggest declines in active housing supply in March were in Allentown, PA (-42.7%), Tulsa (-39.9%) and Kansas City, MO (-37.2%).
The number of new listings plummeted in March, dropping 10.8% compared with a year earlier. This is by far the largest decline on record, but more recent data is showing it may be even more severe. By the last week of the month new listings were down 36.9% from the same period a year earlier; as of last week they were declining nearly 50%.
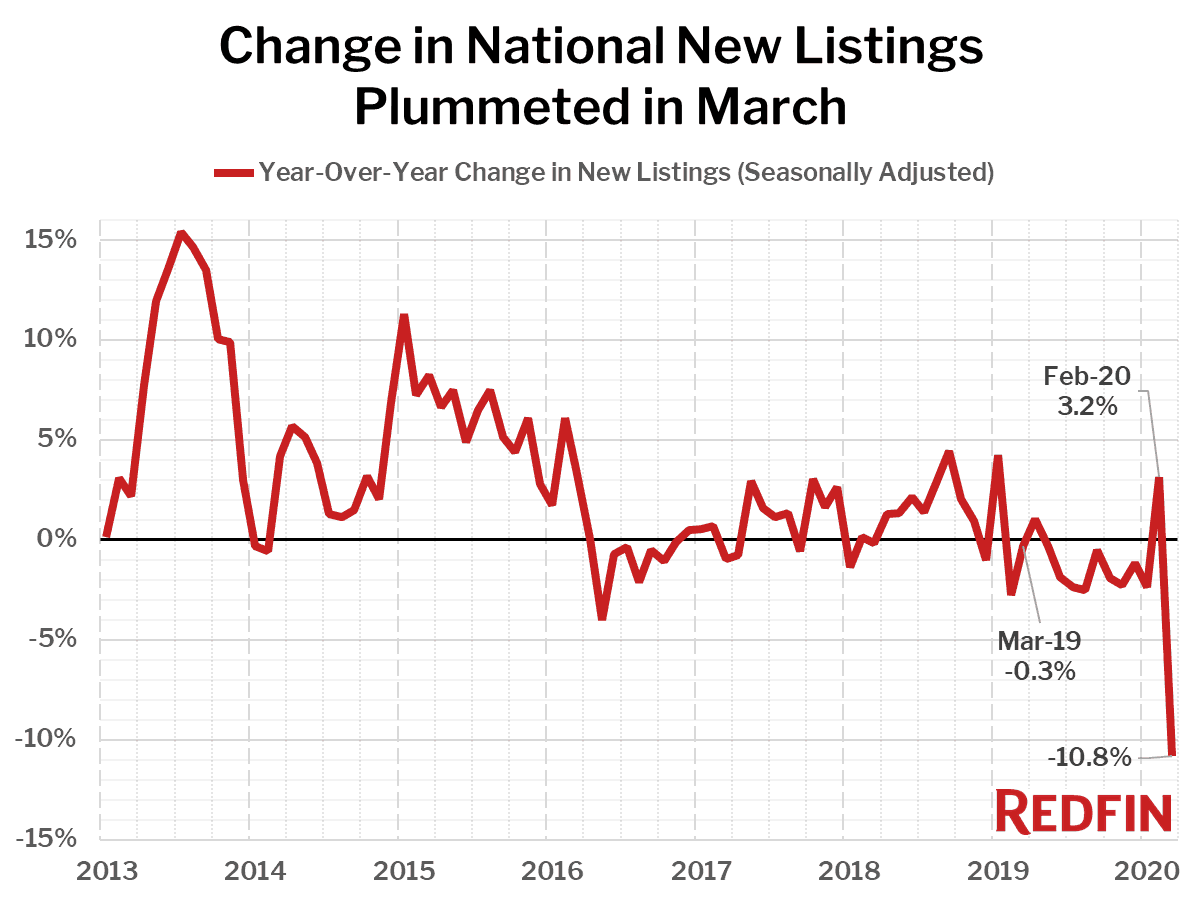
Seasonally-adjusted new listings in March fell the most from a year earlier in Allentown, PA (-46.2%), followed by Kansas City, MO (-46.1%) and Tulsa (-42.7%).
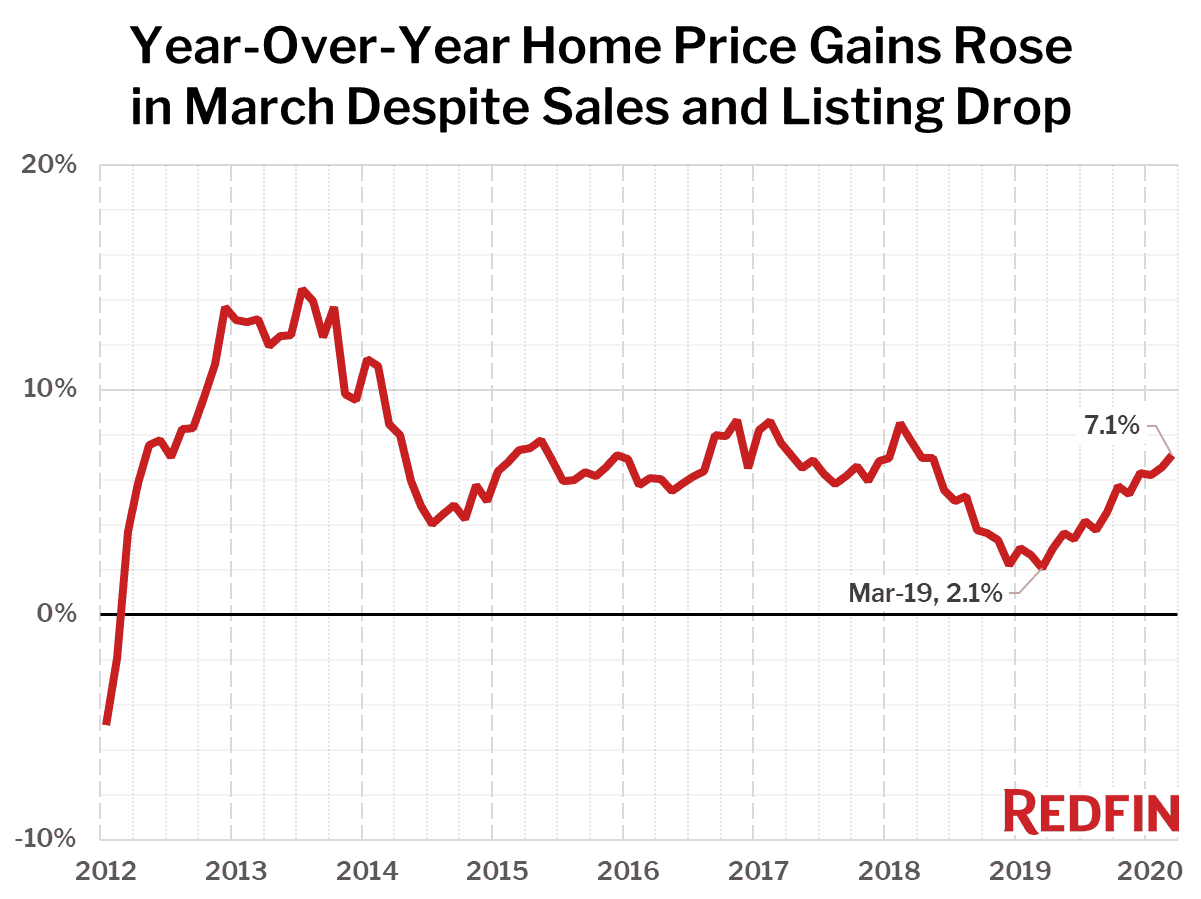
Metrics for sold homes are lagging the market because most sales were agreed to by the buyer and seller before the economy locked up. Nonetheless, it’s worth tracking how we did in March. The median price of homes that sold in March was up 7.1% from a year earlier, a two-year high that reflects the strength of the market before the coronavirus shutdown in March.
As we have seen consistently over the last year, the biggest gains in home prices in March were in some of the most affordable housing markets in the nation. The seven metro areas where home prices rose the most year-over-year all had median prices below the national level, led in March by Dayton, OH, (median price $155,000, +24.0%), Philadelphia ($240,000, +21.5%) and Greensboro, NC ($198,900, +20.5%).
None of the 85 largest metro areas Redfin tracks saw a year-over-year decline in the median sale price.
Homes that sold in March spent seven fewer days on market compared to the prior year. In March, the typical home went under contract in 43 days, compared to 50 days in March 2019.
As we stated in last month’s Market Tracker report, we do not expect to see this measure react to the coronavirus shutdowns until April’s data, at the earliest, since that is when we will see the details for homes that went under contract in March. Looking at data as of April 10 on how long homes for sale have been on the market, we already see an increase, with the average number of days having increased to 63, up from a low of 58 days earlier in March.
The share of homes that sold above list price increased 3.6 percentage points year over year, coming in at 25% in March compared to 21.4% a year earlier.
Other March Highlights
Competition
- Tacoma, WA was the fastest market, with half of all homes pending sale in just 6 days, down from 20 days a year earlier. Seattle and Denver were the next fastest markets with 7 and 9 median days on market, followed by Oakland, CA (12) and Sacramento, CA (12).
- The most competitive market in March was San Jose, CA where 67.2% of homes sold above list price, followed by 66.8% in San Francisco, 64.4% in Oakland, CA, 56.6% in Tacoma, WA, and 45.7% in Seattle.
Prices
- Dayton, OH had the nation’s highest price growth, rising 24% since last year to $155,000. Philadelphia had the second highest growth at 21.5% year-over-year price growth, followed by Greensboro, NC (20.5%), Memphis, TN (19.5%), and Indianapolis (14.4%).
- No metros saw year-over-year price declines in March.
Sales
- Frederick, MD led the nation in year-over-year sales growth, up 18.3%, followed by Hartford, CT, up 14.3%. Seattle rounded out the top three with sales up 11.7% from a year ago.
- Rochester, NY saw the largest decline in sales since last year, falling 18.5%. Home sales in New York and Nassau County, NY declined by 18.3% and 17.3%, respectively.
Inventory
- Omaha, NE had the highest increase in the number of homes for sale, up 9.9% year over year, followed by Minneapolis (5.3%) and El Paso, TX (1.3%).
- Salt Lake City had the largest decrease in overall active listings, falling 46.6% since last March. Allentown, PA (-42.7%), Tulsa, OK (-39.9%), and Kansas City, MO (-37.2%) also saw far fewer homes available on the market than a year ago.
Redfin Estimate
- Miami (89.5%) had the largest share of homes predicted to sell for below list price, according to Redfin Estimate data, followed by West Palm Beach, FL (86.3%) and Fort Lauderdale, FL (86.2%).
- San Francisco (85.6%) had the largest share of homes predicted to sell at or above list price, followed by Oakland, CA (83.7%) and San Jose, CA (82.7%).
Below are market-by-market breakdowns for prices, inventory, new listings and sales for markets with populations of 750,000 or more. For downloadable data on all of the markets Redfin tracks, visit the Redfin Data Center.
Median Sale Price
| Redfin Metro | Median Sale Price | Month-Over-Month | Year-Over-Year |
|---|---|---|---|
| Albany, NY | $210,000 | 5.0% | 4.5% |
| Allentown, PA | $208,800 | 3.1% | 12.0% |
| Anaheim, CA | $752,400 | 0.6% | 6.7% |
| Atlanta, GA | $260,000 | 4.0% | 6.1% |
| Austin, TX | $335,000 | 2.2% | 10.5% |
| Bakersfield, CA | $250,000 | 0.0% | 6.4% |
| Baltimore, MD | $292,000 | 10.2% | 9.0% |
| Baton Rouge, LA | $216,000 | 5.9% | 8.8% |
| Birmingham, AL | $234,200 | 11.0% | 12.6% |
| Boston, MA | $522,400 | 5.5% | 10.4% |
| Bridgeport, CT | $394,200 | 9.1% | 9.5% |
| Buffalo, NY | $154,500 | 3.1% | 6.6% |
| Camden, NJ | $201,000 | 5.8% | 9.0% |
| Charlotte, NC | $278,500 | 4.7% | 11.4% |
| Chicago, IL | $266,500 | 9.4% | 9.2% |
| Cincinnati, OH | $196,800 | 11.2% | 12.5% |
| Cleveland, OH | $157,500 | 8.3% | 8.6% |
| Columbus, OH | $230,000 | 6.0% | 10.3% |
| Dallas, TX | $305,000 | 5.5% | 5.2% |
| Dayton, OH | $155,000 | 13.1% | 24.0% |
| Denver, CO | $440,000 | 3.5% | 7.3% |
| Detroit, MI | $140,000 | 7.8% | 12.0% |
| El Paso, TX | $169,900 | 2.4% | 9.6% |
| Elgin, IL | $232,000 | 6.9% | 5.5% |
| Fort Lauderdale, FL | $289,900 | 5.4% | 9.4% |
| Fort Worth, TX | $250,000 | 2.0% | 4.2% |
| Frederick, MD | $415,800 | 6.4% | 5.3% |
| Fresno, CA | $280,000 | 0.4% | 1.8% |
| Grand Rapids, MI | $222,000 | 4.6% | 13.1% |
| Greensboro, NC | $198,900 | 6.6% | 20.5% |
| Greenville, SC | $227,400 | 5.8% | 8.4% |
| Hartford, CT | $227,000 | 8.1% | 10.5% |
| Houston, TX | $249,900 | 1.6% | 4.1% |
| Indianapolis, IN | $208,900 | 10.0% | 14.4% |
| Jacksonville, FL | $244,900 | 2.1% | 5.1% |
| Kansas City, MO | $235,000 | 7.3% | 9.3% |
| Knoxville, TN | $223,500 | 4.0% | 11.8% |
| Lake County, IL | $255,000 | 12.1% | 13.3% |
| Las Vegas, NV | $296,000 | 0.3% | 5.7% |
| Los Angeles, CA | $660,000 | 3.9% | 6.5% |
| Louisville, KY | $203,000 | 6.3% | 10.2% |
| McAllen, TX | $163,500 | -4.1% | 6.9% |
| Memphis, TN | $199,000 | 10.2% | 19.5% |
| Miami, FL | $331,500 | 3.6% | 9.4% |
| Milwaukee, WI | $236,000 | 13.1% | 12.9% |
| Minneapolis, MN | $299,000 | 5.8% | 7.5% |
| Montgomery County, PA | $330,000 | 3.8% | 8.2% |
| Nashville, TN | $315,600 | 5.2% | 8.8% |
| Nassau County, NY | $465,000 | 2.2% | 7.5% |
| New Brunswick, NJ | $335,000 | 8.1% | 8.3% |
| New Haven, CT | $222,200 | 17.0% | 12.3% |
| New Orleans, LA | $230,000 | 2.2% | 7.8% |
| New York, NY | $510,000 | 0.0% | 7.6% |
| Newark, NJ | $361,000 | 3.3% | 10.0% |
| North Port, FL | $285,000 | 0.8% | 5.6% |
| Oakland, CA | $760,000 | 7.9% | 4.1% |
| Oklahoma City, OK | $194,000 | 3.5% | 7.8% |
| Omaha, NE | $215,000 | 4.9% | 5.5% |
| Orlando, FL | $268,500 | 1.3% | 7.4% |
| Oxnard, CA | $629,500 | 4.0% | 4.9% |
| Philadelphia, PA | $240,000 | 10.1% | 21.5% |
| Phoenix, AZ | $305,000 | 2.0% | 13.0% |
| Pittsburgh, PA | $179,500 | 12.2% | 9.5% |
| Portland, OR | $419,100 | 3.5% | 6.5% |
| Providence, RI | $299,900 | 5.9% | 11.4% |
| Raleigh, NC | $303,000 | 1.6% | 6.3% |
| Richmond, VA | $265,000 | 7.7% | 4.0% |
| Riverside, CA | $400,000 | 2.6% | 8.1% |
| Rochester, NY | $152,000 | 12.6% | 10.1% |
| Sacramento, CA | $430,000 | 2.4% | 7.5% |
| Salt Lake City, UT | $364,300 | 3.2% | 12.1% |
| San Antonio, TX | $238,900 | 1.7% | 6.1% |
| San Diego, CA | $600,000 | 0.0% | 6.2% |
| San Francisco, CA | $1,450,000 | 3.6% | 3.6% |
| San Jose, CA | $1,199,000 | 8.0% | 8.0% |
| Seattle, WA | $590,000 | 2.6% | 5.4% |
| St. Louis, MO | $189,900 | 10.4% | 8.0% |
| Tacoma, WA | $405,000 | 1.4% | 11.0% |
| Tampa, FL | $245,200 | 2.4% | 9.0% |
| Tucson, AZ | $240,000 | 0.8% | 9.1% |
| Tulsa, OK | $182,000 | 0.0% | 10.0% |
| Honolulu, HI | $639,000 | 7.0% | 9.2% |
| Virginia Beach, VA | $245,000 | 4.3% | 9.9% |
| Warren, MI | $224,000 | 6.7% | 9.3% |
| Washington, D.C. | $437,000 | 5.3% | 7.6% |
| West Palm Beach, FL | $300,000 | 5.3% | 10.4% |
| Worcester, MA | $278,000 | 9.0% | 9.7% |
| National | $303,200 | 3.3% | 7.1% |
Homes Sold
| Redfin Metro | Homes Sold, seasonally adjusted | Month-Over-Month | Year-Over-Year |
|---|---|---|---|
| Albany, NY | 771 | -10.5% | -6.6% |
| Allentown, PA | 808 | -14.7% | -11.3% |
| Anaheim, CA | 2,348 | -18.1% | 1.4% |
| Atlanta, GA | 8,870 | -5.7% | -2.0% |
| Austin, TX | 3,072 | -1.1% | 2.0% |
| Bakersfield, CA | 672 | -9.5% | -10.3% |
| Baltimore, MD | 3,589 | -4.6% | 0.3% |
| Baton Rouge, LA | 863 | -1.4% | 6.0% |
| Birmingham, AL | 1,249 | -9.4% | -8.8% |
| Boston, MA | 4,207 | -3.1% | -5.2% |
| Bridgeport, CT | 1,065 | 0.8% | 9.6% |
| Buffalo, NY | 962 | -5.4% | -10.4% |
| Camden, NJ | 1,621 | -7.0% | -7.7% |
| Charlotte, NC | 4,073 | -3.0% | 5.8% |
| Chicago, IL | 7,983 | -1.2% | 2.6% |
| Cincinnati, OH | 2,543 | -7.5% | -3.5% |
| Cleveland, OH | 2,522 | -5.2% | 6.2% |
| Columbus, OH | 2,653 | -3.1% | 6.8% |
| Dallas, TX | 5,570 | -7.2% | -1.2% |
| Dayton, OH | 1,016 | -6.7% | 5.3% |
| Denver, CO | 4,688 | -1.3% | 2.8% |
| Detroit, MI | 1,477 | -20.1% | -16.0% |
| El Paso, TX | 698 | -4.7% | -4.0% |
| Elgin, IL | 991 | 1.8% | 10.3% |
| Fort Lauderdale, FL | 2,759 | -6.2% | -6.9% |
| Fort Worth, TX | 2,822 | -2.7% | -4.5% |
| Frederick, MD | 1,562 | -6.3% | 14.6% |
| Fresno, CA | 680 | -8.0% | -11.1% |
| Grand Rapids, MI | 1,268 | -10.4% | 4.3% |
| Greensboro, NC | 786 | -7.1% | -3.7% |
| Greenville, SC | 1,143 | 0.8% | 7.2% |
| Hartford, CT | 1,385 | -0.3% | 8.4% |
| Houston, TX | 7,662 | -3.6% | 1.0% |
| Indianapolis, IN | 3,024 | -1.6% | 5.6% |
| Jacksonville, FL | 2,513 | -5.0% | 3.3% |
| Kansas City, MO | 2,971 | -3.4% | 6.6% |
| Knoxville, TN | 1,207 | 1.0% | 0.7% |
| Lake County, IL | 1,095 | -0.8% | 4.7% |
| Las Vegas, NV | 3,198 | -13.8% | 0.2% |
| Los Angeles, CA | 5,242 | -14.3% | -4.5% |
| Louisville, KY | 1,319 | -2.2% | -1.1% |
| McAllen, TX | 291 | 4.3% | 3.1% |
| Memphis, TN | 933 | -17.0% | -17.5% |
| Miami, FL | 2,170 | -11.9% | -15.4% |
| Milwaukee, WI | 1,804 | -0.5% | 6.7% |
| Minneapolis, MN | 5,413 | 1.4% | 10.4% |
| Montgomery County, PA | 2,305 | -4.5% | -3.1% |
| Nashville, TN | 3,352 | -6.3% | 1.6% |
| Nassau County, NY | 2,109 | -20.3% | -17.5% |
| New Brunswick, NJ | 3,029 | -6.4% | -4.8% |
| New Haven, CT | 893 | -4.6% | 2.4% |
| New Orleans, LA | 1,196 | -4.8% | -2.8% |
| New York, NY | 3,668 | -19.4% | -21.9% |
| Newark, NJ | 2,066 | -3.9% | -6.1% |
| North Port, FL | 1,985 | -3.1% | 7.0% |
| Oakland, CA | 2,072 | -6.9% | -8.3% |
| Oklahoma City, OK | 1,784 | -10.8% | -6.0% |
| Omaha, NE | 1,161 | -3.8% | 10.0% |
| Orlando, FL | 3,852 | -2.9% | -0.8% |
| Oxnard, CA | 698 | -3.2% | 2.4% |
| Philadelphia, PA | 1,990 | -16.1% | -7.4% |
| Phoenix, AZ | 7,832 | -8.1% | 2.1% |
| Pittsburgh, PA | 2,090 | -6.2% | -0.5% |
| Portland, OR | 3,238 | -5.5% | 5.3% |
| Providence, RI | 1,880 | -3.2% | 1.0% |
| Raleigh, NC | 2,486 | -2.0% | 10.9% |
| Richmond, VA | 1,618 | -7.7% | -0.6% |
| Riverside, CA | 4,637 | -5.5% | 1.0% |
| Rochester, NY | 840 | -21.8% | -21.2% |
| Sacramento, CA | 2,433 | -3.9% | -8.2% |
| Salt Lake City, UT | 1,373 | -14.3% | -10.3% |
| San Antonio, TX | 2,726 | -5.0% | -3.8% |
| San Diego, CA | 2,927 | -5.8% | 0.8% |
| San Francisco, CA | 848 | -6.7% | -9.1% |
| San Jose, CA | 1,065 | -11.6% | -11.9% |
| Seattle, WA | 3,976 | -1.4% | 7.5% |
| St. Louis, MO | 3,349 | -6.3% | -0.8% |
| Tacoma, WA | 1,218 | -0.7% | -7.4% |
| Tampa, FL | 5,285 | -5.8% | -1.1% |
| Tucson, AZ | 1,434 | -10.2% | -1.3% |
| Tulsa, OK | 1,033 | -10.2% | -11.4% |
| Honolulu, HI | 719 | -4.9% | -6.7% |
| Virginia Beach, VA | 2,252 | -4.0% | 8.1% |
| Warren, MI | 3,322 | -3.6% | -3.3% |
| Washington, D.C. | 6,168 | -2.6% | 0.0% |
| West Palm Beach, FL | 2,577 | -10.5% | -7.9% |
| Worcester, MA | 1,048 | -1.4% | 3.0% |
| National | 511,000 | -9.1% | -1.2% |
New Listings
| Redfin Metro | New Listings, seasonally adjusted | Month-Over-Month | Year-Over-Year |
|---|---|---|---|
| Albany, NY | 881 | -14.0% | -17.3% |
| Allentown, PA | 608 | -15.7% | -45.5% |
| Anaheim, CA | 2,122 | -25.3% | -28.5% |
| Atlanta, GA | 9,682 | -2.0% | -8.2% |
| Austin, TX | 3,490 | 0.3% | 2.5% |
| Bakersfield, CA | 799 | -6.0% | -14.4% |
| Baltimore, MD | 3,915 | -8.2% | -9.5% |
| Baton Rouge, LA | 758 | -13.7% | -31.9% |
| Birmingham, AL | 1,256 | -5.3% | -20.0% |
| Boston, MA | 4,512 | -22.7% | -14.5% |
| Bridgeport, CT | 1,203 | -14.7% | -18.7% |
| Buffalo, NY | 878 | -24.9% | -22.9% |
| Camden, NJ | 1,498 | -19.9% | -27.8% |
| Charlotte, NC | 3,439 | -22.0% | -20.1% |
| Chicago, IL | 8,165 | -25.3% | -21.9% |
| Cincinnati, OH | 2,800 | -2.3% | -3.7% |
| Cleveland, OH | 2,558 | -7.4% | -15.3% |
| Columbus, OH | 2,683 | -4.7% | -4.8% |
| Dallas, TX | 6,715 | -7.8% | -7.5% |
| Dayton, OH | 1,030 | -8.0% | -4.7% |
| Denver, CO | 5,361 | 3.0% | 6.4% |
| Detroit, MI | 2,022 | -16.2% | -15.6% |
| El Paso, TX | 840 | -7.5% | -1.8% |
| Elgin, IL | 915 | -24.8% | -21.7% |
| Fort Lauderdale, FL | 3,059 | -2.0% | -23.6% |
| Fort Worth, TX | 3,256 | -8.1% | -6.5% |
| Frederick, MD | 1,566 | -10.4% | -8.4% |
| Fresno, CA | 769 | -5.5% | -12.1% |
| Grand Rapids, MI | 1,360 | -8.8% | -2.1% |
| Greensboro, NC | 759 | -2.1% | -13.4% |
| Greenville, SC | 1,187 | -2.0% | -5.9% |
| Hartford, CT | 1,532 | -4.7% | -6.0% |
| Houston, TX | 9,658 | -4.6% | -1.5% |
| Indianapolis, IN | 2,805 | -4.7% | -0.1% |
| Jacksonville, FL | 2,911 | 3.3% | 1.0% |
| Kansas City, MO | 1,838 | -37.7% | -43.8% |
| Knoxville, TN | 1,122 | -1.3% | -14.1% |
| Lake County, IL | 1,200 | -16.0% | -17.1% |
| Las Vegas, NV | 3,632 | -4.0% | -14.8% |
| Los Angeles, CA | 5,185 | -24.7% | -25.4% |
| Louisville, KY | 1,341 | -11.2% | -11.3% |
| McAllen, TX | 398 | -15.8% | -11.1% |
| Memphis, TN | 1,116 | -4.3% | -16.6% |
| Miami, FL | 2,969 | -18.4% | -27.9% |
| Milwaukee, WI | 1,797 | -5.8% | -0.2% |
| Minneapolis, MN | 5,917 | 2.3% | 12.0% |
| Montgomery County, PA | 2,018 | -24.9% | -24.2% |
| Nashville, TN | 3,883 | -5.3% | -4.7% |
| Nassau County, NY | 2,355 | -31.5% | -32.6% |
| New Brunswick, NJ | 2,686 | -34.3% | -32.9% |
| New Haven, CT | 1,018 | -11.6% | -12.9% |
| New Orleans, LA | 1,394 | 0.3% | -7.0% |
| New York, NY | 5,184 | -32.1% | -34.3% |
| Newark, NJ | 2,155 | -18.5% | -28.6% |
| North Port, FL | 2,122 | -3.1% | -7.2% |
| Oakland, CA | 1,783 | -29.5% | -31.7% |
| Oklahoma City, OK | 2,059 | -6.0% | -0.8% |
| Omaha, NE | 1,266 | -2.9% | 30.8% |
| Orlando, FL | 4,335 | -1.7% | -5.9% |
| Oxnard, CA | 682 | -13.7% | -22.1% |
| Philadelphia, PA | 2,142 | -22.4% | -23.0% |
| Phoenix, AZ | 8,507 | 1.7% | -1.9% |
| Pittsburgh, PA | 1,814 | -29.8% | -26.7% |
| Portland, OR | 3,548 | -2.4% | 1.0% |
| Providence, RI | 2,034 | -6.5% | -9.0% |
| Raleigh, NC | 2,394 | -8.1% | -1.7% |
| Richmond, VA | 1,737 | -2.9% | -2.4% |
| Riverside, CA | 4,240 | -21.3% | -25.3% |
| Rochester, NY | 1,069 | -9.4% | -9.2% |
| Sacramento, CA | 2,986 | -3.4% | -0.3% |
| Salt Lake City, UT | 1,226 | -5.9% | -27.3% |
| San Antonio, TX | 3,075 | -8.3% | -9.7% |
| San Diego, CA | 3,131 | -4.4% | -8.9% |
| San Francisco, CA | 850 | -39.0% | -22.4% |
| San Jose, CA | 1,196 | -10.6% | -18.6% |
| Seattle, WA | 4,175 | -1.6% | -4.1% |
| St. Louis, MO | 2,421 | -23.9% | -37.4% |
| Tacoma, WA | 1,417 | -6.0% | 4.9% |
| Tampa, FL | 5,741 | -2.1% | -7.1% |
| Tucson, AZ | 1,637 | 0.1% | 0.7% |
| Tulsa, OK | 665 | -36.5% | -49.9% |
| Honolulu, HI | 793 | -11.7% | -21.0% |
| Virginia Beach, VA | 2,448 | -2.2% | -1.5% |
| Warren, MI | 3,209 | -23.7% | -21.6% |
| Washington, D.C. | 6,730 | -1.6% | -1.9% |
| West Palm Beach, FL | 3,253 | -7.9% | -12.5% |
| Worcester, MA | 1,191 | -7.1% | 3.2% |
| National | 551,600 | -12.5% | -10.8% |
All Homes for Sale
| Redfin Metro | All Homes for Sale, seasonally adjusted | Month-Over-Month | Year-Over-Year |
|---|---|---|---|
| Albany, NY | 3,508 | -9.9% | -16.4% |
| Allentown, PA | 2,257 | -12.4% | -38.8% |
| Anaheim, CA | 8,210 | -13.6% | -30.6% |
| Atlanta, GA | 33,703 | -1.9% | -8.5% |
| Austin, TX | 9,942 | 0.0% | -10.8% |
| Bakersfield, CA | 2,443 | -2.1% | -18.1% |
| Baltimore, MD | 12,914 | -2.9% | -13.2% |
| Baton Rouge, LA | 3,927 | -5.2% | -20.3% |
| Birmingham, AL | 4,972 | -1.9% | -18.4% |
| Boston, MA | 13,085 | -2.3% | -8.0% |
| Bridgeport, CT | 6,351 | -3.7% | -7.6% |
| Buffalo, NY | 2,839 | -4.7% | -17.7% |
| Camden, NJ | 6,352 | -7.5% | -27.4% |
| Charlotte, NC | 13,987 | -2.3% | -14.9% |
| Chicago, IL | 34,645 | -10.8% | -12.0% |
| Cincinnati, OH | 9,428 | -0.4% | -13.9% |
| Cleveland, OH | 9,045 | -5.9% | -19.1% |
| Columbus, OH | 8,602 | -1.4% | -3.8% |
| Dallas, TX | 23,730 | -1.9% | -7.4% |
| Dayton, OH | 3,293 | -5.7% | -10.3% |
| Denver, CO | 11,962 | -0.2% | -6.6% |
| Detroit, MI | 7,021 | -4.7% | -7.8% |
| El Paso, TX | 3,466 | -2.7% | 1.3% |
| Elgin, IL | 3,819 | -6.3% | -8.1% |
| Fort Lauderdale, FL | 15,645 | -1.7% | -14.0% |
| Fort Worth, TX | 10,282 | -5.9% | -5.1% |
| Frederick, MD | 4,518 | -5.8% | -11.3% |
| Fresno, CA | 2,146 | -2.9% | -21.2% |
| Grand Rapids, MI | 3,757 | -1.1% | -3.5% |
| Greensboro, NC | 2,183 | -6.1% | -30.7% |
| Greenville, SC | 5,115 | -1.8% | -1.6% |
| Hartford, CT | 6,348 | 0.6% | -6.1% |
| Houston, TX | 36,124 | -0.6% | -3.0% |
| Indianapolis, IN | 7,774 | -1.6% | -9.1% |
| Jacksonville, FL | 9,904 | 1.1% | -10.6% |
| Kansas City, MO | 6,879 | -17.5% | -33.6% |
| Knoxville, TN | 4,565 | -0.4% | -9.3% |
| Lake County, IL | 5,391 | -2.0% | -6.3% |
| Las Vegas, NV | 12,219 | -3.6% | -22.6% |
| Los Angeles, CA | 19,349 | -8.5% | -27.7% |
| Louisville, KY | 4,325 | -3.2% | -8.3% |
| McAllen, TX | 2,203 | -1.0% | -9.2% |
| Memphis, TN | 3,684 | -3.5% | -13.3% |
| Miami, FL | 20,003 | -1.9% | -11.7% |
| Milwaukee, WI | 6,334 | -0.8% | -3.4% |
| Minneapolis, MN | 15,788 | 0.2% | 1.2% |
| Montgomery County, PA | 7,194 | -12.1% | -20.4% |
| Nashville, TN | 14,056 | -1.2% | -6.7% |
| Nassau County, NY | 12,436 | -10.5% | -15.6% |
| New Brunswick, NJ | 13,822 | -6.3% | -19.1% |
| New Haven, CT | 4,278 | -4.3% | -9.9% |
| New Orleans, LA | 5,411 | -1.3% | -3.4% |
| New York, NY | 34,696 | -2.3% | -19.1% |
| Newark, NJ | 10,120 | -2.3% | -12.1% |
| North Port, FL | 8,153 | -1.3% | -17.3% |
| Oakland, CA | 4,722 | -4.9% | -26.0% |
| Oklahoma City, OK | 6,595 | -2.4% | -6.2% |
| Omaha, NE | 3,046 | -0.9% | 8.2% |
| Orlando, FL | 13,137 | -0.2% | -14.7% |
| Oxnard, CA | 2,519 | -5.9% | -19.3% |
| Philadelphia, PA | 8,222 | -10.4% | -14.9% |
| Phoenix, AZ | 22,610 | 1.3% | -23.6% |
| Pittsburgh, PA | 9,908 | -8.9% | -10.5% |
| Portland, OR | 9,520 | -0.5% | -10.0% |
| Providence, RI | 7,040 | -3.6% | -12.4% |
| Raleigh, NC | 8,433 | -6.3% | -5.6% |
| Richmond, VA | 4,743 | -0.9% | -7.4% |
| Riverside, CA | 16,748 | -11.8% | -26.7% |
| Rochester, NY | 2,650 | -4.3% | -13.5% |
| Sacramento, CA | 7,683 | 0.5% | -11.4% |
| Salt Lake City, UT | 2,959 | -5.3% | -46.7% |
| San Antonio, TX | 11,811 | -4.1% | -7.9% |
| San Diego, CA | 8,118 | -5.2% | -25.3% |
| San Francisco, CA | 2,347 | -12.7% | -11.8% |
| San Jose, CA | 2,700 | -7.3% | -28.1% |
| Seattle, WA | 9,251 | -1.9% | -19.1% |
| St. Louis, MO | 9,743 | -11.7% | -25.8% |
| Tacoma, WA | 2,994 | 1.7% | -14.1% |
| Tampa, FL | 17,119 | -1.3% | -17.9% |
| Tucson, AZ | 5,117 | -2.5% | -16.0% |
| Tulsa, OK | 3,098 | -6.3% | -39.3% |
| Honolulu, HI | 4,092 | -2.3% | -11.8% |
| Virginia Beach, VA | 7,962 | -0.3% | -14.5% |
| Warren, MI | 11,033 | -4.5% | -9.5% |
| Washington, D.C. | 18,399 | -1.4% | -10.0% |
| West Palm Beach, FL | 15,486 | -2.6% | -14.8% |
| Worcester, MA | 3,450 | -5.9% | -4.1% |
| National | 1,909,500 | -7.0% | -13.0% |


