-
The pool of homes for sale is shrinking because homeowners feel trapped by rising mortgage rates, with new listings down 25% to the third lowest level on record.
-
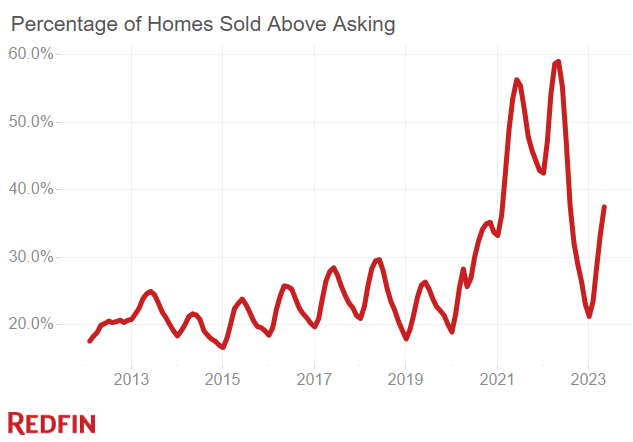
A shortage of homes for sale is fueling bidding wars in some areas despite sluggish homebuyer demand; 37% of homes that sold in May went for more than their list price, a higher share than usual for this time of year.
-
Homebuyer competition is propping up prices, which were down just 3% in May from the record high hit a year earlier.
The number of homes for sale in the U.S. fell 7.1% year over year to 1.4 million on a seasonally adjusted basis in May. That’s the lowest level in Redfin’s records, which date back to 2012, and the first annual decline since April 2022.
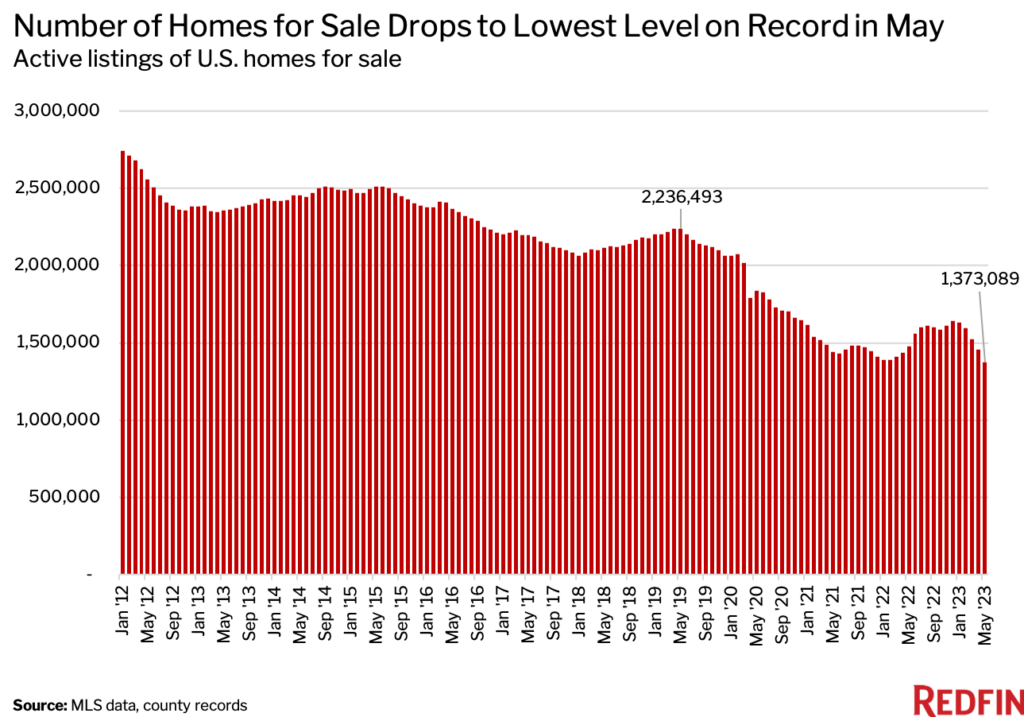
By comparison, there were 2.2 million homes for sale in May 2019—before the pandemic rocked the U.S. housing market—meaning housing supply was 38.6% below pre-pandemic levels this May.
America’s housing stock is dwindling because there are very few people selling homes. New listings of homes for sale declined 25.2% year over year in May to the third lowest level on record on a seasonally adjusted basis, as homeowners were handcuffed by high mortgage rates.
Nearly every homeowner with a mortgage has an interest rate below 6%, meaning many are opting to stay put because selling and buying a new home would mean taking on a higher monthly mortgage payment. The average 30-year-fixed mortgage rate in May was 6.43%, up from 5.23% a year earlier and a record low of 2.65% in 2021.
Housing supply had already been lacking for years due to a steep dropoff in homebuilding following the 2008 financial crisis. The shortage intensified in 2020 and 2021 because rock-bottom mortgage rates prompted scores of people to buy homes.
May 2023 Highlights
| May 2023 | Month-Over-Month Change | Year-Over-Year Change | |
| Median sale price | $419,103 | 2.8% | -3.1% |
| Pending sales, seasonally adjusted | 376,413 | -0.2% | -21.4% |
| Homes sold, seasonally adjusted | 421,067 | -1.2% | -19.8% |
| New listings, seasonally adjusted | 465,109 | 0.9% | -25.2% |
| All homes for sale, seasonally adjusted (active listings) | 1,373,089 | -5.8% | -7.1% |
| Months of supply | 1.8 | -0.4 | 0.2 |
| Median days on market | 31 | -5 | 14 |
| Share of for-sale homes with a price drop | 14.5% | 1.8 ppts | 3.6 ppts |
| Share of homes sold above final list price | 37.5% | 3.9 ppts | -21.5 ppts |
| Average sale-to-final-list-price ratio | 100% | 0.5 ppts | -3.1 ppts |
| Share of home offers written by Redfin agents that faced competition, seasonally adjusted | 46.7% | -1.1 ppts | -9.4 ppts |
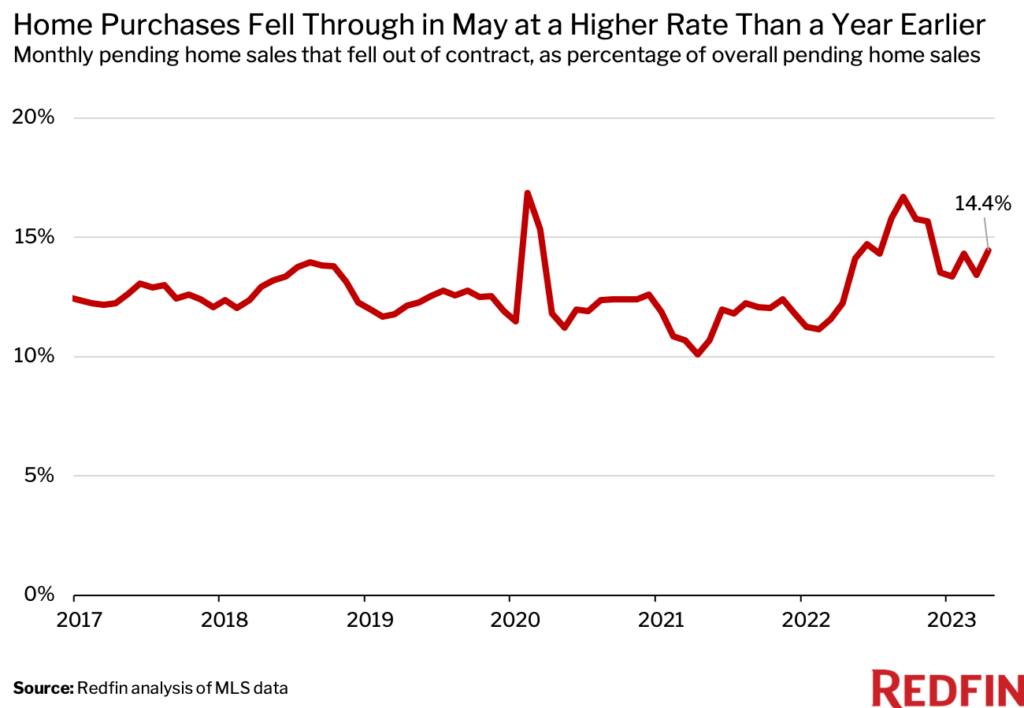
| Pending sales that fell out of contract, as % of overall pending sales | 14.4% | 1 ppt | 2.2 ppts |
| Average 30-year fixed mortgage rate | 6.43% | 0.09 ppts | 1.2 ppts |
Note: Data is subject to revision
The Intensifying Housing Shortage Is Propping Up Home Prices
As the pool of homes for sale shrinks, homebuyers in many markets are grappling with competition, which is preventing home prices from plunging despite a cooldown in buyer demand brought on by elevated mortgage rates.
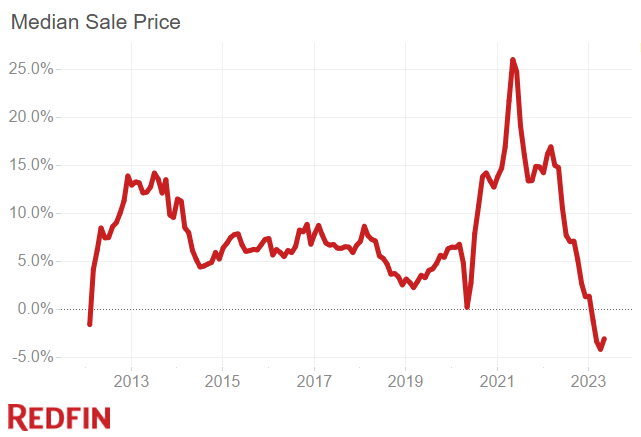
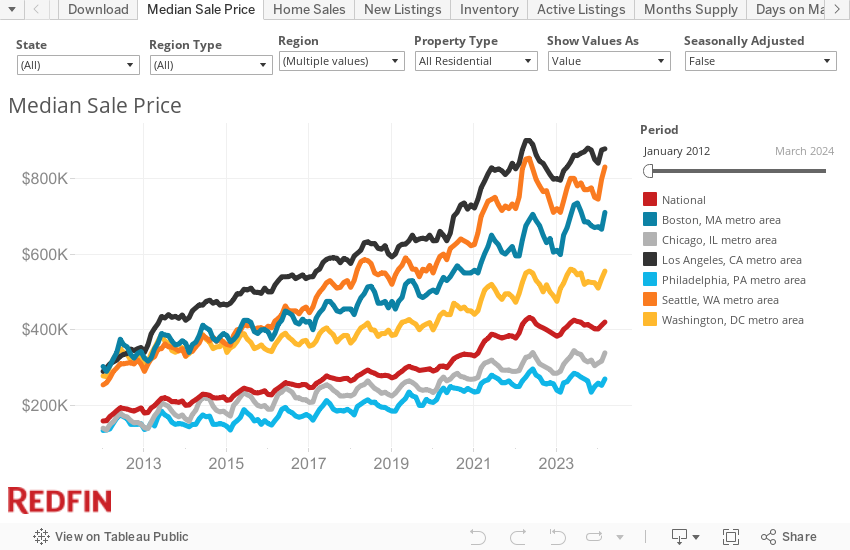
The median U.S. home sale price was $419,103 in May. That’s down just 3.1% from a year earlier, when prices hit a record high of $432,311. While home prices fell in May, they posted a smaller decline than they did in April, when prices dropped 4.2% from a year earlier—the largest decrease on record with the exception of January 2012.
The typical home that sells is no longer selling at a discount. The average sale-to-list-price ratio, which measures how close homes are selling to their final asking prices, was 100% in May, meaning the typical home that sold was purchased at its list price. That’s down from 103.1% a year earlier, but is the highest level of any May on record prior to the pandemic and follows nine straight months of sub-100% sale-to-list-price ratios.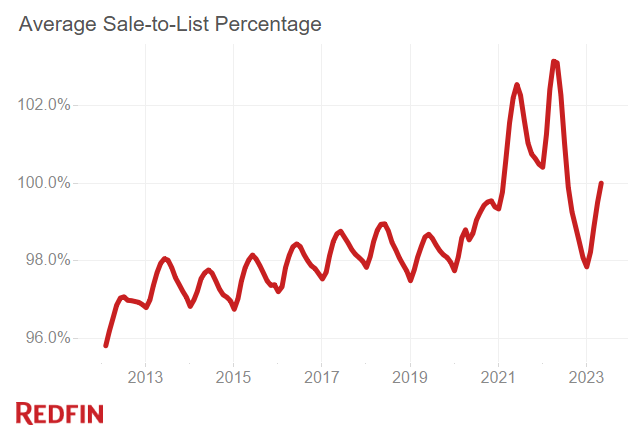
“It’s too early to say that price declines have bottomed out,” said Redfin Chief Economist Daryl Fairweather. “Prices may have room to fall because mortgage rates could still rise. The Federal Reserve just signaled that it is likely to continue raising interest rates this year. That could further hamper homebuyer demand and cause home prices to fall in the near term, though the drops would be minimal. We’re unlikely to see double-digit price declines like we did during the 2008 housing crisis.”
Fairweather continued: “Many people think it’s a bad time to buy a home because mortgage rates are high, but they should keep in mind that when rates do ultimately fall, many buyers waiting on the sidelines could jump back in. That could lead to more bidding wars since there aren’t enough homes for sale, and heightened competition could push up prices, offsetting some or all of the benefit of lower interest rates.”
It’s worth noting that price changes differ vastly from market to market. For example, Austin, TX, Boise, ID and Oakland, CA all saw double-digit year-over-year price declines in May, while prices rose roughly 10% in Hartford, CT, Rochester, NY and Cincinnati. Pandemic boomtowns and expensive coastal hubs have seen their housing markets slow relatively quickly because prices soared to unsustainable levels during the pandemic and are now coming back down to earth.
The Housing Shortage Is Fueling Homebuyer Competition in Many Markets
While demand from homebuyers has fallen, new listings have fallen even further, meaning many of the buyers who are out there are encountering bidding wars.
Even though the typical home that sold in May was purchased for its list price, more than one-third (37.5%) went for more than their list prices—a sign that some buyers are facing competition. That’s down from 59% a year earlier but is the highest share of any May on record prior to the pandemic.
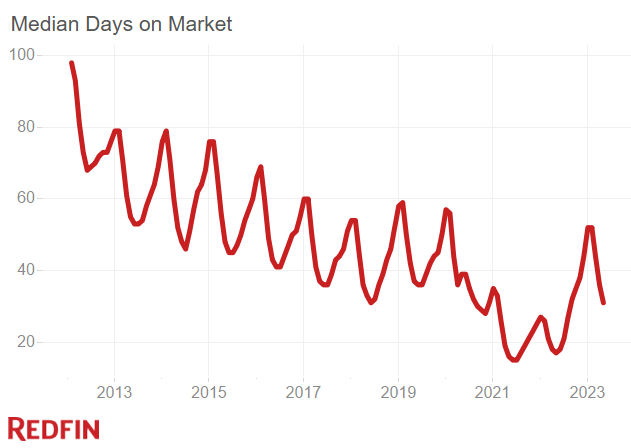
Speed is another good way to gauge competition; the typical home that sold in May went under contract in 31 days. That’s nearly twice as long as a year earlier (17 days) but is the shortest timespan of any Many on record prior to the pandemic.
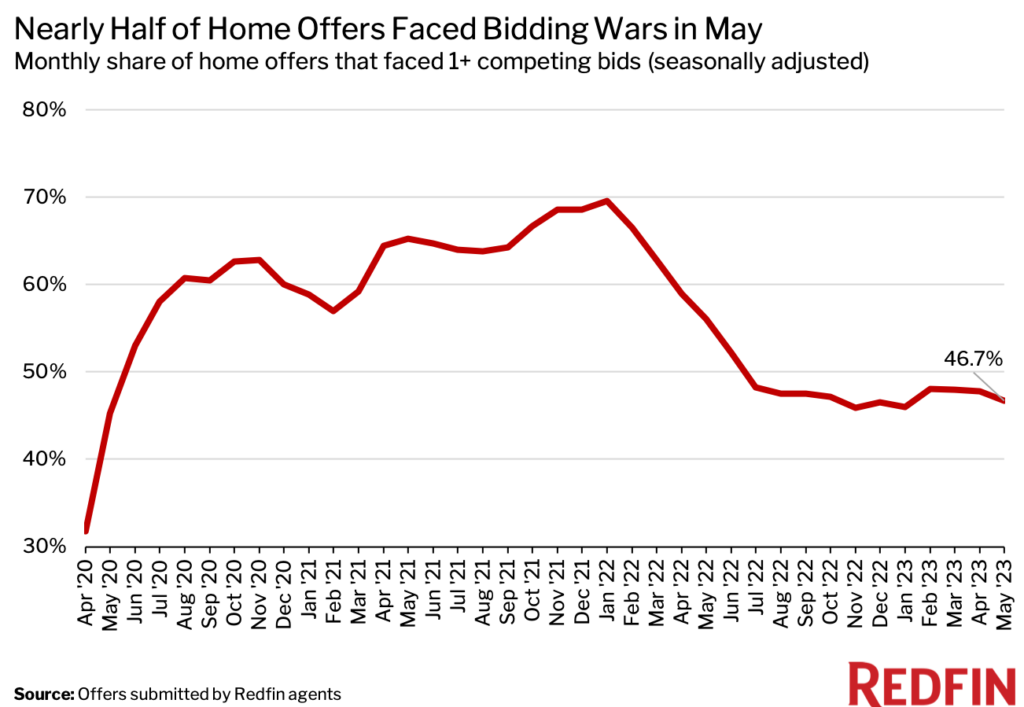
Nearly half (46.7%) of home offers written by Redfin agents faced a bidding war in May on a seasonally adjusted basis. While that’s down from 56.1% a year earlier and a peak of 69.6% in January 2022, it’s notable that so many buyers are facing competition at a time when demand is sluggish. An offer is considered part of a bidding war if a Redfin agent reported that it faced at least one competing bid.
“There’s a huge lack of housing inventory in Miami, and that combined with higher interest rates is making homebuyers’ lives very challenging. Their money just isn’t going as far,” said local Redfin Premier real estate agent Rafael Corrales. “I’m encouraging my buyers to be a little more flexible; in some cases, I’m suggesting they go back to 2021 winning strategies, which can mean waiving contingencies and offering high earnest money deposits because they’re competing against a lot of cash buyers.”
One-third (33.4%) of U.S. home purchases were made in cash in April, the latest month for which data is available. That’s up from 30.7% a year earlier and comparable with February’s 33.5% share, which was the highest in nine years. Cash purchases are becoming more common because elevated mortgage rates are deterring many house hunters who would need to take out mortgages, leaving cash buyers to take up a larger piece of the homebuying pie.
Home Sales Are Falling, But Not as Quickly as They Were at the Start of the Year
Closed home sales fell 19.8% year over year on a seasonally adjusted basis in May, the smallest drop in nearly a year and an improvement from the record 35.3% decline in January. Still, sales were significantly below pre-pandemic levels, down 21% from May 2019.
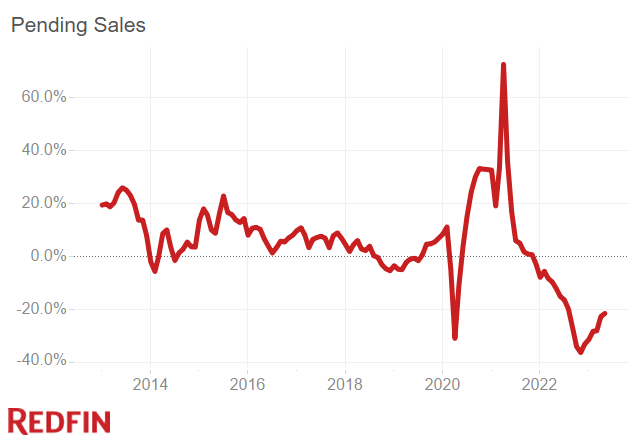
Pending home sales performed similarly. They fell 21.4% year over year on a seasonally adjusted basis in May, the smallest drop since last summer and an improvement from the record 36.1% decline in November. Pending sales were down 16.1% from May 2019 levels.
Metro-Level Highlights: May 2023
Data in the bullets below came from a list of the 91 U.S. metro areas with populations of at least 750,000. Select metros may be excluded from time to time to ensure data accuracy. A full metro-level data table can be found in the “download” tab of the dashboard embedded below or in the monthly section of the Redfin Data Center. Refer to our metrics definition page for explanations of metrics used in this report. Metro-level data is not seasonally adjusted.
- Pending sales: In Boise, pending sales fell 70.1% year over year, more than any other metro Redfin analyzed. It was followed by Baton Rouge, LA (-66%) and Allentown, PA (-54%). The smallest declines were in Dallas (-0.3%), Fort Worth (-2.2%) and Buffalo, NY (-3.5%).
- Closed sales: In Tacoma, WA, closed home sales dropped 38.9% year over year, more than any other metro Redfin analyzed. Next came Seattle (-34.7%) and Portland, OR (-32.9%). The smallest declines were in Atlanta (-1.5%), North Port, FL (-2.1%) and Fort Worth (-4.4%).
- Prices: Median sale prices fell from a year earlier in 40 of the metros Redfin analyzed. The biggest declines were in Austin (-15.1%), Boise (-14.3%) and Oakland (-11.2%). The biggest increases were in Hartford (10%), Rochester (9.7%) and Cincinnati (9.3%).
- Listings: New listings fell most from a year earlier in Allentown (-55.7%), Greensboro, NC (-51.1%) and Boise (-48.8%). They fell least in McAllen, TX (-7.3%), Buffalo (-8.9%) and El Paso, TX (-9.4%).
- Supply: Active listings fell most from a year earlier in Allentown (-46%), Greensboro (-38.6%) and Cincinnati (-37.6%). They rose most in North Port (50.8%), New Orleans (45.9%) and McAllen (40.4%).
- Competition: In Rochester, 72.7% of homes sold above their final list price, down from 75.8% a year earlier. That 3.1-percentage-point decline is the smallest among the metros Redfin analyzed. Next came Milwaukee (-3.4 ppts) and Hartford (-4.3 ppts). The largest declines were in Austin (-48 ppts), Dallas (-40.4 ppts) and North Port (-36.9 ppts).
Below is a market-by-market breakdown of home-purchase cancellations, which aren’t in the Redfin Data Center.
Home-Purchase Cancellations
Data below came from a list of the 50 most populous metro areas.
| Metro Area | May 2023: Pending Sales That Fell Out of Contract, as % of Overall Pending Sales | April 2023: Pending Sales That Fell Out of Contract, as % of Overall Pending Sales | May 2022: Pending Sales That Fell Out of Contract, as % of Overall Pending Sales |
| Anaheim, CA | 13.1% | 12.5% | 14.7% |
| Atlanta, GA | 20.6% | 18.4% | 17.2% |
| Austin, TX | 13.2% | 11.2% | 13.5% |
| Baltimore, MD | 9.5% | 10.5% | 10.9% |
| Boston, MA | 7.2% | 7.7% | 6.9% |
| Charlotte, NC | 10.4% | 10.4% | 8.1% |
| Chicago, IL | 14.4% | 13.3% | 13.8% |
| Cincinnati, OH | 11.4% | 9.8% | 10.9% |
| Cleveland, OH | 15.3% | 14.6% | 14.2% |
| Columbus, OH | 13.1% | 11.2% | 10.8% |
| Dallas, TX | 17.3% | 15.5% | 16.8% |
| Denver, CO | 14.7% | 13.3% | 6.6% |
| Detroit, MI | 16.1% | 14.0% | 14.8% |
| Fort Lauderdale, FL | 20.8% | 19.3% | 20.9% |
| Fort Worth, TX | 18.3% | 16.2% | 15.8% |
| Houston, TX | 18.6% | 16.9% | 18.5% |
| Indianapolis, IN | 15.4% | 14.7% | 12.1% |
| Jacksonville, FL | 21.8% | 19.5% | 21.7% |
| Kansas City, MO | 12.9% | 10.6% | 10.1% |
| Las Vegas, NV | 21.5% | 18.4% | 21.4% |
| Los Angeles, CA | 14.6% | 14.1% | 15.2% |
| Miami, FL | 19.6% | 16.7% | 19.3% |
| Milwaukee, WI | 8.0% | 6.5% | 8.1% |
| Minneapolis, MN | 7.7% | 7.9% | 6.5% |
| Montgomery County, PA | 6.1% | 5.6% | 5.4% |
| Nashville, TN | 14.6% | 12.1% | 11.2% |
| Nassau County, NY | 4.1% | 3.8% | 4.3% |
| New Brunswick, NJ | 10.9% | 11.9% | 10.0% |
| New York, NY | 8.4% | 8.0% | 5.6% |
| Newark, NJ | 8.9% | 10.0% | 1.8% |
| Oakland, CA | 6.8% | 8.3% | 7.4% |
| Orlando, FL | 21.1% | 19.4% | 20.6% |
| Philadelphia, PA | 12.4% | 11.4% | 11.9% |
| Phoenix, AZ | 18.0% | 15.4% | 19.3% |
| Pittsburgh, PA | 15.3% | 12.1% | 12.2% |
| Portland, OR | 11.5% | 11.7% | 10.7% |
| Providence, RI | 8.8% | 9.3% | 8.7% |
| Riverside, CA | 17.5% | 16.5% | 18.0% |
| Sacramento, CA | 13.4% | 14.7% | 13.0% |
| San Antonio, TX | 20.4% | 18.8% | 17.9% |
| San Diego, CA | 13.7% | 13.0% | 14.5% |
| San Francisco, CA | 4.8% | 4.0% | 4.7% |
| San Jose, CA | 6.2% | 6.6% | 6.7% |
| Seattle, WA | 7.3% | 8.6% | 5.5% |
| St. Louis, MO | 11.7% | 11.1% | 10.7% |
| Tampa, FL | 21.7% | 18.9% | 20.1% |
| Virginia Beach, VA | 12.3% | 13.0% | 12.3% |
| Warren, MI | 11.9% | 11.1% | 9.6% |
| Washington, D.C. | 9.6% | 9.2% | 9.3% |
| West Palm Beach, FL | 17.3% | 17.4% | 20.2% |
| National—U.S.A. | 14.4% | 13.4% | 12.2% |