Home sellers are starting to come off the sidelines to meet buyer demand as mortgage rates steadily decline, with new listings and pending sales both posting their smallest drops in four months.
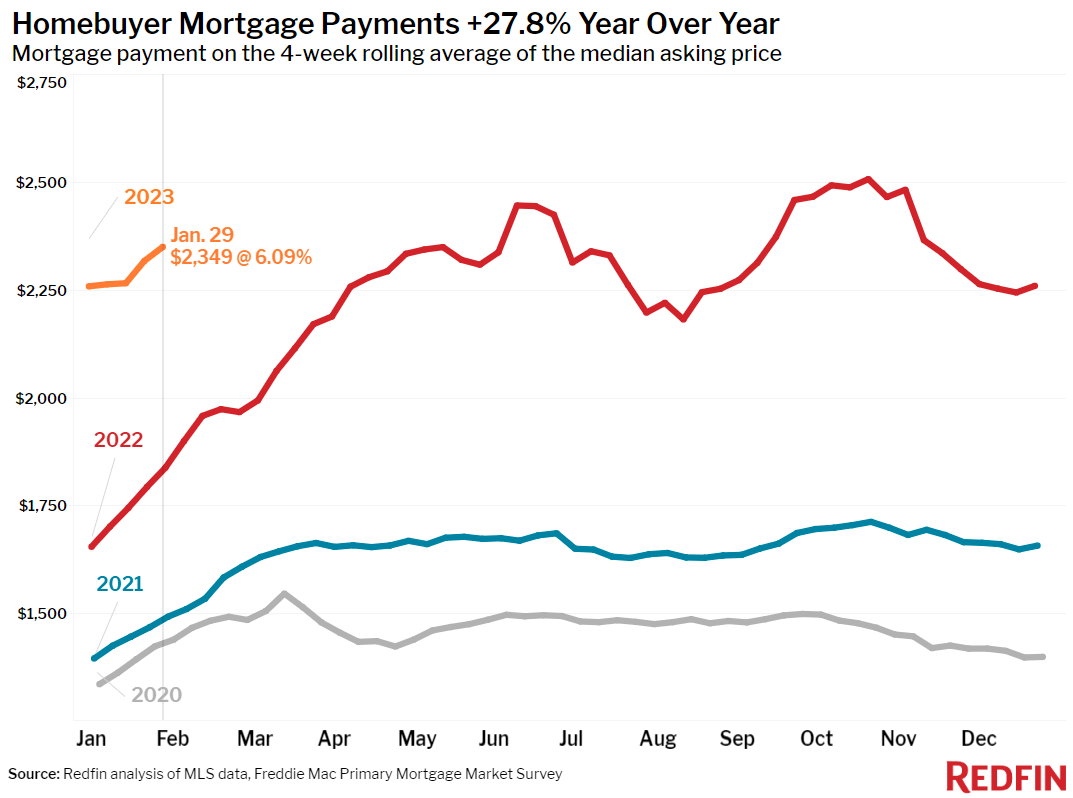
A homebuyer on a $2,500 monthly budget can afford a $400,000 home for the first time in four months as mortgage rates dip below 6%. The average daily mortgage rate came in at 5.99% on February 2, the first sub-6% average since mid-September, according to Mortgage News Daily. To look at it another way, a buyer with a $2,500 monthly budget can afford to spend about $35,000 more on a home than they could have when rates peaked at over 7% in November.
A buyer on that budget still has about $95,000 less in spending power than they did a year ago, when rates were sitting around 3.5%. But rates dropping by more than a full percentage point from their apex is a relief for buyers who had been waiting for rates to come down.
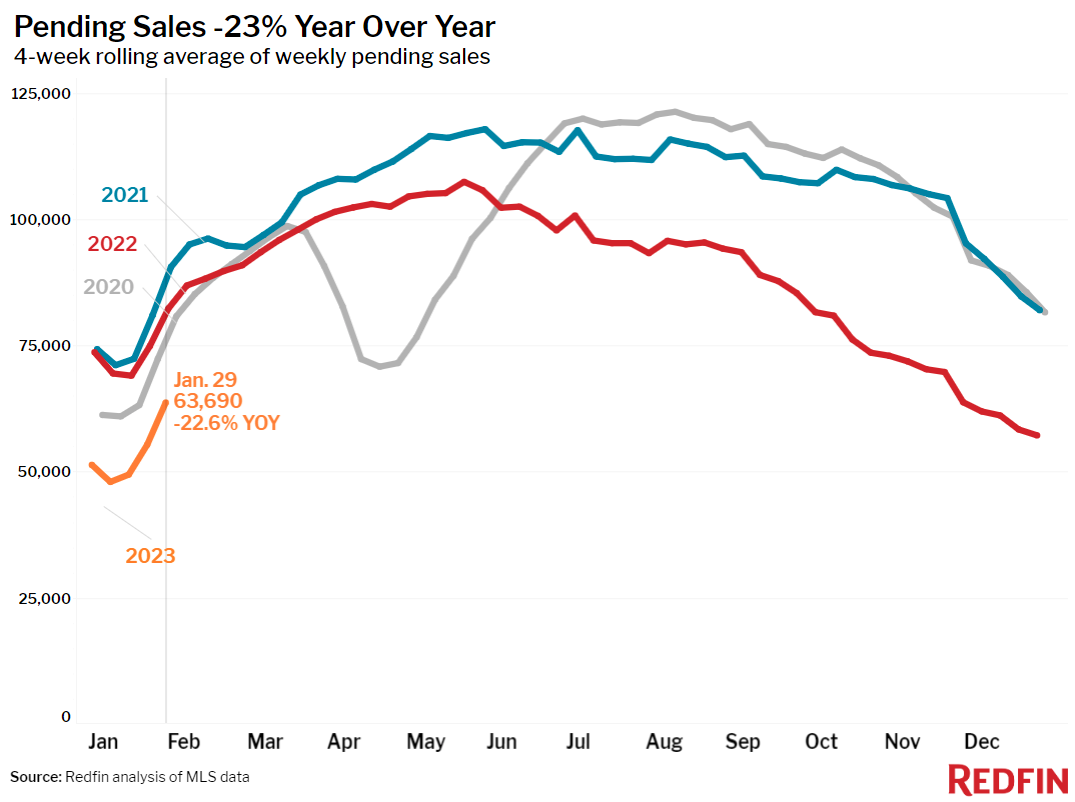
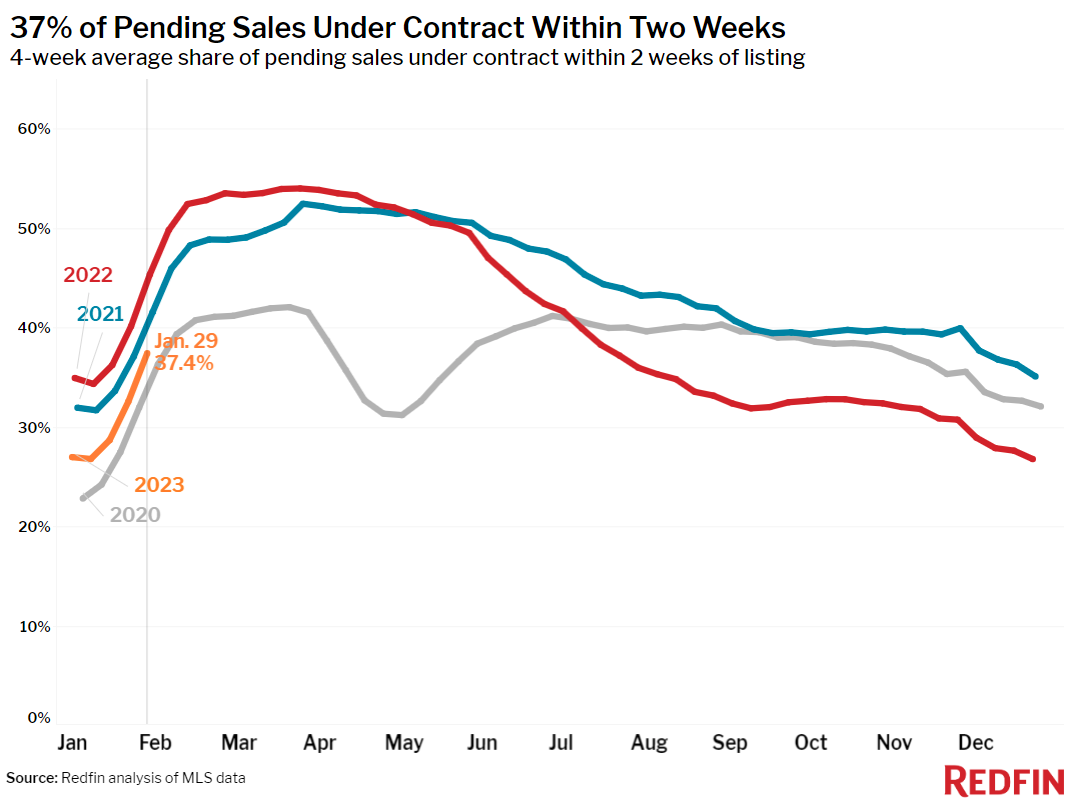
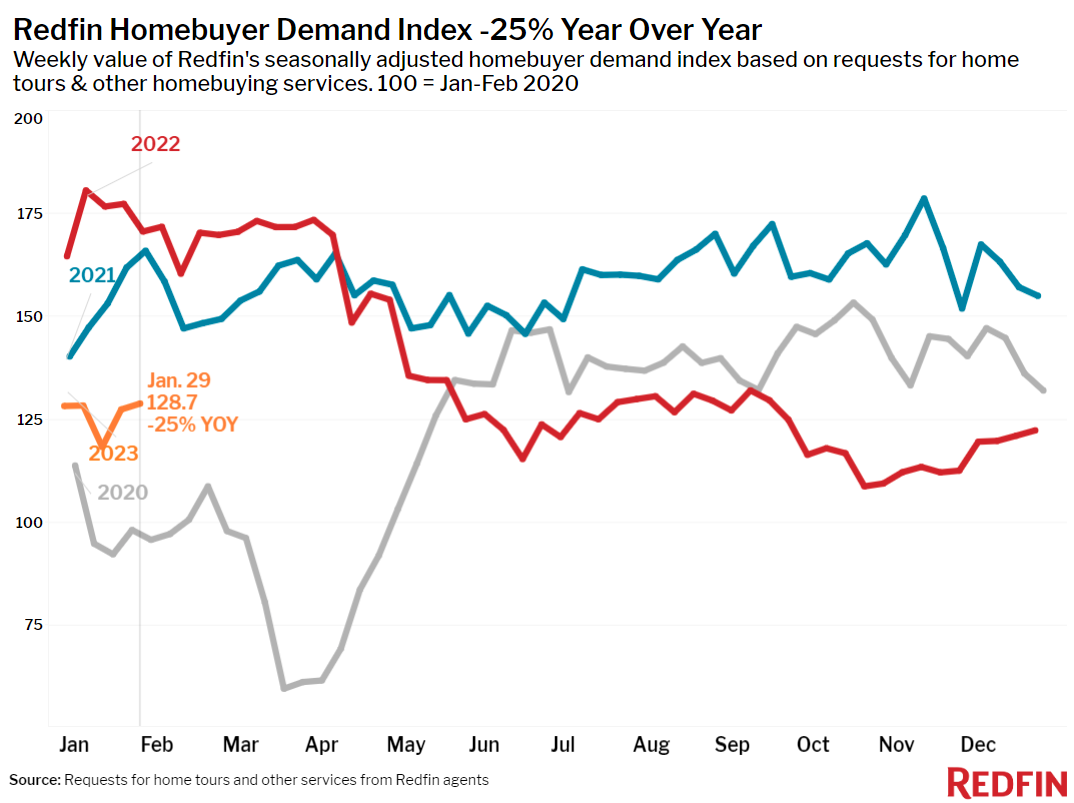
Some of those buyers are returning to the market. Pending home sales fell 23% from a year earlier during the four weeks ending January 29, the smallest decline since September and a notable improvement from the November trough, when pending sales declined 33% annually. Redfin’s Homebuyer Demand Index–a measure of requests for tours and other services from Redfin agents–is up 19% from the October low. The market feels hotter, too, with 37% of newly listed homes accepting an offer within two weeks of hitting the market, the highest level since July.
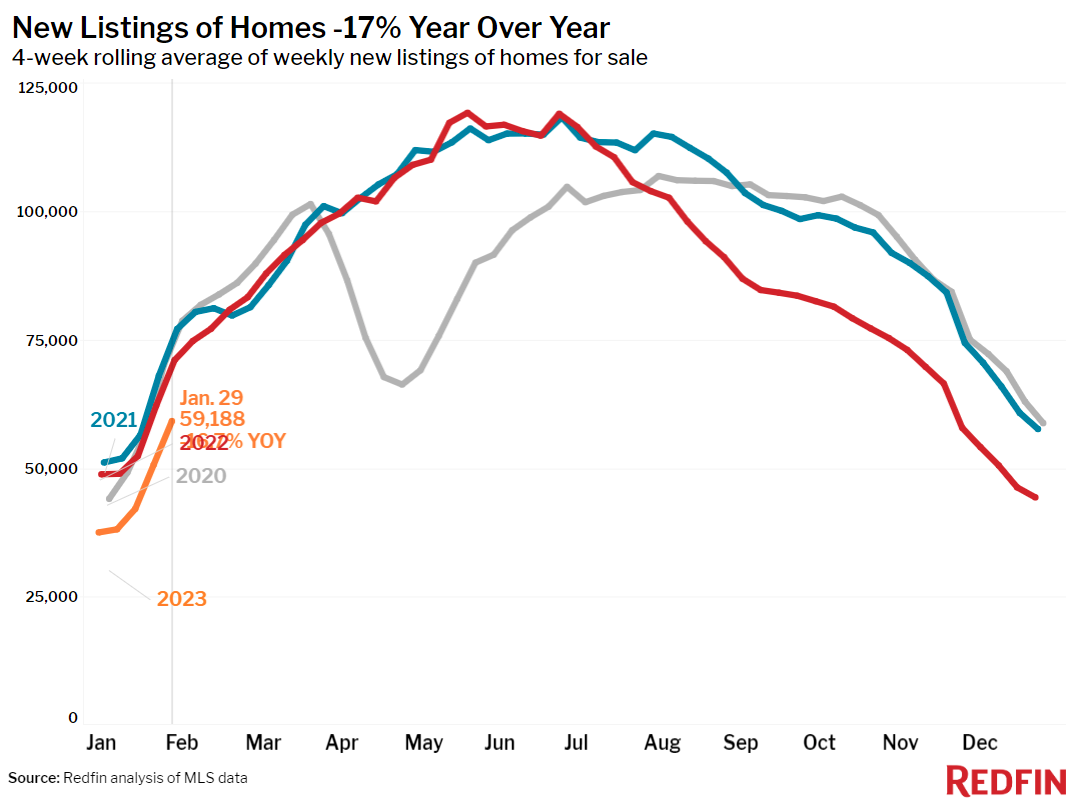
Home sellers are also starting to come off the sidelines. New listings of homes for sale declined 17% year over year–a significant decline, but the smallest one in over four months and an improvement from the December trough, when new listings dropped 24% annually.
“We expect more homebuyers and sellers to gradually return to the market by springtime, but mixed economic news and mixed reactions from the market mean the recovery will be uneven,” said Redfin Economics Research Lead Chen Zhao. “The Fed’s interest-rate hike this week, for example, is both promising and disappointing. The Fed hiked rates at a slower pace than last year, which means mortgage rates are unlikely to rise further. But it also signaled ongoing rate increases to fight inflation, which will likely prevent the steep mortgage-rate decline that some optimistic buyers have been waiting for.”
Mortgage-purchase applications rose 15% from their early-November trough but declined 10% from a week earlier, which could reflect the touch-and-go nature of the housing market recovery. It’s worth noting that it’s hard to draw a strong conclusion from this week’s decline because the mortgage purchase application index has been volatile the past few weeks.
Leading indicators of homebuying activity:
- For the week ending February 2, 30-year mortgage rates ticked down to 6.09%, hitting their lowest level since September. The daily average was 5.99% on February 2.
- Mortgage-purchase applications during the week ending January 27 declined 10% from a week earlier, but they were up 15% from their early-November trough, seasonally adjusted. Purchase applications were down 41% from a year earlier.
- The seasonally adjusted Redfin Homebuyer Demand Index–a measure of requests for home tours and other homebuying services from Redfin agents–hit its highest level since September during the week ending January 29. It was up 5% from a month earlier, but down 25% from a year earlier.
- Google searches for “homes for sale” were up about 44% from their November low during the week ending January 28, but down about 16% from a year earlier.
Key housing market takeaways for 400+ U.S. metro areas:
Unless otherwise noted, the data in this report covers the four-week period ending January 29. Redfin’s weekly housing market data goes back through 2015.
Data based on homes listed and/or sold during the period:
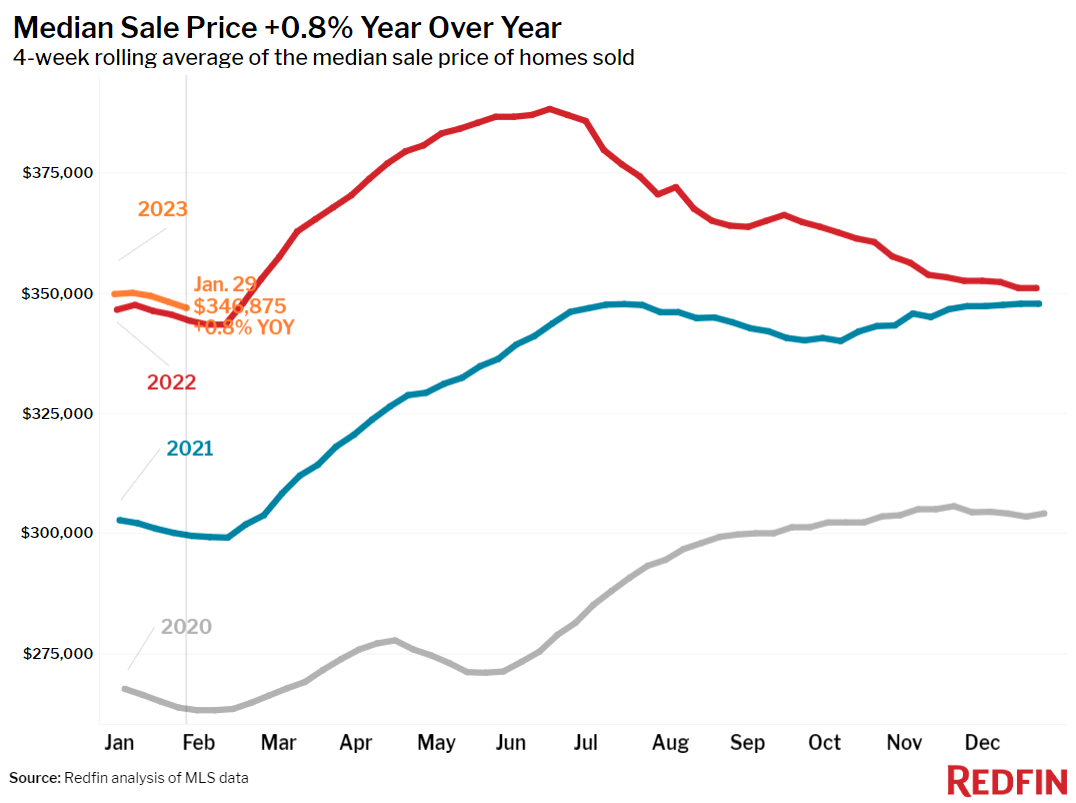
- The median home sale price was $346,875, up 0.8% year over year.
- Median sale prices fell in 19 of the 50 most populous U.S. metros, with the biggest drops in San Francisco (-7.8% YoY), Oakland, CA (-7.5%), Detroit (-5.7%), Austin (-4.6%) and Phoenix (-4.3%). Prices increased most in West Palm Beach, FL (12.6%), Milwaukee (9.4%), Indianapolis (8.4%), Fort Lauderdale, FL (8.3%) and Montgomery County, PA (7.8%).
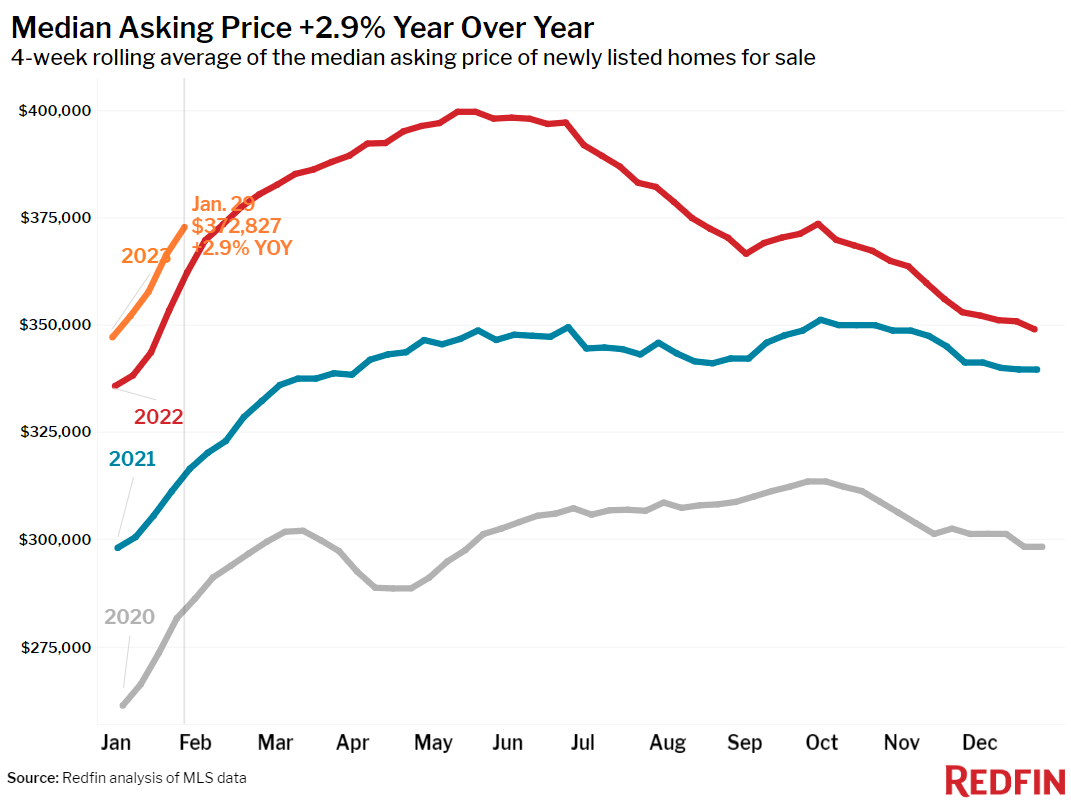
- The median asking price of newly listed homes was $372,827, up 2.9% year over year.
- The monthly mortgage payment on the median-asking-price home was $2,349 at a 6.09% mortgage rate, the current weekly average. That’s down $160 (-6%) from the October peak. Monthly mortgage payments are up 28% ($511) from a year ago.
- Pending home sales were down 22.6% year over year, the smallest decline in over four months.
- Among the 50 most populous U.S. metros, pending sales fell most in Las Vegas (-61.6% YoY), Phoenix (-54.1%), San Jose (-51.2%), Jacksonville, FL (-50.2%) and Nashville, TN (-50%). Pending sales rose in one metro: Cincinnati (20.3%).
- New listings of homes for sale fell 16.7% year over year, the smallest decline since the four weeks ending September 25, 2022.
- Among the 50 most populous U.S. metros, new listings rose in three: Nashville (3.8%), Dallas (1.9%) and Austin (0.3%). New listings declined most in Sacramento (-43.7% YoY), Oakland (-40%), San Diego -40%), San Jose (-38.2%) and Portland, OR (-37.1%).
- Active listings (the number of homes listed for sale at any point during the period) were up 23.3% from a year earlier.
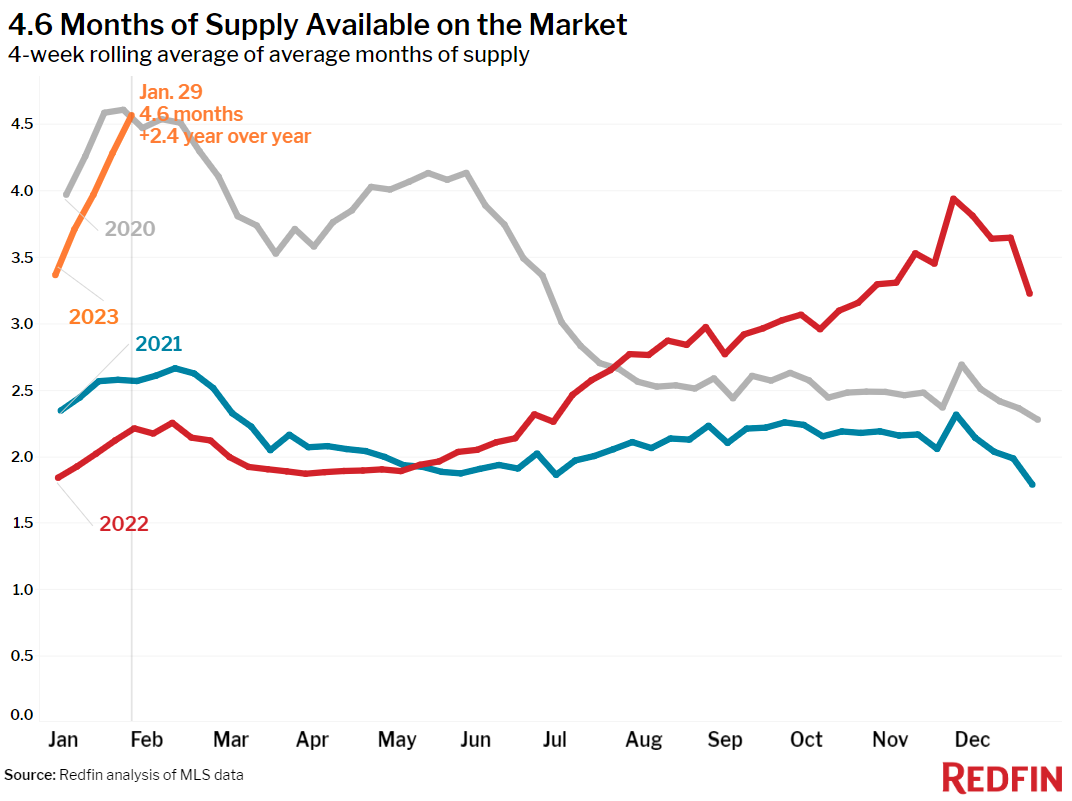
- Months of supply—a measure of the balance between supply and demand, calculated by the number of months it would take for the current inventory to sell at the current sales pace—was 4.6 months, up from 4.3 months during the prior four-week period and 2.2 months a year earlier.
- 37% of homes that went under contract had an accepted offer within the first two weeks on the market, the highest level since July, but down from 45% a year earlier.
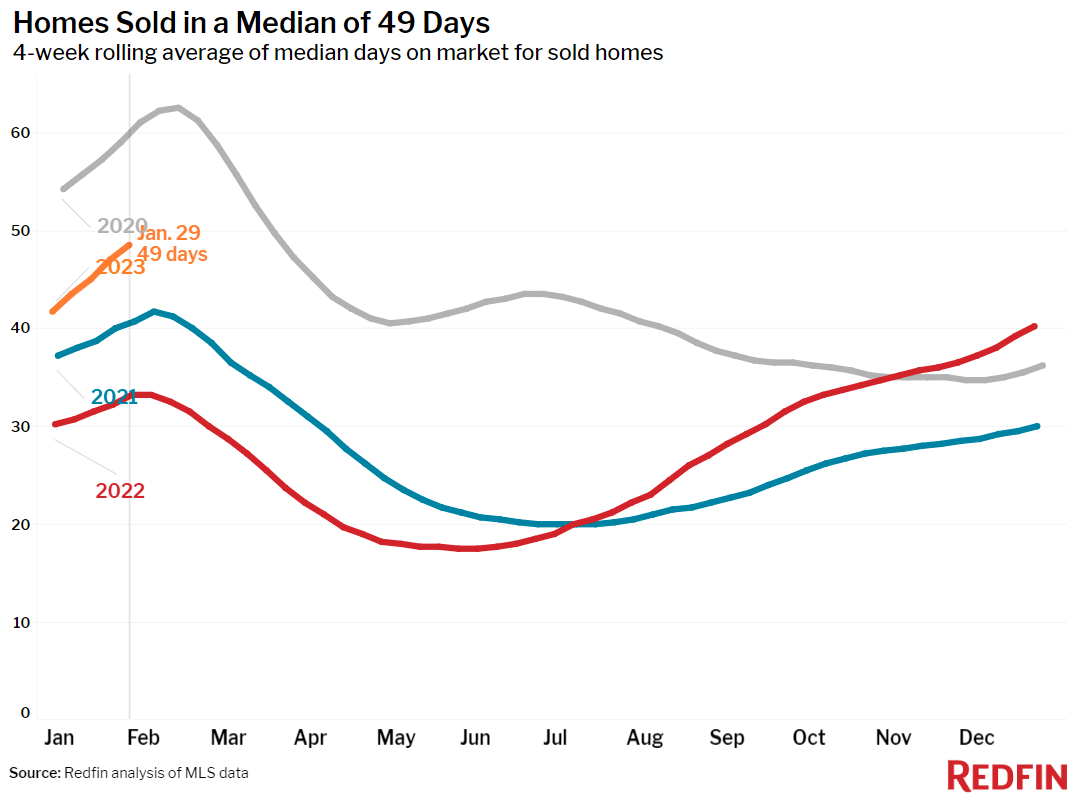
- Homes that sold were on the market for a median of 49 days. That’s up from 33 days a year earlier and the record low of 18 days set in May.
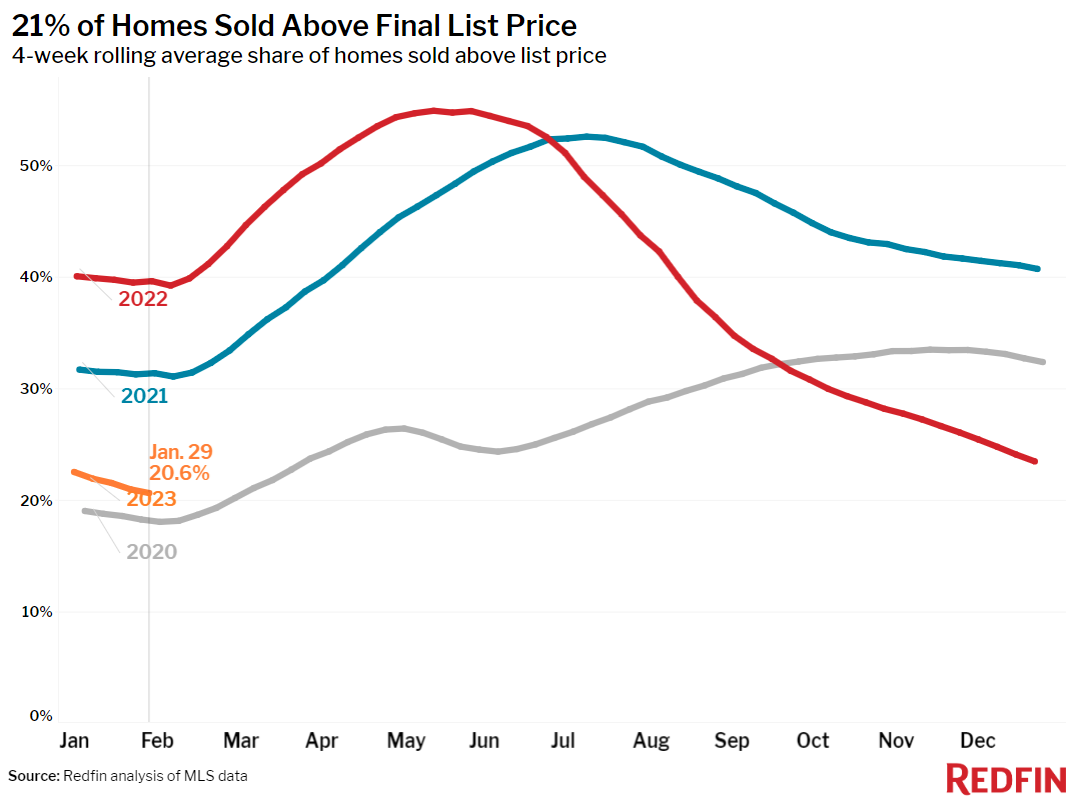
- 21% of homes sold above their final list price, down from 40% a year earlier and the lowest level since March 2020.
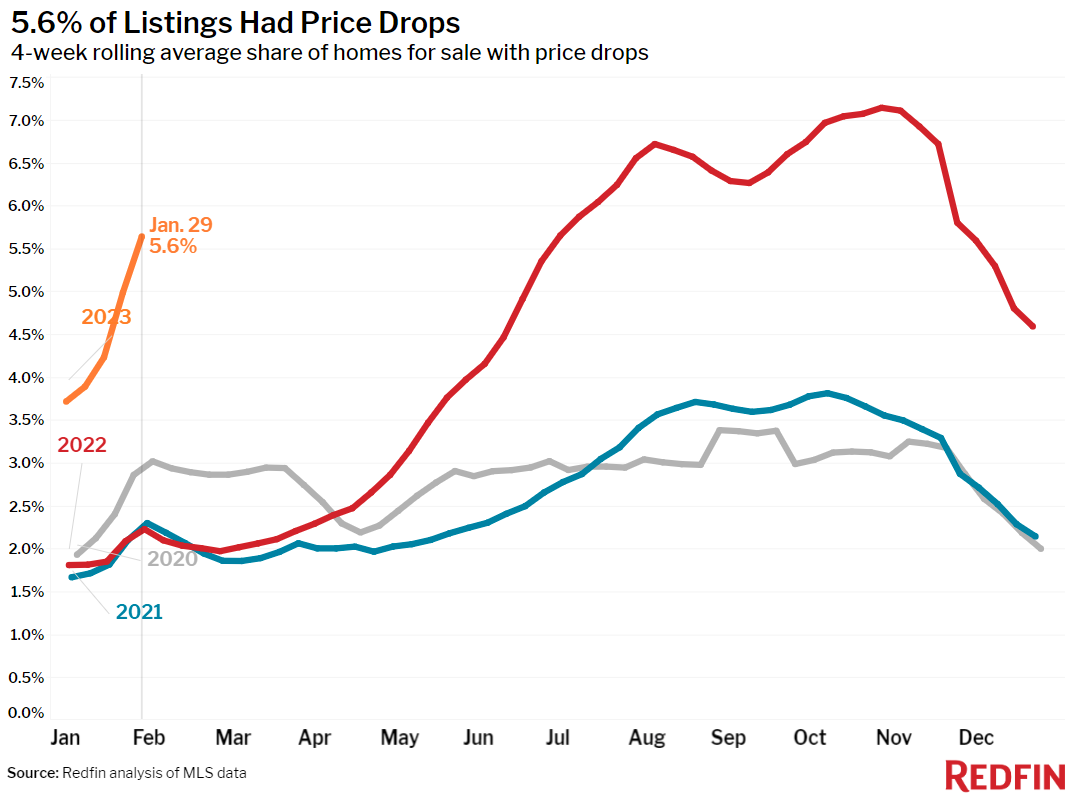
- On average, 5.6% of homes for sale each week had a price drop, up from 2.2% a year earlier.
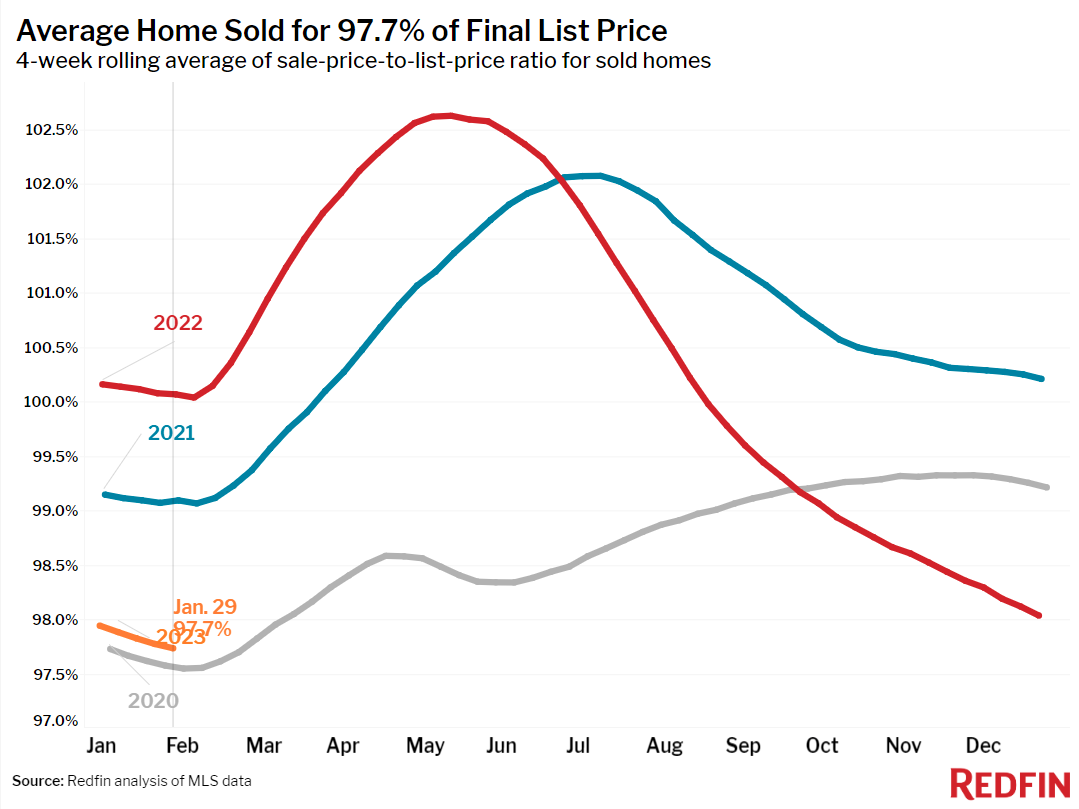
- The average sale-to-list price ratio, which measures how close homes are selling to their final asking prices, fell to 97.7% from 100.1% a year earlier. That’s the lowest level since March 2020.
Refer to our metrics definition page for explanations of all the metrics used in this report.