This week has brought a few pieces of good news to the housing market: Mortgage rates are dropping, new listings are rising and mortgage-purchase applications are up nearly 20% from their November low point.
Daily average mortgage rates have fallen to 6.82%, their lowest level since May. This marks the first time daily rates have dipped below 7% since July. Rates dropped after the Fed brought good news to homebuyers at its December 13 meeting, indicating they’re on a path toward lowering interest rates more and sooner than expected. That’s another piece of evidence that mortgage rates are likely to drop into the mid-6% range in 2024, consistent with Redfin’s housing-market predictions.
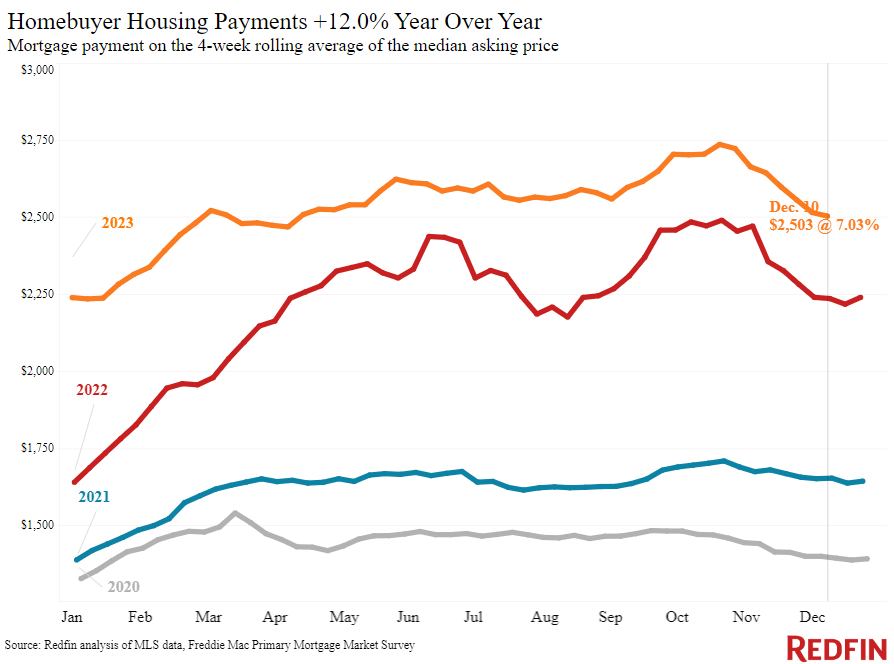
Mortgage payments are at their lowest level in eight months. Even before the Fed meeting, mortgage rates had declined substantially from their peak, bringing homebuyers some relief. The median U.S. housing payment is $2,503 as of the four weeks ending December 10, down $233 from October’s record high and its lowest level since April.
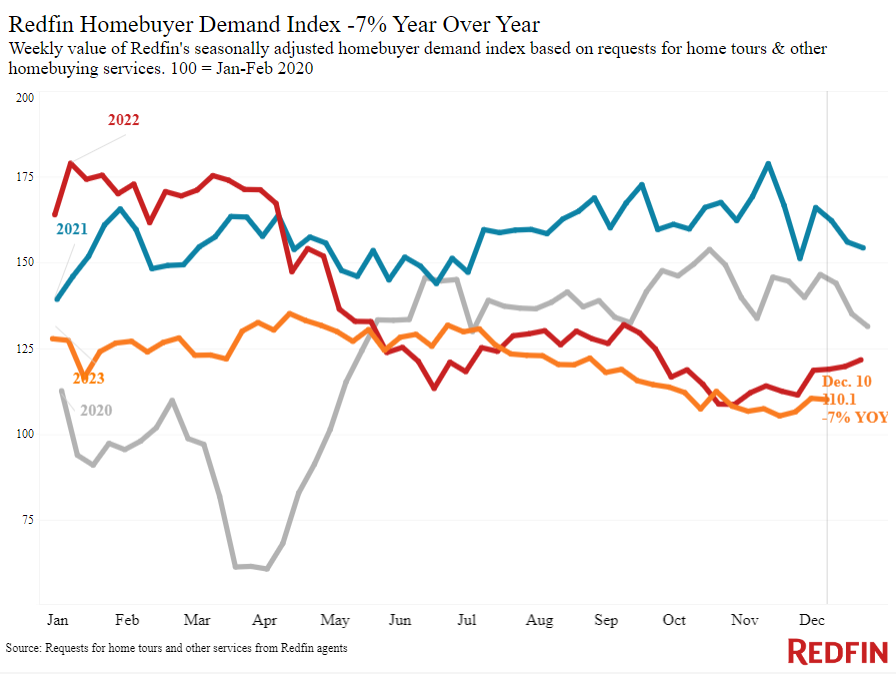
Declining costs are bringing homebuyers off the sidelines. Mortgage-purchase applications are up 19% from the three-decade low they dropped to at the start of November. And Redfin’s Homebuyer Demand Index–measure of requests for tours and other homebuying services from Redfin agents–is up 3% from a month ago.
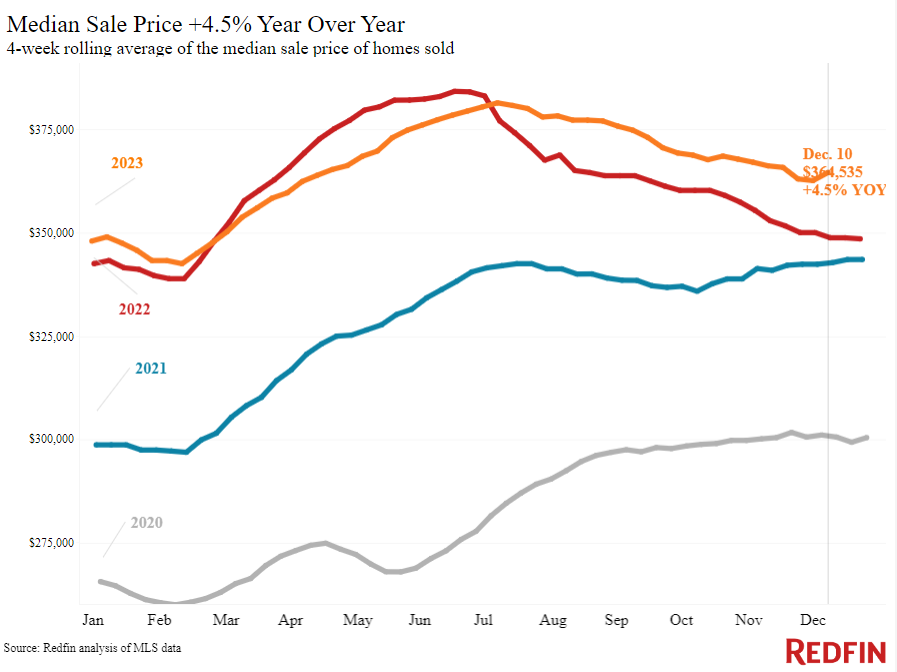
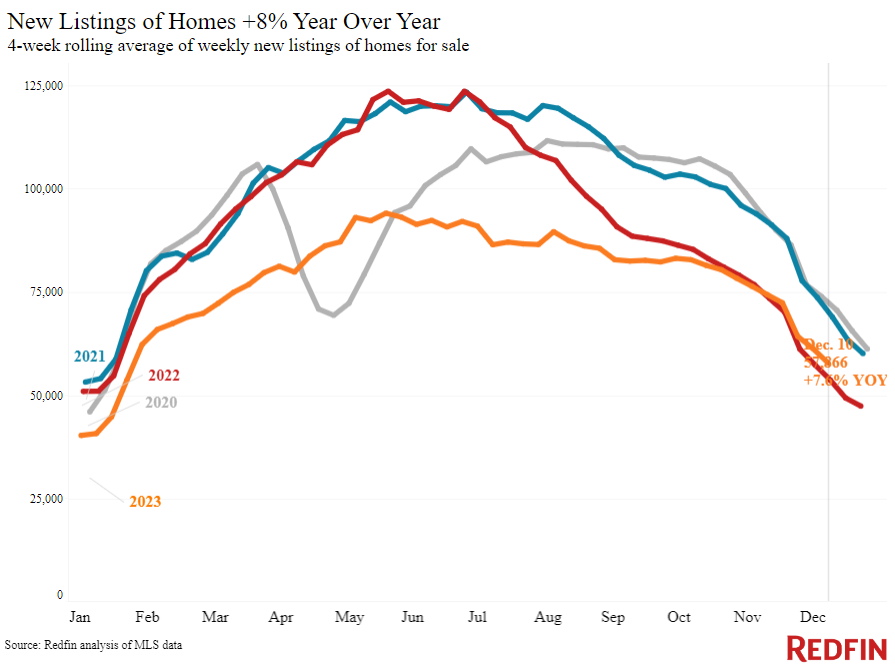
Prices and new listings rise. The median U.S. home-sale price is up 4.5% year over year, the biggest increase since October 2022. Prices are rising because demand is outpacing supply. Even though new listings are up 8% year over year–the biggest increase since July 2021–the total number of homes for sale is still down 5%.
Leading indicators
| Indicators of homebuying demand and activity | ||||
| Value (if applicable) | Recent change | Year-over-year change | Source | |
| Daily average 30-year fixed mortgage rate | 6.82% (Dec. 13) | Lowest level since May | Up from 6.39% | Mortgage News Daily |
| Weekly average 30-year fixed mortgage rate | 7.03% (week ending Dec. 7) | Sixth straight weekly decline. Down from two-decade high of 7.79% seven weeks earlier | Up from 6.33% | Freddie Mac |
| Mortgage-purchase applications (seasonally adjusted) | Up 4% from a week earlier (as of week ending Dec. 8) | Down 18% | Mortgage Bankers Association | |
| Redfin Homebuyer Demand Index (seasonally adjusted) | Up 3% from a month earlier (as of the week ending Dec. 10) | Down 7% | Redfin Homebuyer Demand Index, a measure of requests for tours and other homebuying services from Redfin agents | |
| Google searches for “home for sale” | Down 9% from a month earlier (as of Dec. 9) | Essentially unchanged | Google Trends | |
| Touring activity | Down 36% from the start of the year (as of Dec. 12) | At this time last year, it was down 43% from the start of 2022 | ShowingTime, a home touring technology company | |
Key housing-market data
| U.S. highlights: Four weeks ending December 10, 2023
Redfin’s national metrics include data from 400+ U.S. metro areas, and is based on homes listed and/or sold during the period. Weekly housing-market data goes back through 2015. Subject to revision. |
|||
| Four weeks ending December 10, 2023 | Year-over-year change | Notes | |
| Median sale price | $364,535 | 4.5% | Biggest increase since Oct. 2022. Prices are up partly because rapidly rising mortgage rates were hampering prices during this time last year |
| Median asking price | $368,247 | 5.7% | |
| Median monthly mortgage payment | $2,503 at a 7.03% mortgage rate | 12% | Down $233 (-9%) from all-time high set during the four weeks ending Oct. 22. Lowest level since April. . |
| Pending sales | 58,532 | -7.8% | |
| New listings | 57,866 | 7.6% | Biggest uptick since July 2021. The increase is partly because new listings were falling at this time last year. |
| Active listings | 844,170 | -5.4% | Smallest decline since June. |
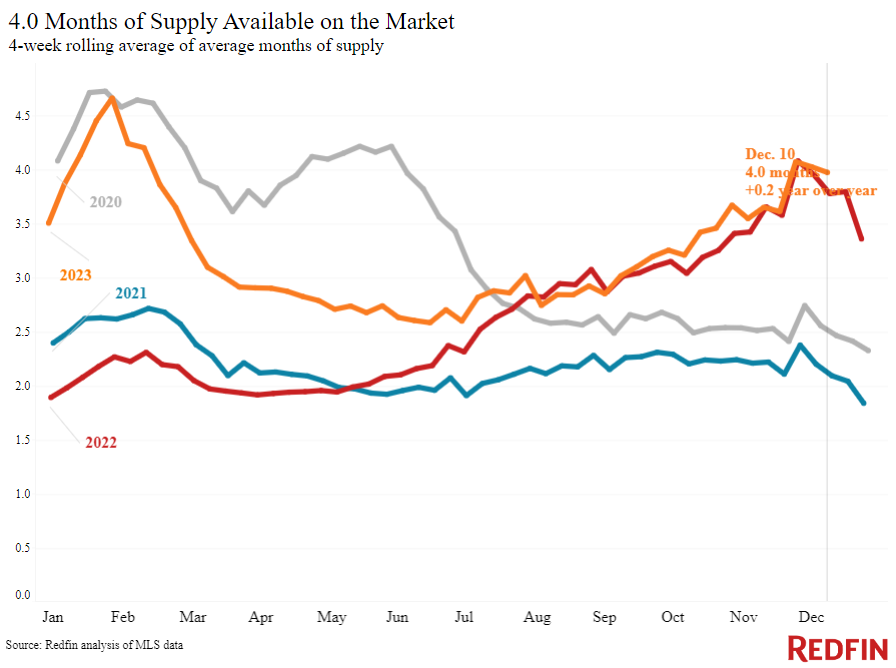
| Months of supply | 4 months | +0.2 pts. | 4 to 5 months of supply is considered balanced, with a lower number indicating seller’s market conditions. |
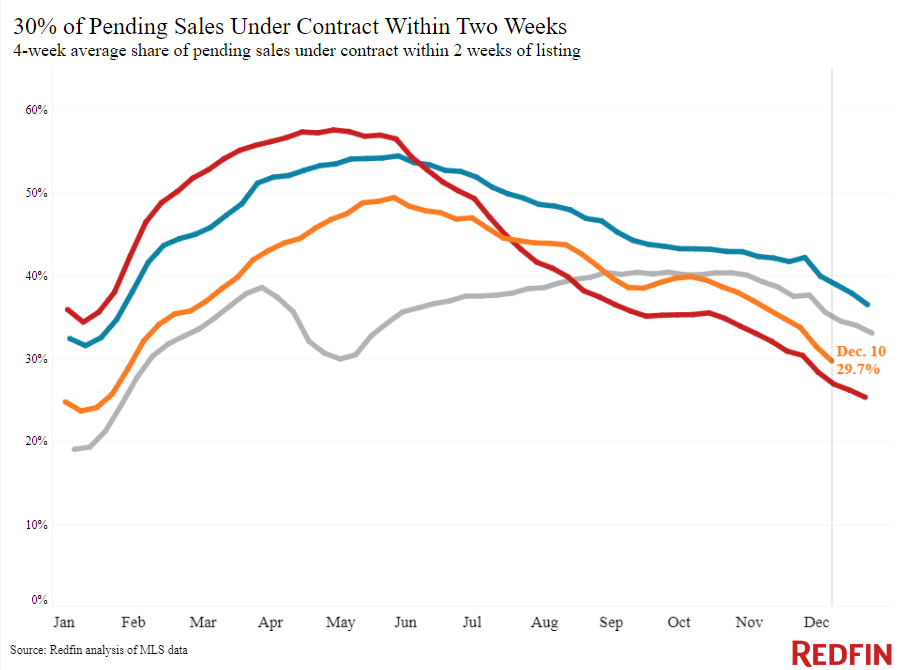
| Share of homes off market in two weeks | 29.7% | Up from 28% | |
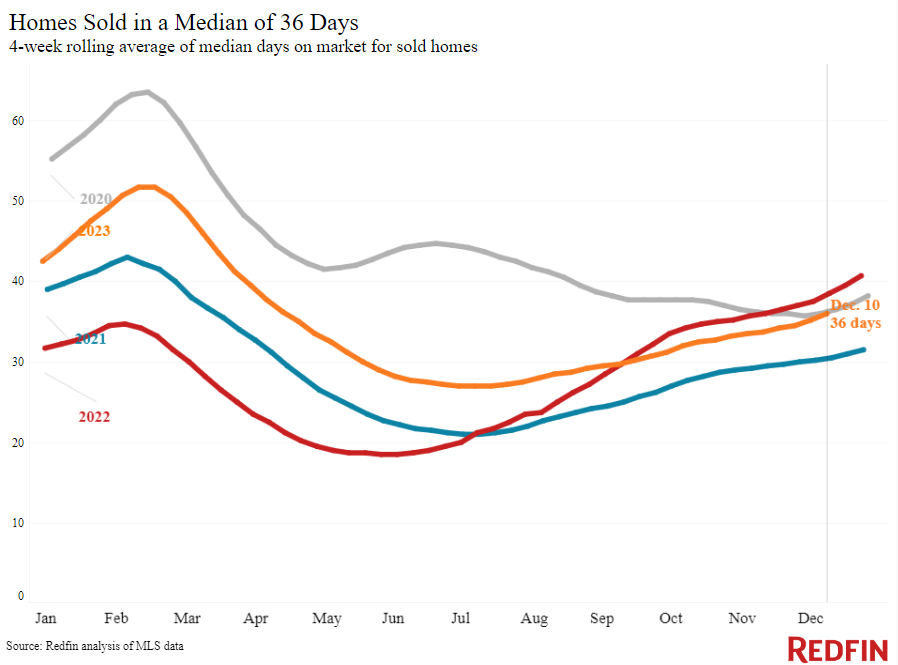
| Median days on market | 36 | -3 days | |
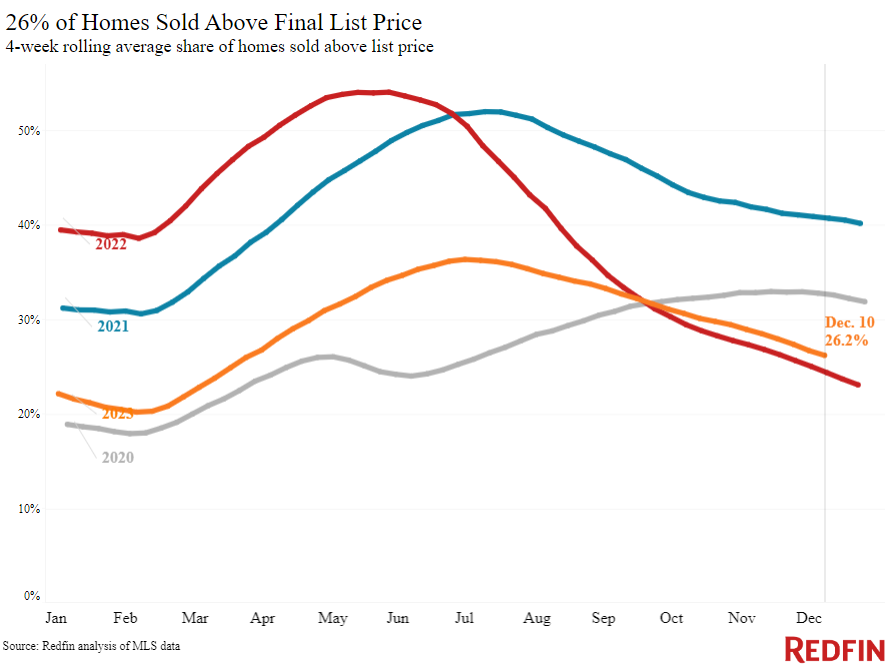
| Share of homes sold above list price | 26.2% | Up from 24% | |
| Share of homes with a price drop | 5.3% | +0.4 pts. | |
| Average sale-to-list price ratio | 98.7% | +0.5 pts. | |
| Metro-level highlights: Four weeks ending December 10, 2023
Redfin’s metro-level data includes the 50 most populous U.S. metros. Select metros may be excluded from time to time to ensure data accuracy. |
|||
| Metros with biggest year-over-year increases | Metros with biggest year-over-year decreases | Notes | |
| Median sale price | Anaheim, CA (19.2%)
Fort Lauderdale, FL (14.9%) Newark, NJ (14.6%) New Brunswick, NJ (11.5%) Miami (11.2%) |
Austin, TX (-5.3%)
San Antonio, TX (-3.3%) Houston (-1.7%) |
Declined in 3 metros |
| Pending sales | Milwaukee (3.3%)
Fort Worth, TX (1%) Chicago (0.3%) |
Cincinnati, OH (-22.2%)
Providence, RI (-15%) New York (-13.8%) Sacramento, CA (-13.6%) New Brunswick, NJ (-13.5%) |
Increased in 3 metros |
| New listings | Phoenix (24.4%)
Orlando, FL (21.1%) Miami (18.6%) Fort Worth, TX (13.6%) Las Vegas (13.1%) |
San Francisco (-23.7%)
Atlanta (-14.5%) Oakland, CA (-7.4%) Seattle (-5.7%) Indianapolis, IN (-4%) |
Declined in 15 metros |
Refer to our metrics definition page for explanations of all the metrics used in this report.