Homebuyer demand outstrips supply as mortgage rates creep up: demand has grown 15X faster than supply since 2019.
Forty-four percent more homes are pending sale than at this time in 2019, but only 3% more homes recently hit the market—down from 12% growth over 2019 just 7 weeks prior. As a result of the severe imbalance between the number of homes for sale and the number of buyers, the pace of the market is picking up at a time when it typically slows. A third of homes are finding buyers within a week of hitting the market, up from 30.8% at the end of the summer. This week, we’re comparing today’s market with the pre-pandemic fall market of 2019 to highlight how hot the market remains, even as most measures are settling into typical seasonal patterns.
“Comparing today’s sales and new listings numbers to the 2019 levels helps to reveal the stark shortage of supply we are facing,” said Redfin Deputy Chief Economist Taylor Marr. “The boost of housing supply that came on the market during the summer has already faded away, even as demand tapers off as we expected it to in the fall. Relative to the last ‘typical’ fall of 2019, demand remains steady and strong thanks to the increased urgency many buyers have as mortgage rates inch up. Rising rates also make buyers more price sensitive, so homes that are priced right are increasingly likely to receive offers right away.”
Key housing market takeaways for 400+ U.S. metro areas:
Unless otherwise noted, the data in this report covers the four-week period ending October 17. Redfin’s housing market data goes back through 2012. Except where indicated otherwise, the housing market is generally experiencing seasonal cooling trends, similar to what was seen during this same period in 2019.
Data based on homes listed and/or sold during the period:
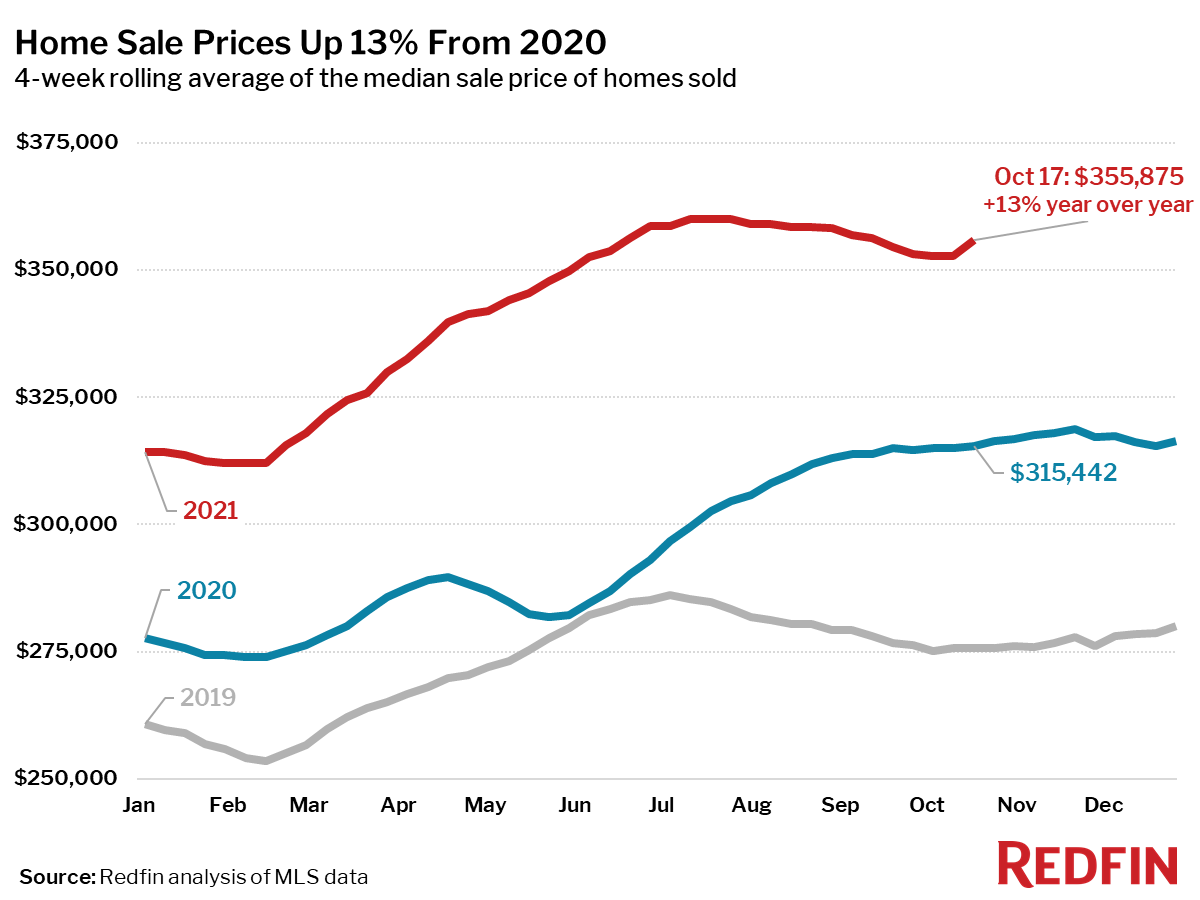
- The median home-sale price increased 13% year over year to $355,875. This was up 29% from the same period in 2019.
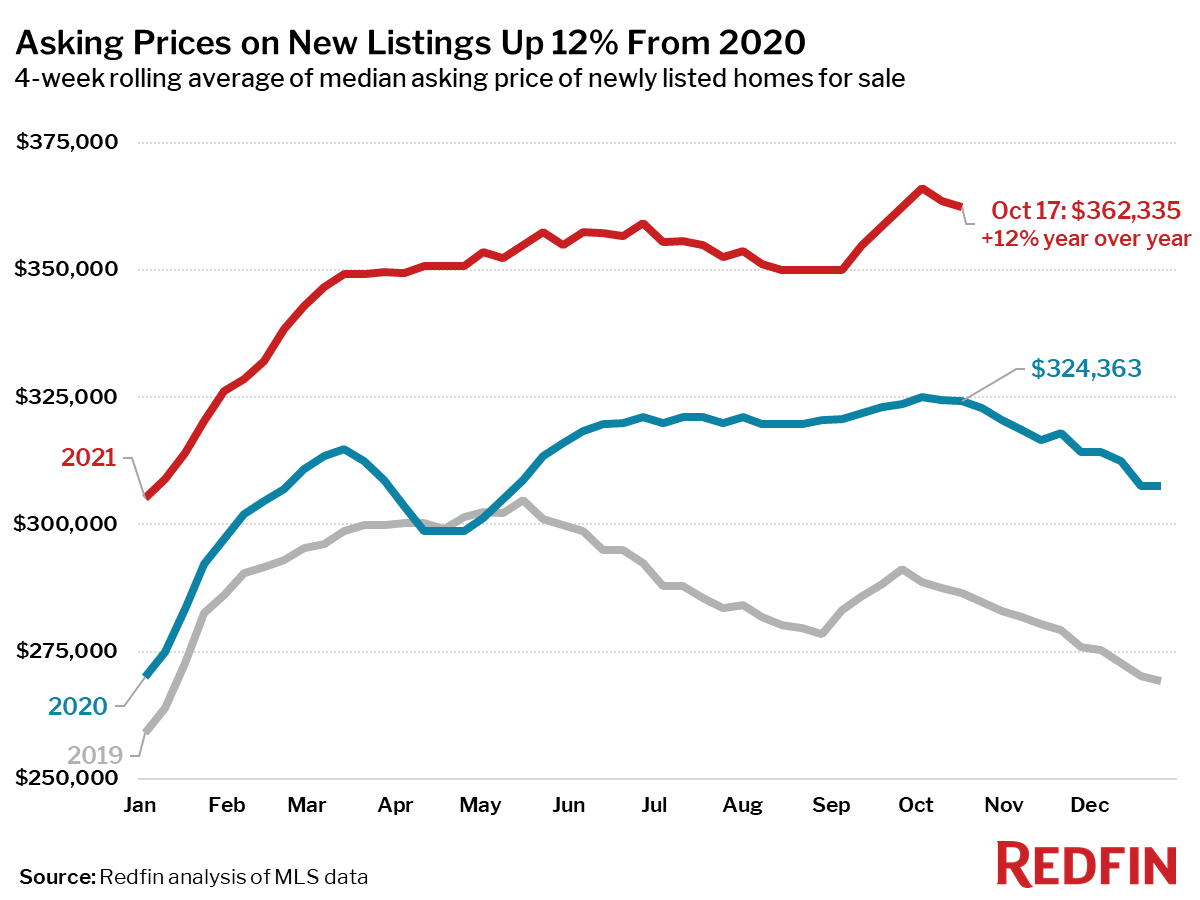
- Asking prices of newly listed homes were up 12% from the same time a year ago and up 26% from 2019 to a median of $362,335, down 1% from the all-time high set during the four-week period ending October 3. Asking prices typically increase in September and then begin to decline in October through the end of the year.
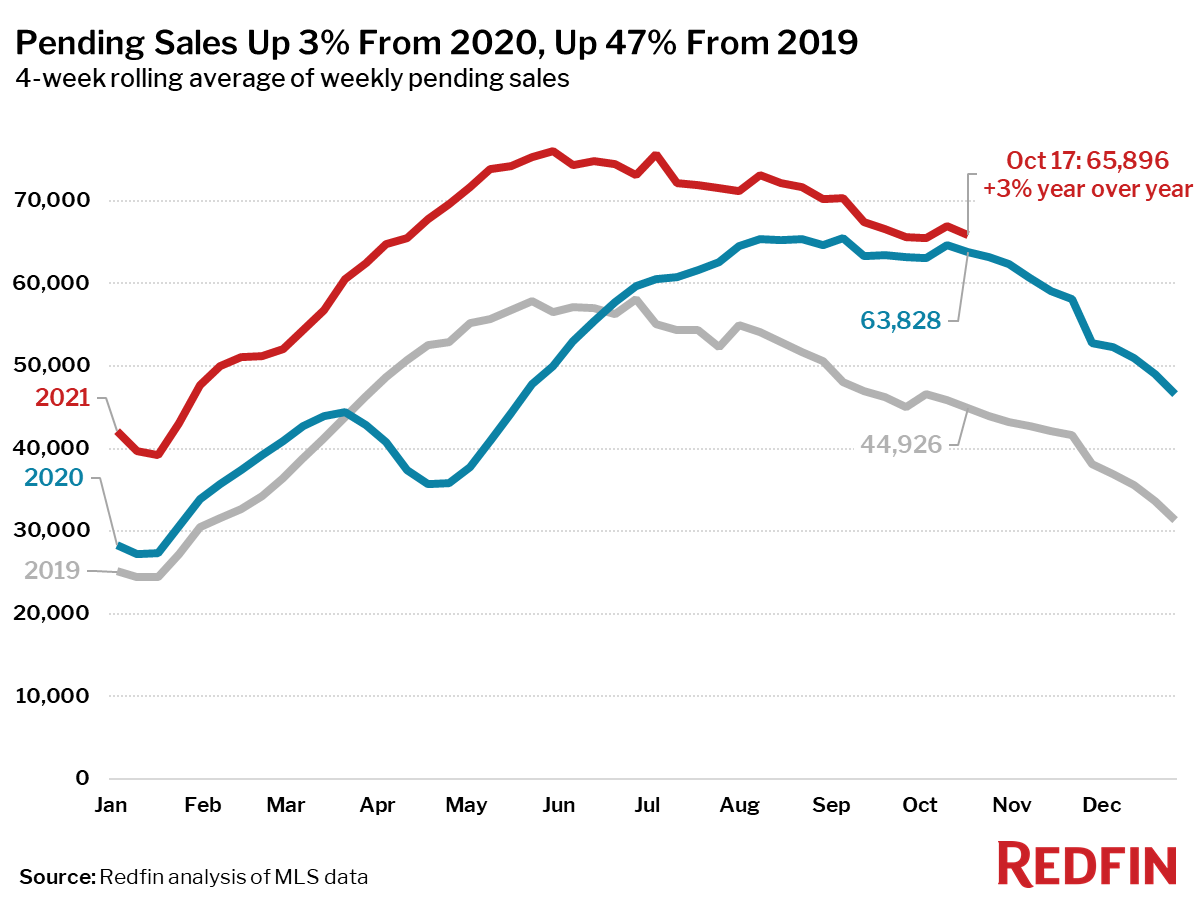
- Pending home sales were up 3% year over year, and up 47% compared to the same period in 2019, which was a more typical year in terms of seasonality for sales and listings.
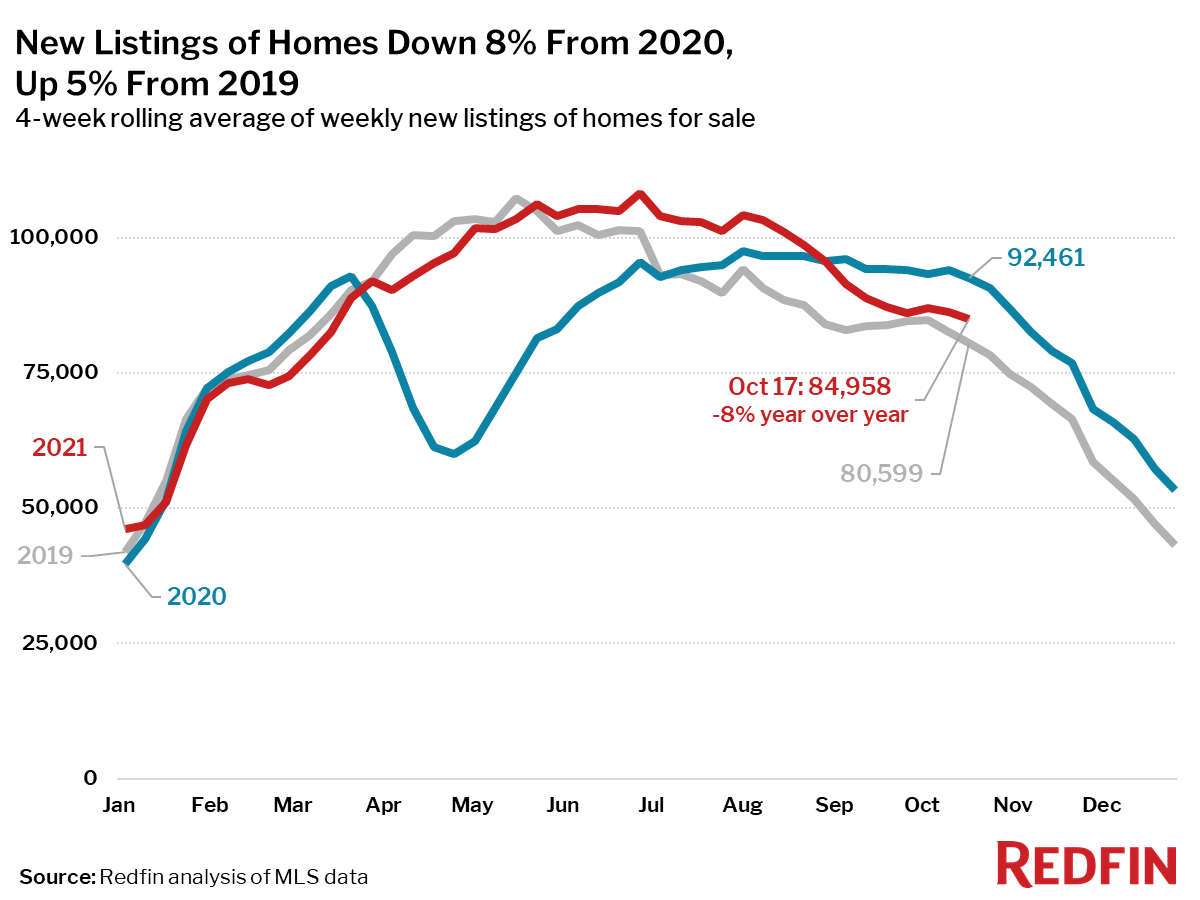
- New listings of homes for sale were down 8% from a year earlier. New listings remained positive compared to 2019, up 5%.
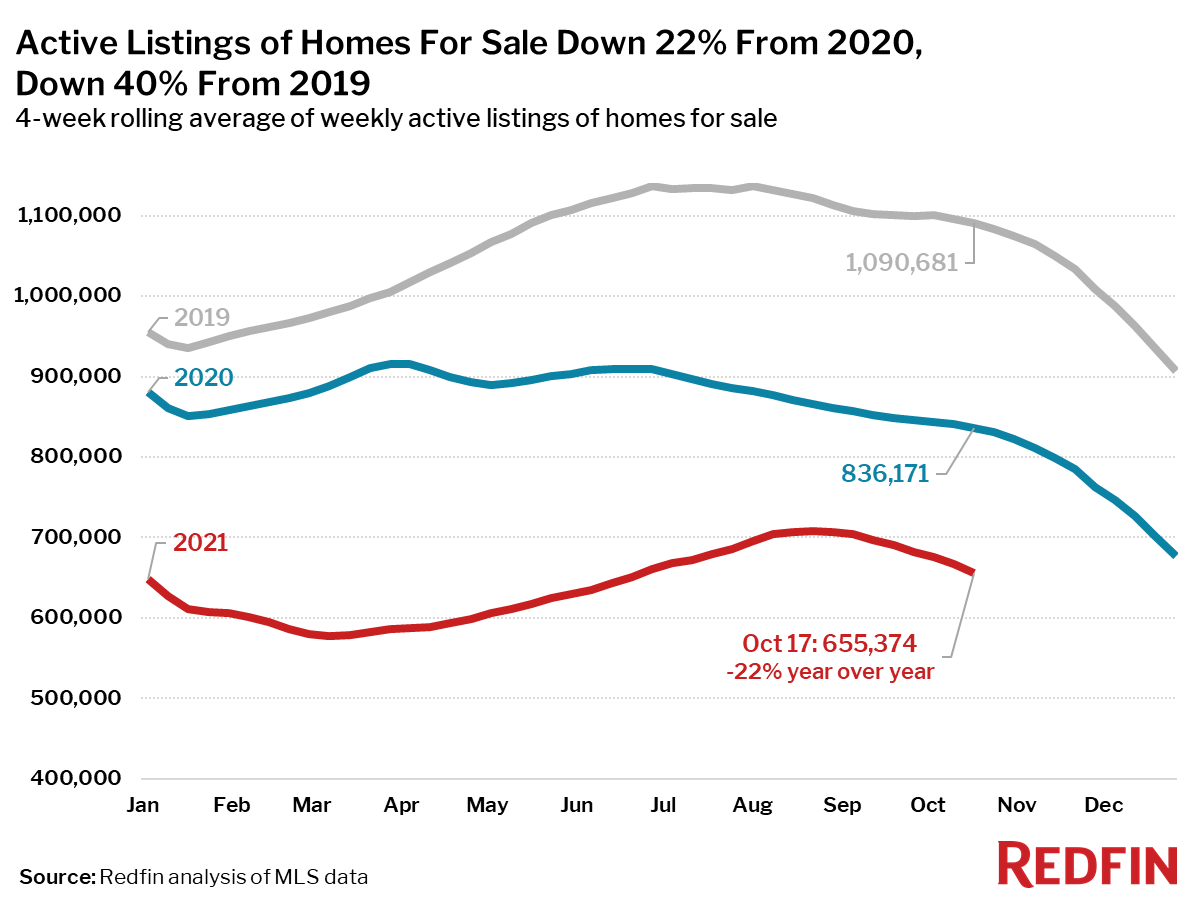
- Active listings (the number of homes listed for sale at any point during the period) fell 22% from 2020, and were down 40% from 2019.
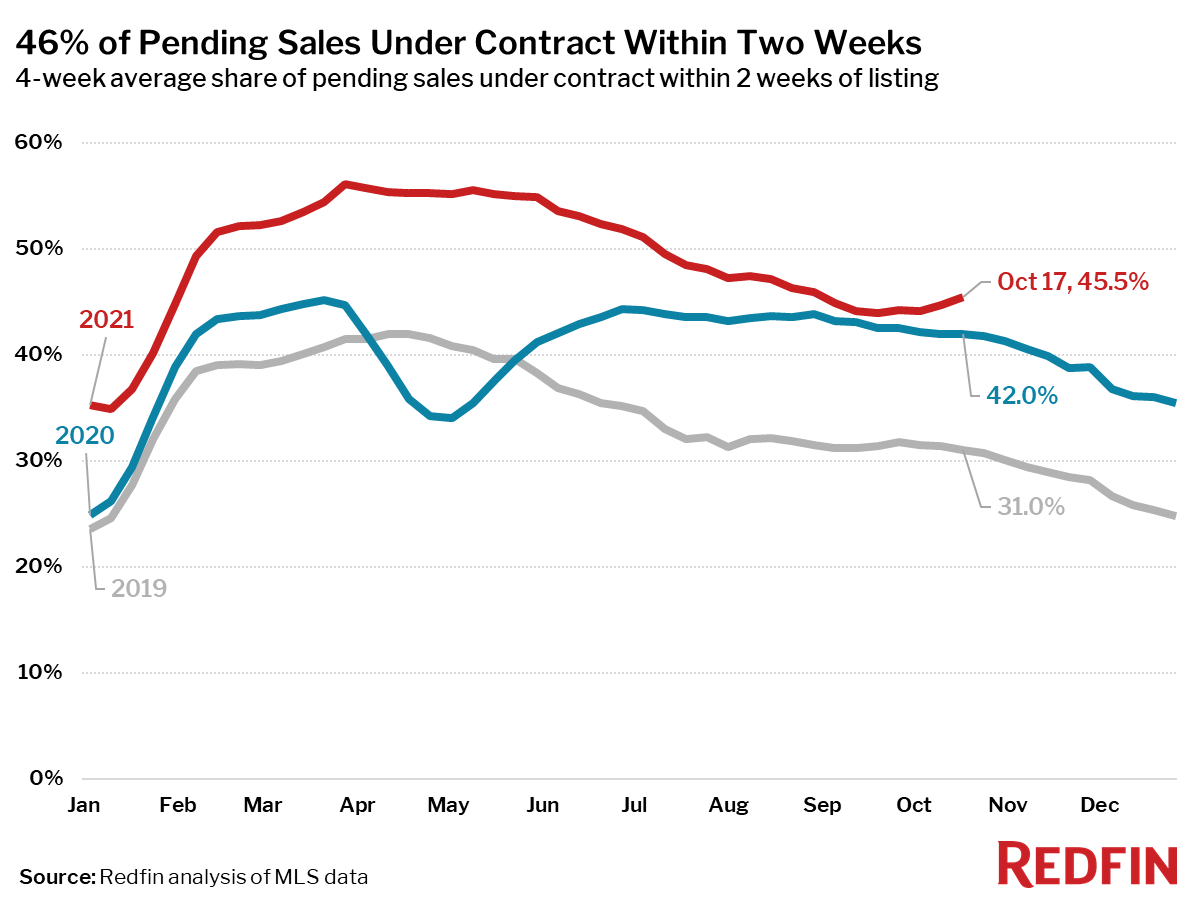
- 46% of homes that went under contract had an accepted offer within the first two weeks on the market, above the 42% rate of a year earlier and the 31% rate in 2019.
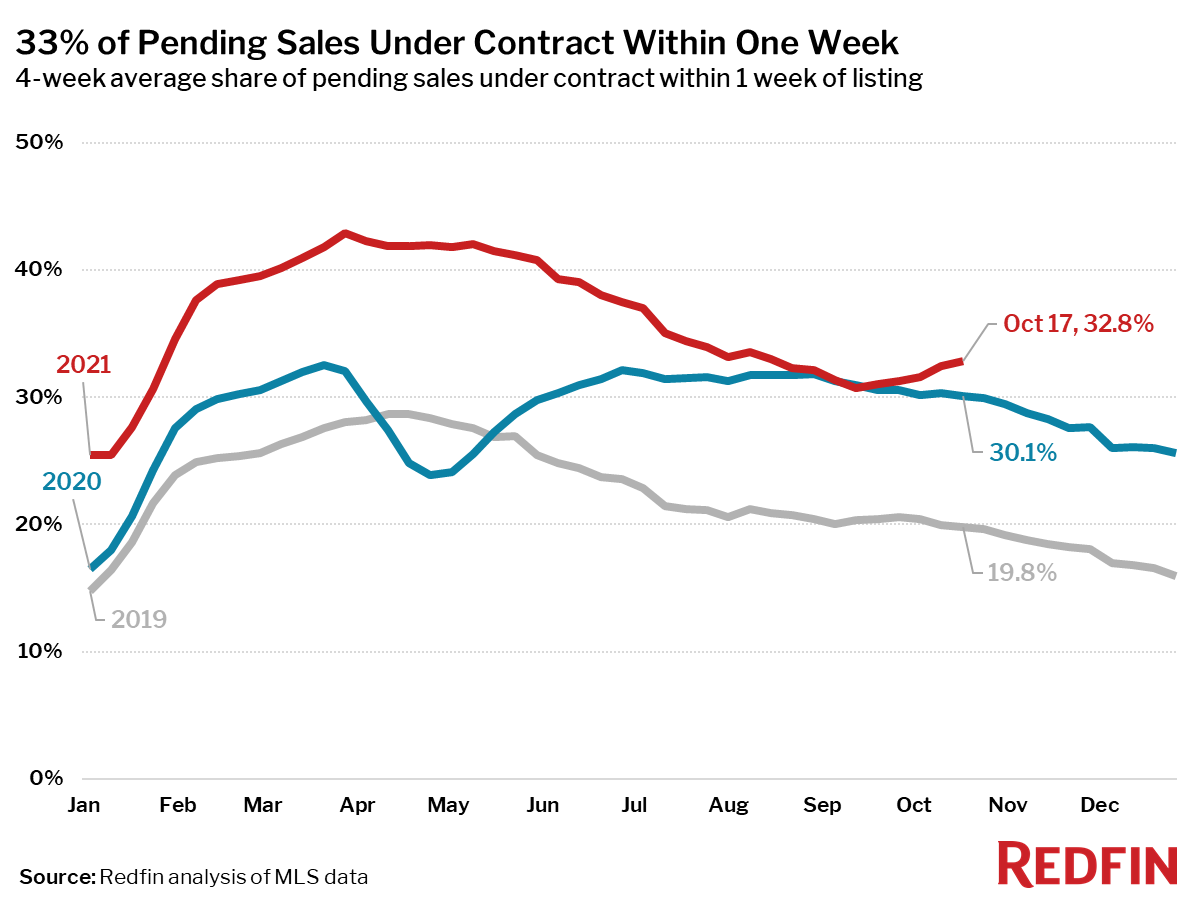
- 33% of homes that went under contract had an accepted offer within one week of hitting the market, up from 30% during the same period a year earlier and 20% in 2019.
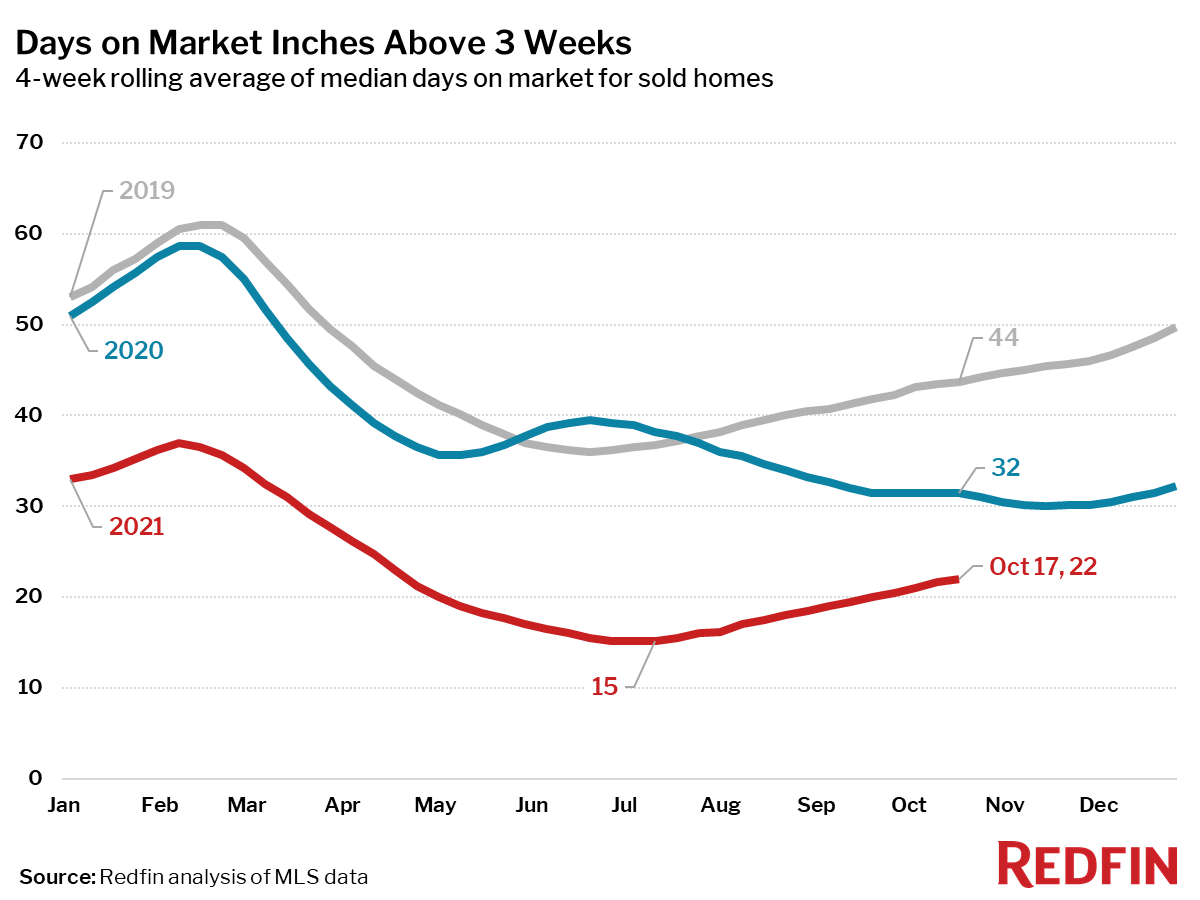
- Homes that sold were on the market for a median of 22 days, a full week longer than the all-time low of 15 days seen in late June and July, down from 32 days a year earlier and 44 days in 2019.
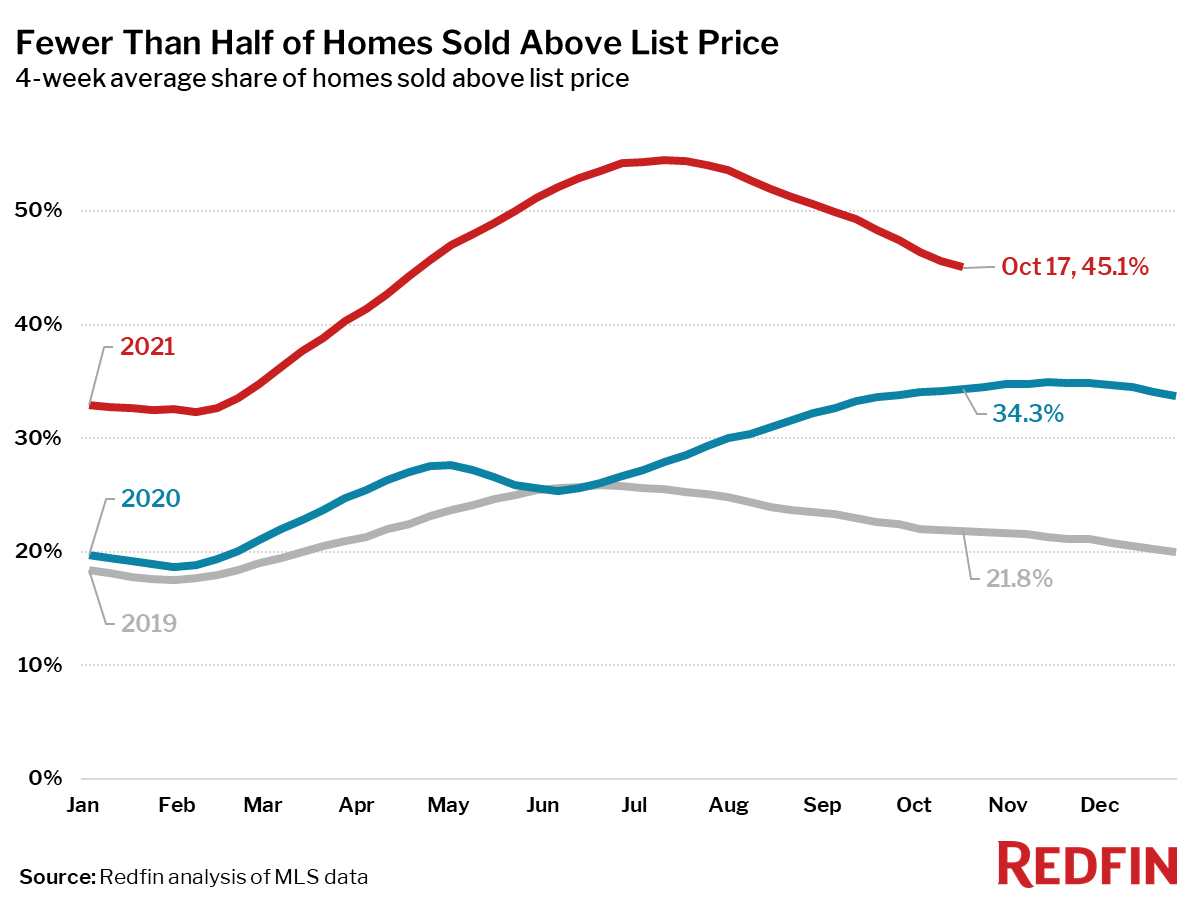
- 45% of homes sold above list price, up from 34% a year earlier and 22% in 2019, but the smallest share since April.
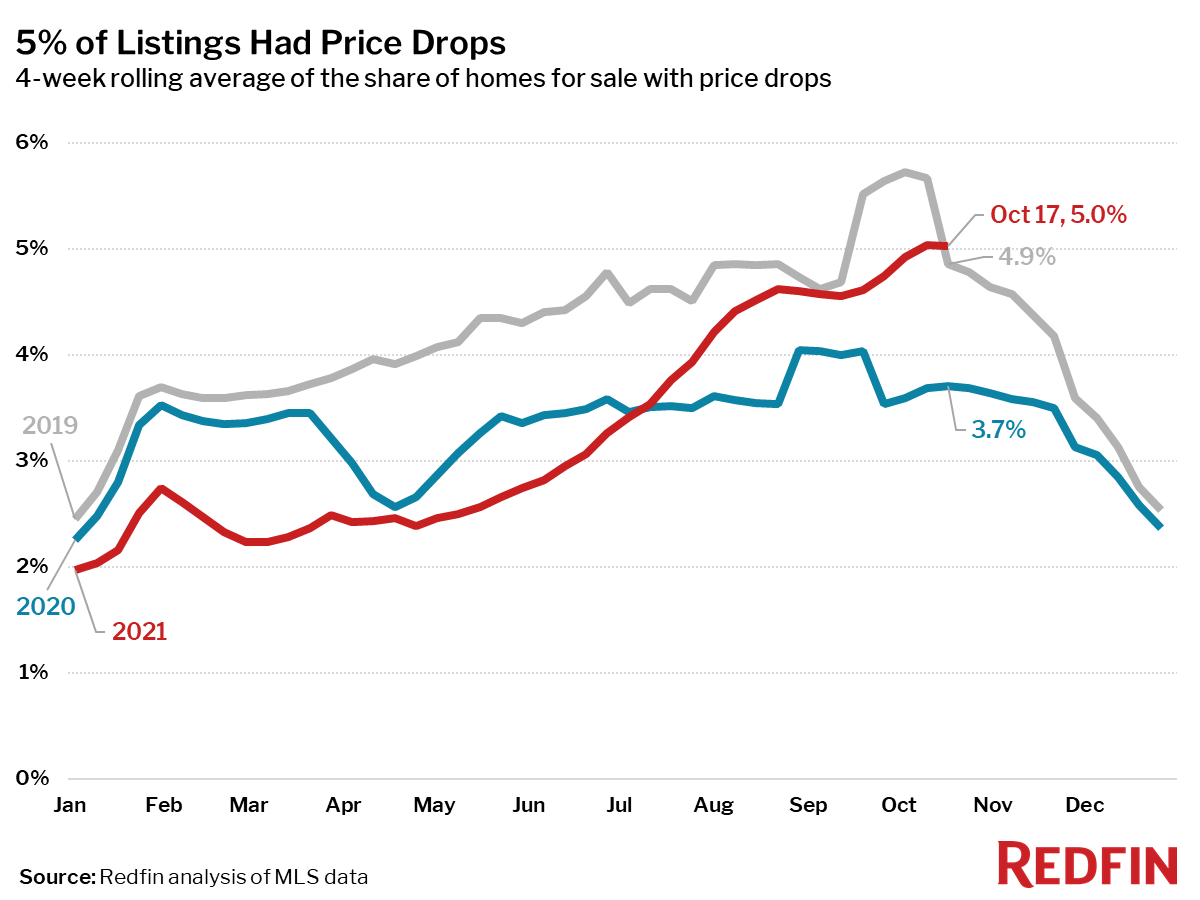
- On average, 5% of homes for sale each week had a price drop, up 1.3 percentage points from the same time in 2020, up 0.1 points from 2019, and the highest level since the four-week period ending October 13, 2019.
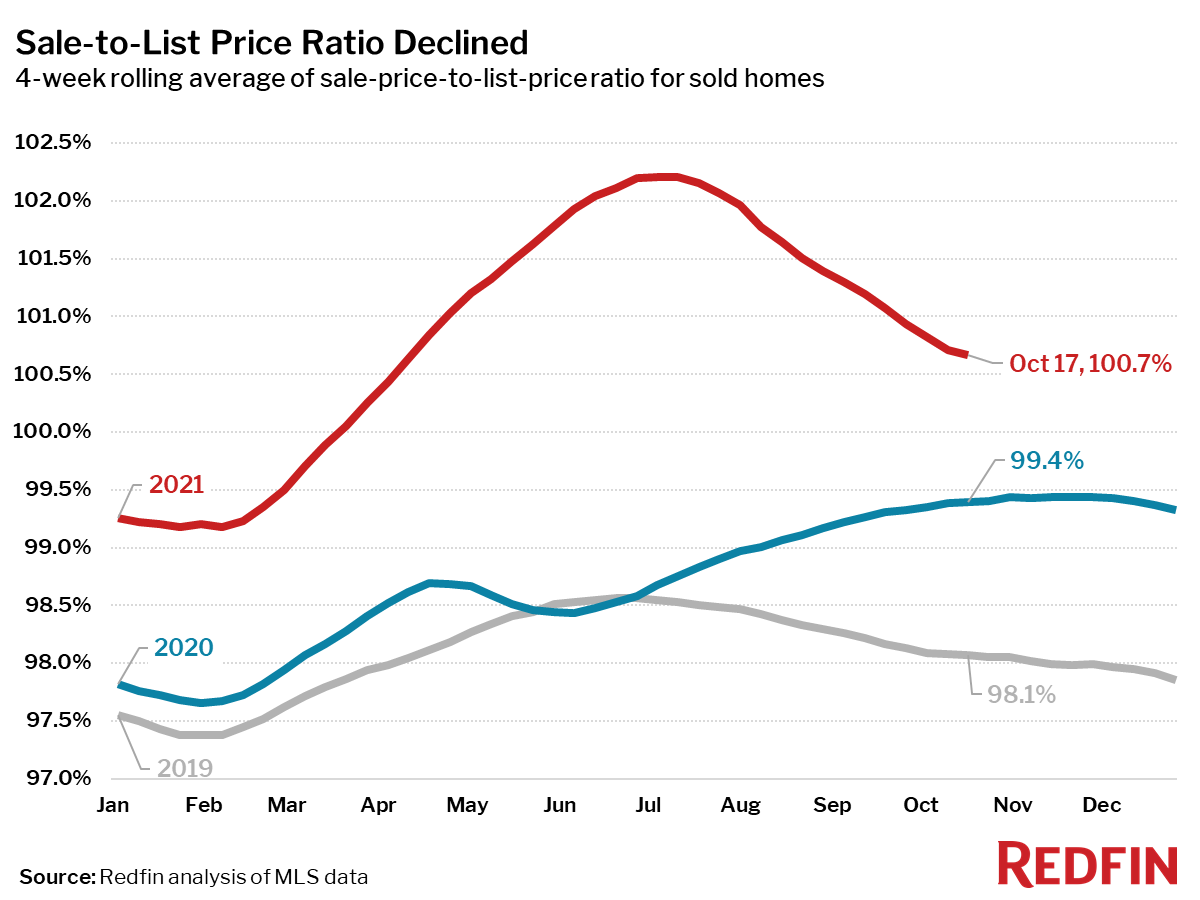
- The average sale-to-list price ratio, which measures how close homes are selling to their asking prices, decreased to 100.7%, the lowest level since April. In other words, the average home sold for 0.7% above its asking price.
Other leading indicators of homebuying activity:
- Mortgage purchase applications decreased 5% week over week (seasonally adjusted) during the week ending October 15. For the week ending October 14, 30-year mortgage rates rose to 3.05%, the highest level since early April.
- From January 1 to October 17, home tours were up 7%, compared to a 25% increase over the same period last year, but higher than the 6% rate in 2019, according to home tour technology company ShowingTime.
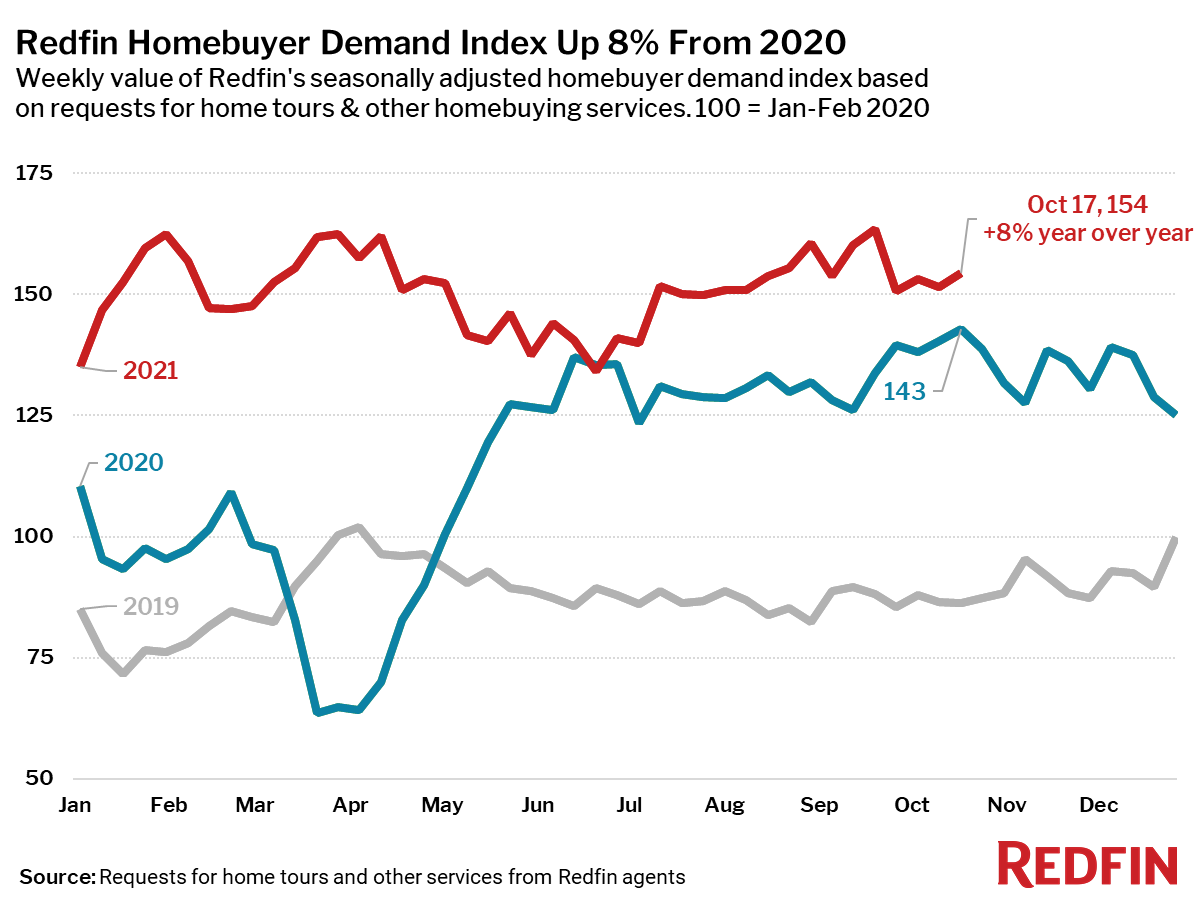
- The Redfin Homebuyer Demand Index rose 3 points during the week ending October 17, and was up 8% from a year earlier. The seasonally adjusted Redfin Homebuyer Demand Index is a measure of requests for home tours and other home-buying services from Redfin agents.
Refer to our metrics definition page for explanations of all the metrics used in this report.