Home prices posted their biggest annual increase in 15 months and mortgage rates rose this week. High housing costs, along with seasonal factors like the Super Bowl, pushed down pending sales.
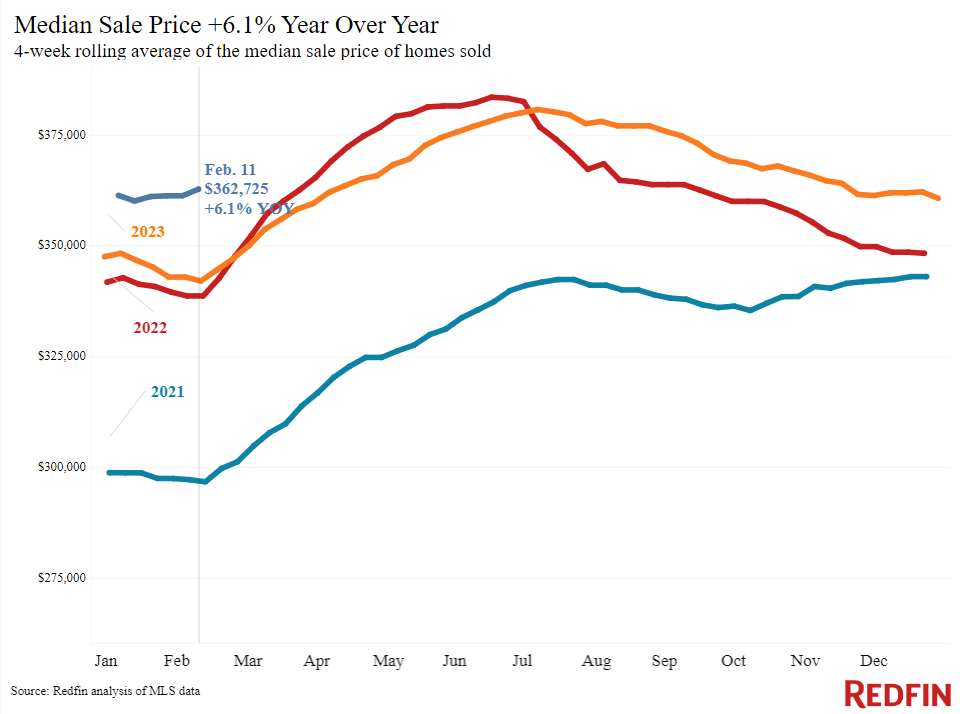
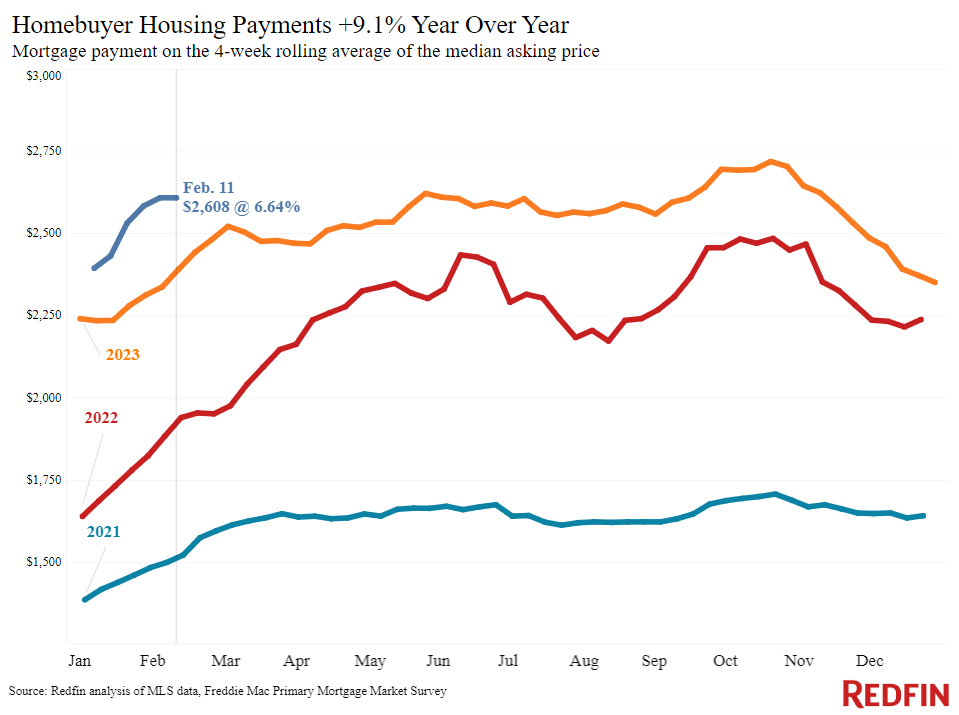
The median U.S. home-sale price rose 6.1% year over year during the four weeks ending February 11, the biggest increase since October 2022. Mortgage rates are rising, too, exacerbating high prices to drive costs up: Daily average rates are sitting above 7%, up from 6.6% at the beginning of the month.
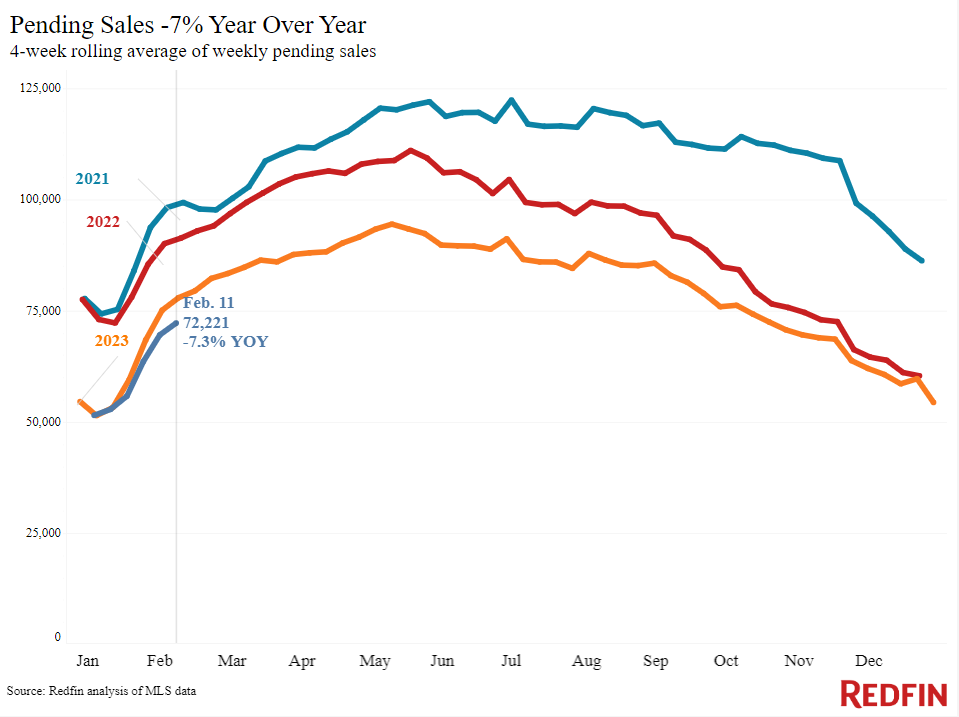
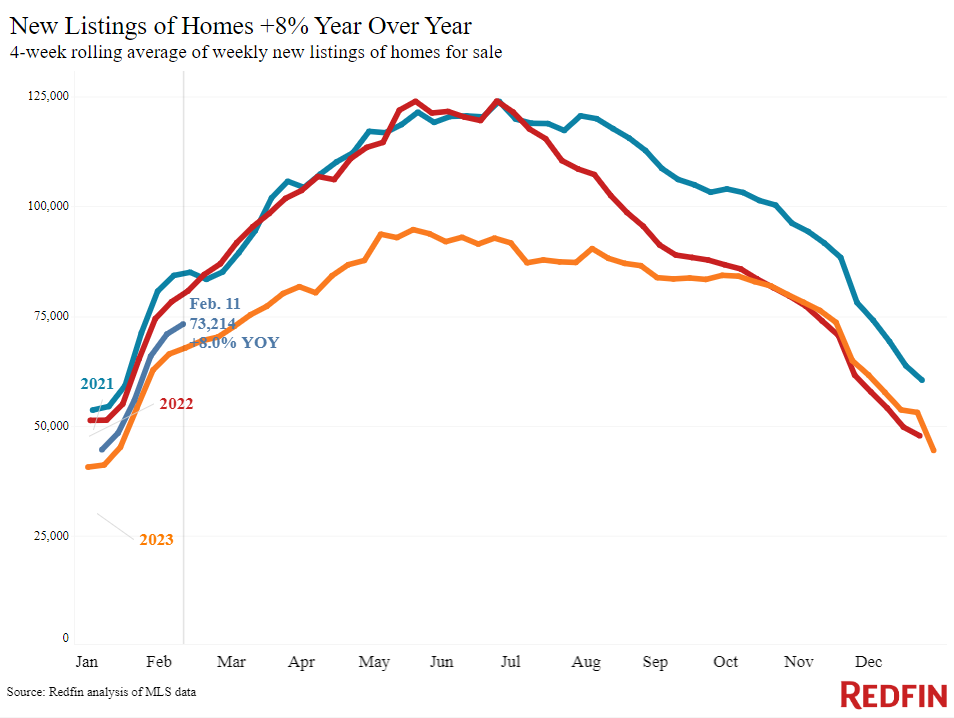
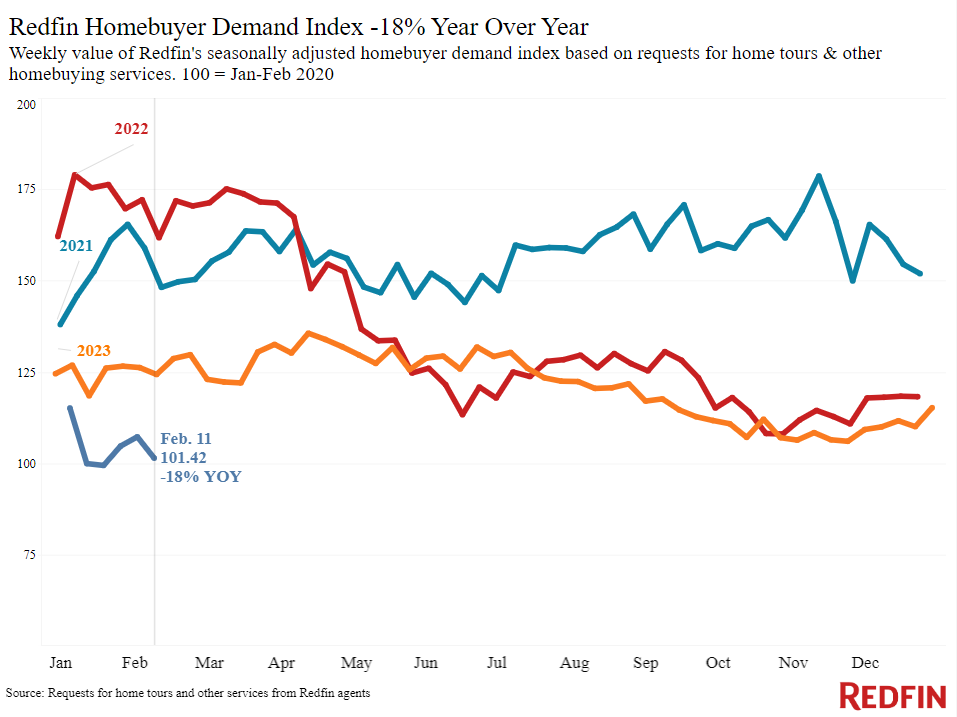
High costs are one factor keeping would-be homebuyers on the sidelines. Pending home sales are down 7.3% year over year, one of the biggest declines in over four months, and Redfin’s Homebuyer Demand Index–a seasonally adjusted measure of requests for tours and other homebuying services from Redfin agents–is down 18%. In addition to high housing costs, several seasonal factors kept some house hunters at home this past week: extreme storms in Southern California, the Lunar New Year and the Super Bowl (none of which are accounted for in the demand index’s seasonal adjustment). Sellers are a bit more active than buyers, with new listings up 8% year over year as some homeowners hope to take advantage of rising prices.
“The Super Bowl is like Groundhog Day for real estate economists; we usually have a read on how the market is shaping up by the beginning of February, and the read this year is that it’s looking sluggish so far, mostly because of stubbornly high mortgage rates,” said Redfin Economic Research Lead Chen Zhao. “This week’s hotter-than-expected inflation report confirms that the Fed is unlikely to cut interest rates next month, which means mortgage rates will stay near 7% for now. Activity should pick up a bit in the spring, partly because it’ll be selling season and partly because people are getting more and more accustomed to elevated rates. We expect mortgage rates to start declining later in the spring as inflation eases and the Fed finally starts cutting interest rates.”
Christine Kooiker, a Redfin Premier agent in Grand Rapids, MI, said she’s encouraging homeowners who are thinking about selling to list soon.
“A lot of sellers want to wait until spring, but I’m telling people to consider listing in the next few weeks because even though demand is fairly slow, there’s hardly anything else on the market,” Kooiker said. “Buyers may want to act sooner rather than later, too, because prices will continue to go up. I have a few clients who waited to make an offer, or made an offer that was too low, and now they regret it because a house they love got snatched up.”
Leading indicators
| Indicators of homebuying demand and activity | ||||
| Value (if applicable) | Recent change | Year-over-year change | Source | |
| Daily average 30-year fixed mortgage rate | 7.09% (Feb. 14) | Up from 6.75% a week earlier | Up from 6.54% | Mortgage News Daily |
| Weekly average 30-year fixed mortgage rate | 6.64% (week ending Feb. 8) | Near lowest level since May | Up from 6.12% | Freddie Mac |
| Mortgage-purchase applications (seasonally adjusted) | Down 3% from a week earlier; up 1% from a month earlier (as of week ending Feb. 9) | Down 12% | Mortgage Bankers Association | |
| Redfin Homebuyer Demand Index (seasonally adjusted) | Down about 6% from a week earlier (as of week ending Feb. 11) | Down 18% | Redfin Homebuyer Demand Index, a measure of requests for tours and other homebuying services from Redfin agents | |
| Google searches for “home for sale” | Essentially unchanged from a month earlier (as of Feb. 10) | Down 11% | Google Trends | |
| Touring activity | Up 14% from the start of the year (as of Feb. 12) | At this time last year, it was up 10% from the start of 2023 | ShowingTime, a home touring technology company | |
Key housing-market data
| U.S. highlights: Four weeks ending February 11, 2024
Redfin’s national metrics include data from 400+ U.S. metro areas, and is based on homes listed and/or sold during the period. Weekly housing-market data goes back through 2015. Subject to revision. |
|||
| Four weeks ending February 11, 2024 | Year-over-year change | Notes | |
| Median sale price | $362,725 | 6.1% | Biggest increase since Oct. 2022 |
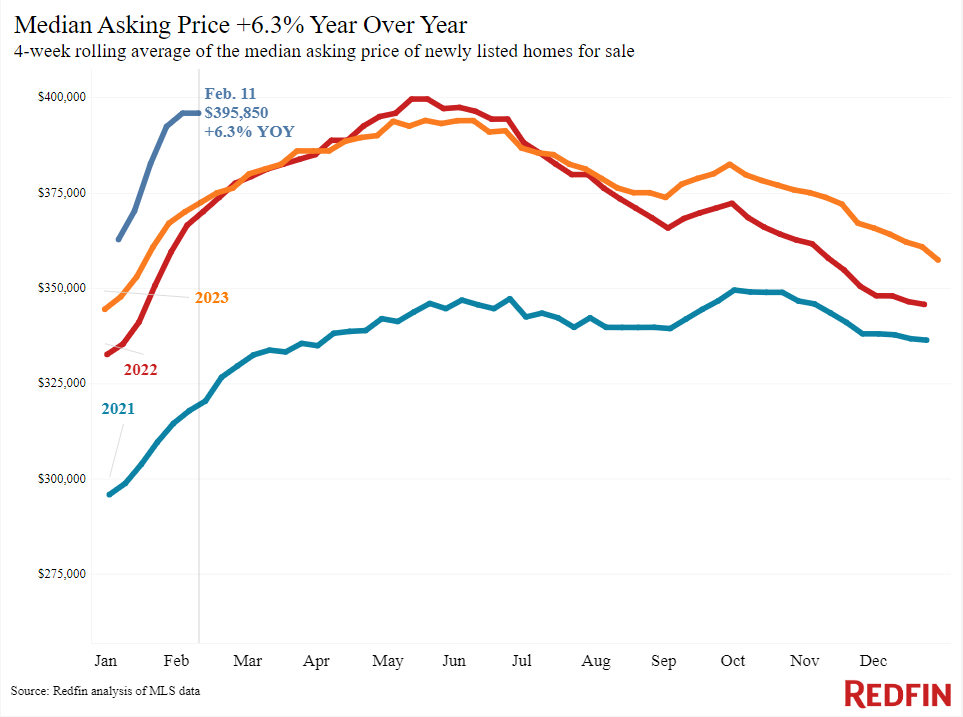
| Median asking price | $395,850 | 6.3% | |
| Median monthly mortgage payment | $2,608 at a 6.64% mortgage rate | 9.1% | Down roughly $110 from all-time high set in October 2023, but up roughly $250 from the four weeks ending Dec. 31 |
| Pending sales | 72,221 | -7.3% | Biggest decline since October 2023 (with the exception of the prior 4-week period, when there was a 7.4% decline) |
| New listings | 73,214 | 8% | |
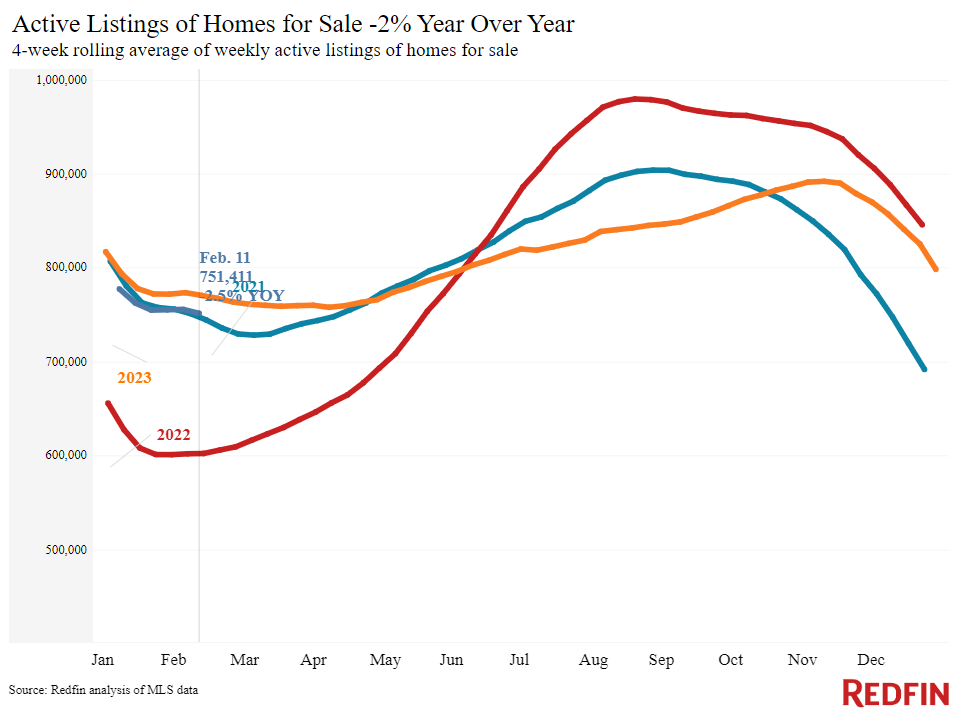
| Active listings | 751,411 | -2.5% | |
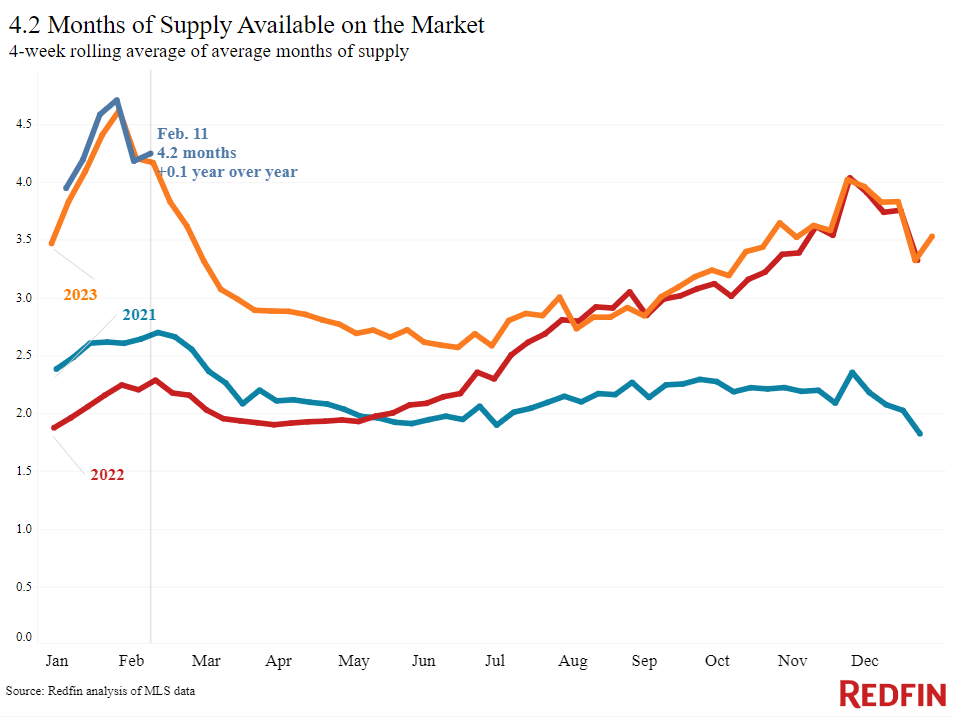
| Months of supply | 4.2 months | +0.1 pt. | 4 to 5 months of supply is considered balanced, with a lower number indicating seller’s market conditions. |
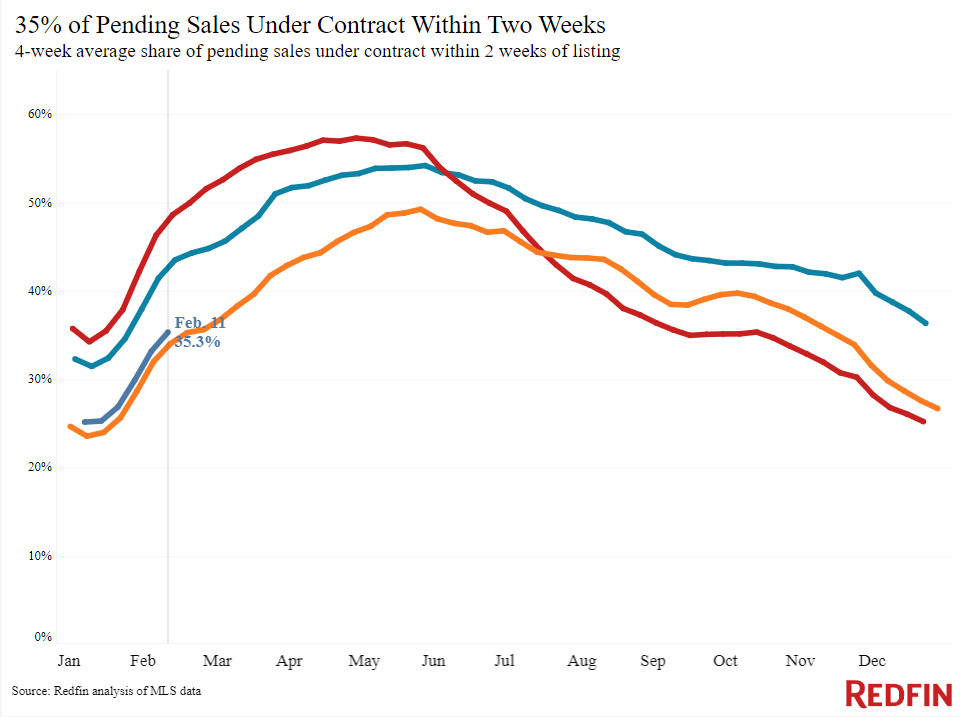
| Share of homes off market in two weeks | 35.3% | Up from 34% | |
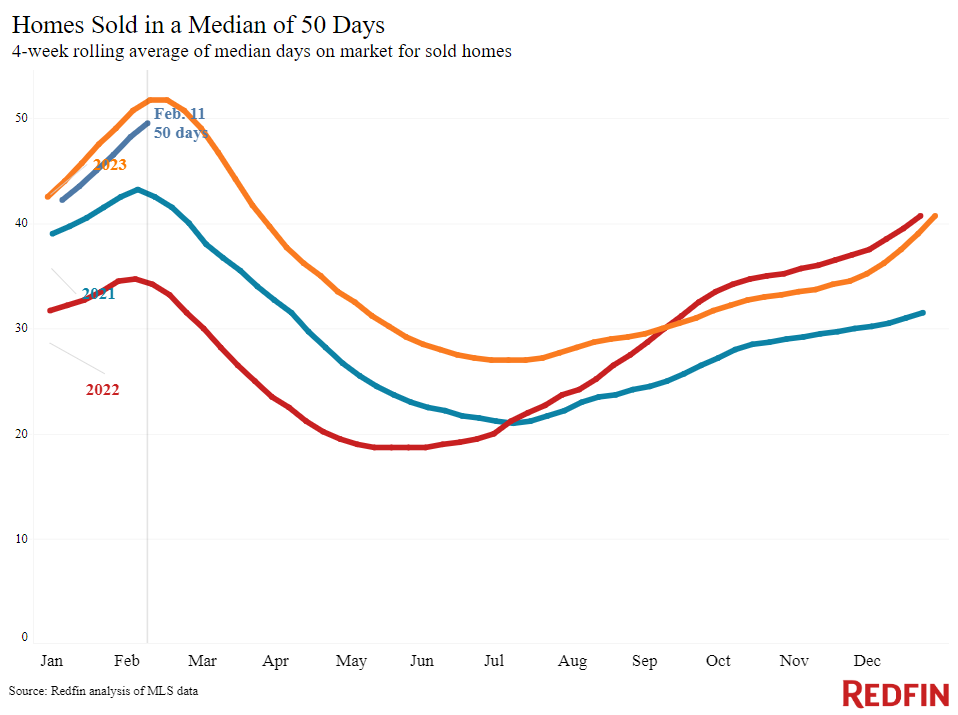
| Median days on market | 50 | -2 days | |
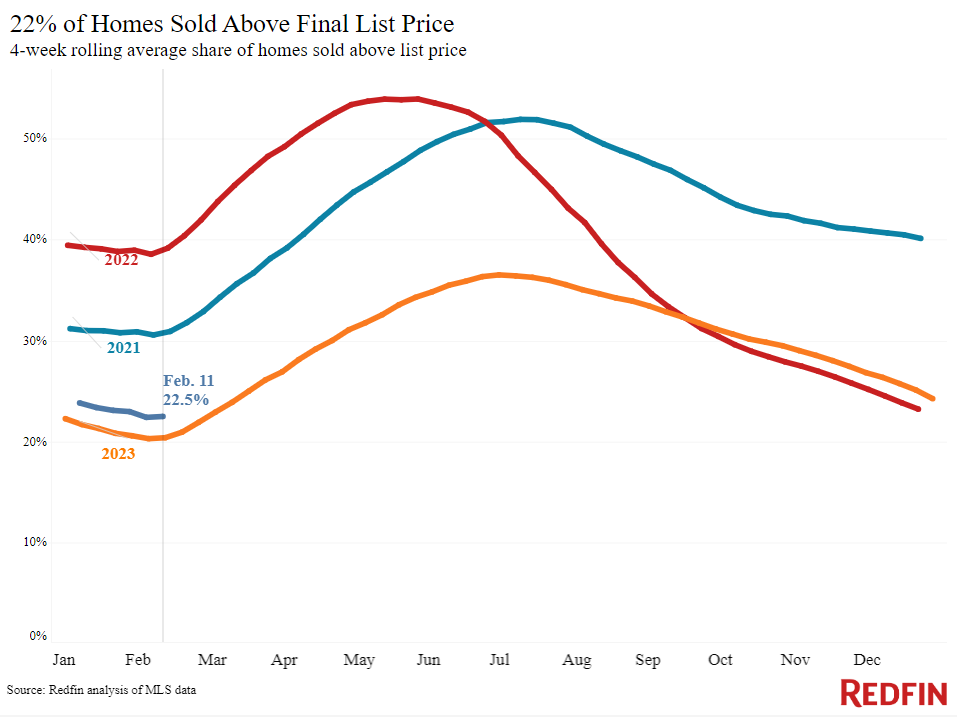
| Share of homes sold above list price | 22.5% | Up from 20% | |
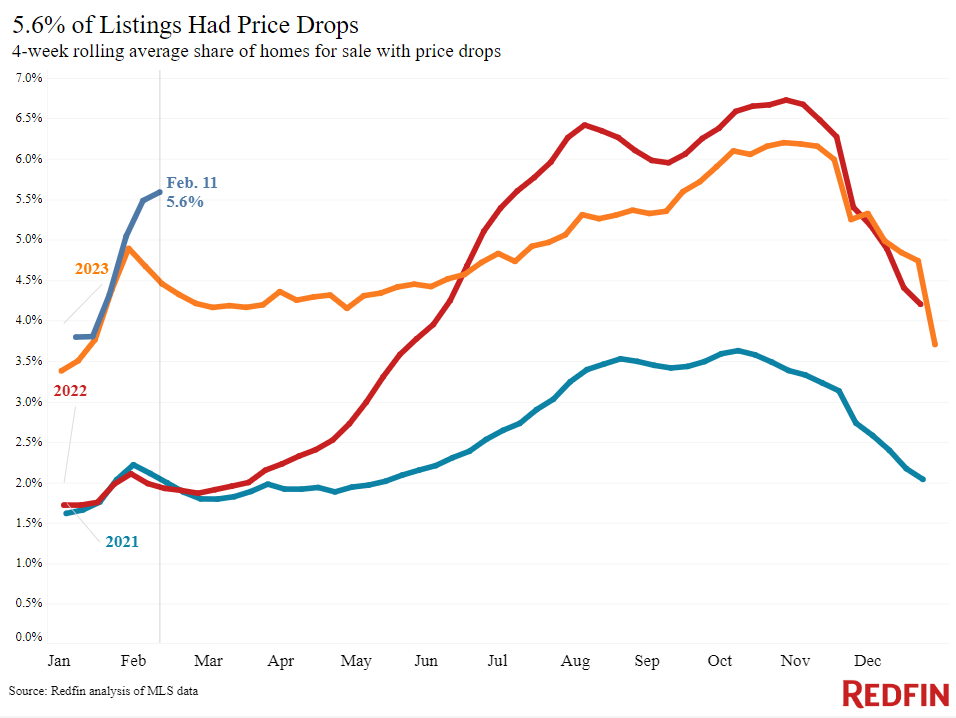
| Share of homes with a price drop | 5.6% | +1.1 pts. | |
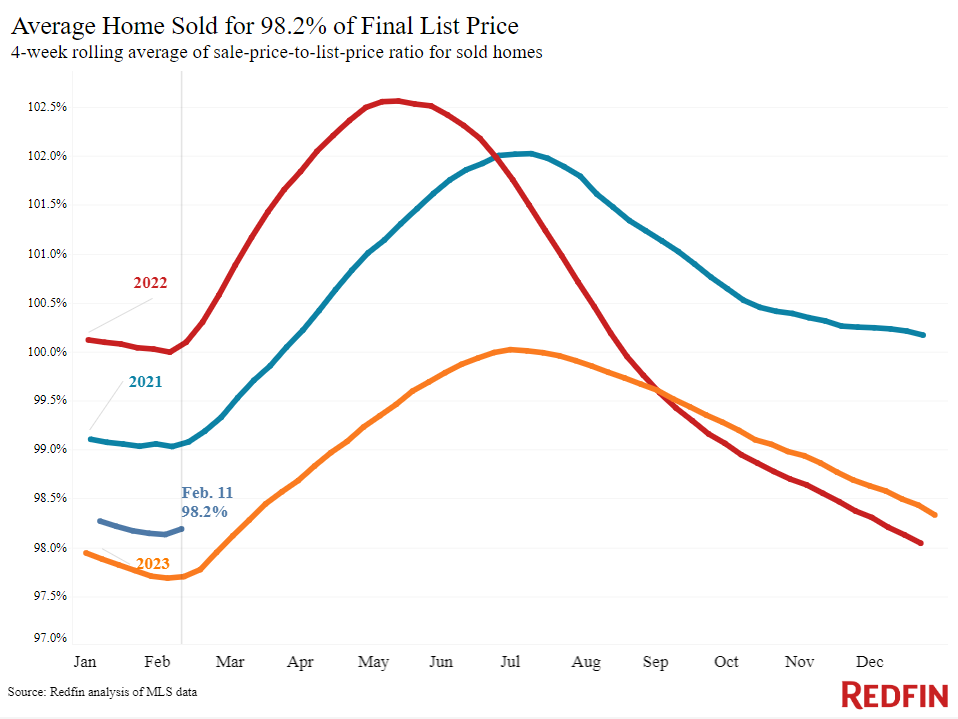
| Average sale-to-list price ratio | 98.2% | +0.5 pts. | |
|
Metro-level highlights: Four weeks ending February 11, 2024 Redfin’s metro-level data includes the 50 most populous U.S. metros. Select metros may be excluded from time to time to ensure data accuracy. |
|||
|---|---|---|---|
| Metros with biggest year-over-year increases | Metros with biggest year-over-year decreases | Notes | |
|
Median sale price |
Newark, NJ (14%)
New Brunswick, NJ (13.8%) Miami (13.2%) Anaheim, CA (12.8%) Warren, MI (12%) |
San Antonio, TX (-5.2%)
Austin, TX (-1.4%) Fort Worth, TX (-0.7%) |
Declined in 3 metros |
| Pending sales | San Jose, CA (9%)
Cleveland, OH (2%) San Francisco (1.9%) |
Portland, OR (-31.3%)
San Antonio, TX (-28.4%) Warren, MI (-24.2%) Nashville, TN (-21.8%) New Brunswick, TN (-20.1%) |
Increased in 3 metros |
| New listings | Dallas, TX (28.6%)
Jacksonville, FL (28.4%) Fort Lauderdale, FL (26.7%) Miami (25.6%) Tampa, FL (19.6%) |
Milwaukee, WI (-13.5%)
Atlanta (-13.3%) Chicago (-11.9%) Portland, OR (- 11.7%) Nashville, TN (-7.4%) |
Declined in 12 metros |
Refer to our metrics definition page for explanations of all the metrics used in this report.