
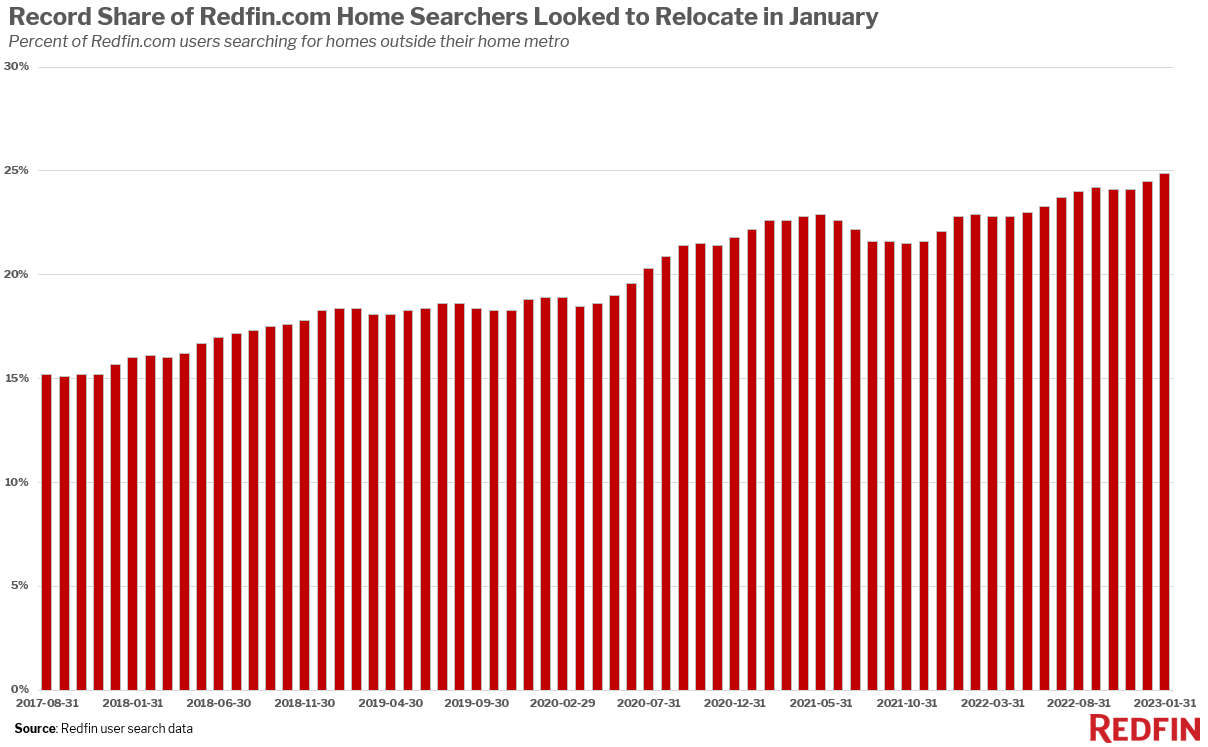
A record 25% of Redfin.com home searchers looked to move to a different U.S. metro in January, many in search of relatively affordable housing. Miami, Sacramento and Las Vegas were the most popular destinations.
A record one-quarter (24.9%) of Redfin.com users nationwide looked to move to a different metro area in January as remote work and elevated housing costs drove homebuyers to relocate.
That’s up from 24.5% in the fourth quarter, 22.8% a year ago and roughly 18% before the pandemic.
High mortgage rates have caused many would-be homebuyers to back out of the market, with overall U.S. home sales down considerably from a year ago. But among the people who are buying homes, a record portion are relocating. That’s largely due to the ongoing affordability crisis.
The typical monthly housing payment is 26% higher than it was in the beginning of 2022. That’s because mortgage rates remain near the 20-year high hit in November and home prices are still up from a year ago despite the cooling market.
High housing costs–along with the rising price of other goods and services due to inflation–make relatively affordable destinations attractive, especially for remote workers with the flexibility to relocate. While home prices soared last year in many popular migration destinations like Sacramento and Phoenix, those places are now among those where prices are dropping fastest. Plus, they’re much more affordable than the places people are leaving. Los Angeles, where the typical home sells for about $800,000, was the most common origin for homebuyers moving to Las Vegas and Dallas, both popular destinations where the typical home sells for roughly half of that.
Miami reclaims status as top migration hotspot
Miami was the most popular migration destination in January, claiming the top spot for the first time since August. Popularity is determined by net inflow, a measure of how many more Redfin.com users are looking to move into an area than leave. Half of the 10 most popular destinations are in Florida: Tampa, Cape Coral, Orlando and North Port-Sarasota are also on the list.
Homes in Florida certainly aren’t cheap; the typical Miami home sold for $470,000 in January, compared with the $383,000 national median. But they do tend to be less expensive than the places people are coming from. The typical home in New York, the top origin for homebuyers relocating to Miami, sold for $650,000 in January. Plus, Florida’s overall cost of living is lower because it doesn’t have a state income tax.
“A lot of buyers have flocked into coastal Florida from out of town over the last several months,” said Elena Fleck, a Redfin agent in Palm Beach, which is part of the larger Miami metro area. “Buyers moving in from places like New York and San Francisco are helping the local market recover from last fall’s housing downturn. They’re not nearly as fazed by high mortgage rates because homes here are so much less expensive than their hometowns, and they get larger lots, pools, nice weather and lower taxes.”
After Miami, Sacramento, Las Vegas and Phoenix were the most popular destinations. Those are all mainstays on the migration hotspot list because, like Florida, buyers moving in from expensive coastal cities can find bigger homes for less money in warm climates. The typical home in eight of the 10 most popular destinations is less expensive than the typical home in the most common origin.
But fewer Redfin.com users looked to move to eight of the 10 most popular destinations than a year earlier, a shift that’s due to overall homebuying demand coming down from its high.
| Top 10 Metros Homebuyers Are Moving Into, by Net Inflow
Net inflow = Number of Redfin.com home searchers looking to move into a metro area, minus the number of searchers looking to leave |
|||||
| Rank | Metro* | Net Inflow, Jan. 2023 | Net Inflow, Jan. 2022 | Top Origin | Top Out-of-State Origin
|
| 1 | Miami, FL | 7,200 | 11,400 | New York, NY | New York, NY |
| 2 | Sacramento, CA | 6,200 | 7,200 | San Francisco, CA | Chicago, IL |
| 3 | Las Vegas, NV | 5,700 | 6,900 | Los Angeles, CA | Los Angeles, CA |
| 4 | Phoenix, AZ | 5,500 | 9,900 | Seattle, WA | Seattle, WA |
| 5 | Tampa, FL | 5,200 | 7,500 | New York, NY | New York, NY |
| 6 | Dallas, TX | 4,400 | 7,300 | Los Angeles, CA | Los Angeles, CA |
| 7 | Cape Coral, FL | 4,200 | 5,500 | Chicago, IL | Chicago, IL |
| 8 | Orlando, FL | 3,800 | 1,700 | New York, NY | New York, NY |
| 9 | North Port-Sarasota, FL | 3,800 | 5,300 | Chicago, IL | Chicago, IL |
| 10 | Houston, TX | 3,700 | 2,900 | New York, NY | New York, NY |
| *Combined statistical areas with at least 500 users searching to and from the region in November 2022-January 2023 | |||||
Homebuyers are leaving coastal California more than anywhere else
More homebuyers looked to leave San Francisco and Los Angeles than any other U.S. metro in January. Next come New York, Washington, D.C., Chicago and several other major cities. This ranking is determined by net outflow, a measure of how many more people are looking to leave a metro than move in.
Expensive coastal areas are perennially on the list of places people are looking to leave, a trend that has been exacerbated by remote work.
There are fewer homebuyers leaving most of those places than a year earlier, reflecting the slow housing market. The net outflow from seven of the top 10 metros was smaller in the fourth quarter than a year earlier. The slowdown was especially pronounced in Seattle, which had a net outflow of roughly 3,400 in January, down from 19,000 a year earlier.
| Top 10 Metros Homebuyers Are Leaving, by Net Outflow
Net outflow = Number of Redfin.com home searchers looking to leave a metro area, minus the number of searchers looking to move in |
||||||
| Rank | Metro* | Net Outflow, Jan. 2023 | Net Outflow, Jan. 2022 | Portion of Local Users Searching Elsewhere | Top Destination | Top Out-of-State Destination
|
| 1 | San Francisco, CA | 30,200 | 41,500 | 26% | Sacramento, CA | Seattle, WA |
| 2 | Los Angeles, CA | 20,100 | 31,000 | 18% | Las Vegas, NV | Las Vegas, NV |
| 3 | New York, NY | 19,800 | 19,700 | 27% | Miami, FL | Miami, FL |
| 4 | Washington, D.C. | 14,900 | 15,200 | 18% | Miami, FL | Miami, FL |
| 5 | Chicago, IL | 7,900 | 6,400 | 18% | Cape Coral, FL | Cape Coral, FL |
| 6 | Boston, MA | 5,600 | 9,400 | 20% | Portland, ME | Portland, ME |
| 7 | Seattle, WA | 3,400 | 19,000 | 19% | Phoenix, AZ | Phoenix, AZ |
| 8 | Denver, CO | 3,300 | 3,400 | 33% | Chicago, IL | Chicago, IL |
| 9 | Hartford, CT | 2,400 | 600 | 74% | Boston, MA | Boston, MA |
| 10 | Detroit, MI | 1,400 | 250 | 25% | Grand Rapids, MI | Cleveland, OH |
| *Combined statistical areas with at least 500 users searching to and from the region in November 2022-January 2023 | ||||||
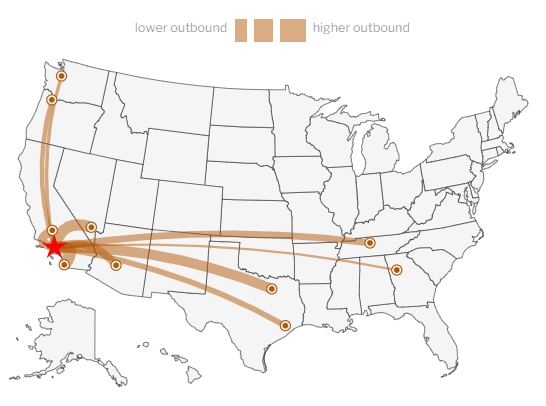
Below is a map of the most popular destinations for Redfin.com users who are leaving the Los Angeles metro. To view similar maps for the metros in this report and other metros, please visit the area’s Redfin housing market page and scroll down to the “migration” section.
Methodology
Our migration analysis is based on about two million Redfin.com users who viewed for-sale homes online across more than 100 metro areas from November 2022 to January 2023. To measure the share of homebuyers looking to relocate from one metro to another, we calculate the portion of overall home searchers that are migrants.
A Redfin.com user counts as a migrant if they viewed at least 10 for-sale homes in the third quarter and at least one of those homes was outside their home metro area. For instance, if a Redfin.com user based in Seattle views 10 homes in a three-month period and all of them are in Phoenix, that user counts as a full migrant to Phoenix. If a user based in Seattle views 10 homes in a three-month period and five are in Phoenix but five are in San Diego, that user counts as half of a migrant to Phoenix and half of a migrant to San Diego. If a user based in Seattle views 10 homes in a three-month period, nine in Seattle and one in Phoenix, that user counts as one-tenth of a migrant to Phoenix.
The analysis includes combined statistical areas with at least 500 Redfin.com users based in that region and at least 500 users searching for homes in that region. For instance, a user based in Seattle searching for a home in Phoenix counts toward the first condition, a user based in Phoenix searching for a home in Seattle counts toward the second condition, and a user based in Seattle searching for a home in Seattle counts toward both. Redfin’s migration data goes back to 2017.


