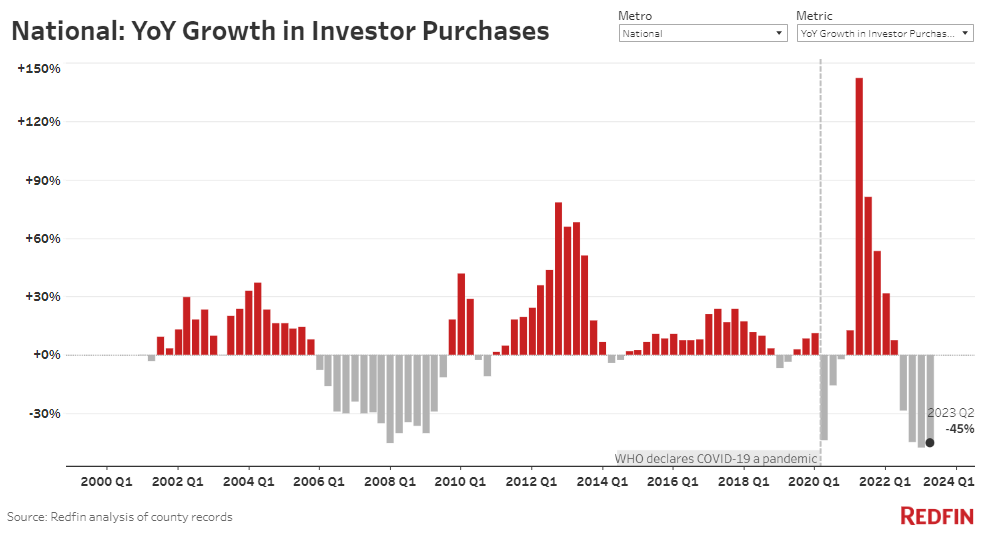
- The drop in investor purchases outpaced the 31% decline in overall home sales.
- Investor market share is down to 16% after hitting an all-time high of 20% in the first quarter of 2022.
- Investors are also making up a smaller share of the home-selling pie, with 8% of new listings owned by investors, down from a peak of 13% at the end of 2021.
- Investors are gravitating to low-priced homes and single-family homes–though investor purchases of single-family homes declined year over year due to limited inventory.
- Investor market share and investor purchases retreated most in Phoenix, Las Vegas and other Sun Belt metros, as those places boomed during the pandemic and have a lot of room to fall.
Investor home purchases fell 45% from a year earlier in the second quarter, outpacing the 31% drop in overall home sales. That’s the biggest decline since 2008 with the exception of the quarter before, when they dropped 48%. The decline comes as this year’s relatively cool housing and rental markets makes investing in homes less attractive than it was during the pandemic-driven homebuying frenzy of 2021 and early 2022.
This is according to a Redfin analysis of county records across 39 of the most populous U.S. metropolitan areas. We define an investor as any institution or business that purchases residential real estate. When we refer to a “record,” the record dates back to the first quarter of 2000. This data is subject to revision. A more detailed methodology is at the end of this report.
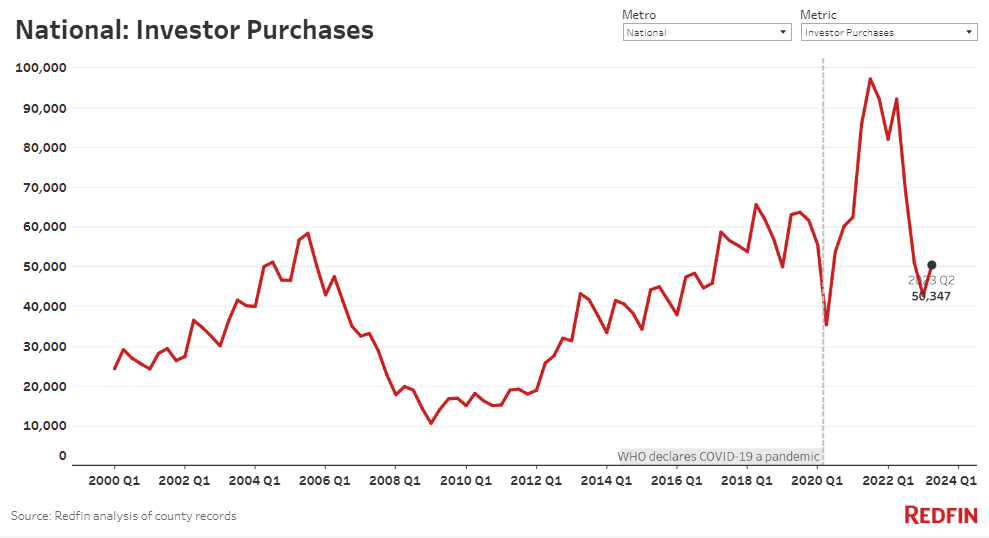
The drop in purchases has brought the total number of homes bought by investors below pre-pandemic levels. Real estate investors bought roughly 50,000 U.S. homes in the second quarter, the fewest of any second quarter in seven years, with the exception of the start of the pandemic. (This data is seasonal, with investor purchases typically hitting lows in the first quarter then peaking in the second quarter.)
This marks a retreat from a boom in investor activity during the pandemic, which was driven by record-low mortgage rates and huge homebuying and rental demand, creating opportunities for investors to make a lot of money.
“Offers from hedge funds have dried up; I haven’t received an offer from one in a long time, except unrealistically low offers,” said Las Vegas Redfin Premier agent Shay Stein. “From mid-2020 until early 2022 when interest rates started going up, hedge funds bought up a ton of properties and immediately turned them into rentals, pricing out local buyers. Now a big portion of our homes are owned by investors, but they’re not adding to their portfolios.”
In dollar terms, the drop in investor purchases is almost as big. Investors bought a total of $36.4 billion worth of homes in the second quarter, down 42% from a year earlier. That’s still above pre-pandemic levels, but dropping closer to it: Investors bought a total of $34 billion in the second quarter of 2018, and a total of $31.9 billion in the second quarter of 2019. The typical home purchased by investors in the second quarter cost $470,120, comparable with the $467,885 median price a year earlier.
In terms of market share, investors bought 15.6% of homes that were sold in the U.S. during the second quarter, down from 19.7% a year earlier and a record high of 20.4% in the beginning of 2022.
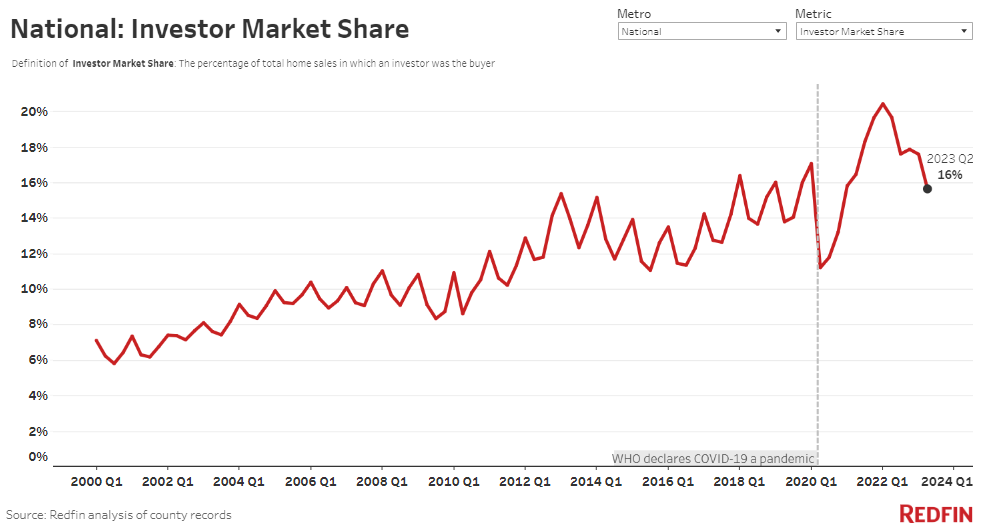
While investors’ market share is still above pre-pandemic levels (15.6% compared with roughly 14% in the second quarters of both 2018 and 2019), real estate investors are steadily pulling back. Their market share has dropped or remained flat every quarter since it peaked at the start of 2022.
Limited inventory, limited demand deter investors even more than individual buyers
The outsized drop in purchases by investors helps explain why their market share is coming down: Investors backed off from the housing market faster than individual homebuyers in the second quarter.
Stubbornly high home prices and mortgage rates, limited inventory and widespread economic uncertainty have dampened housing demand and suppressed overall home sales. Those factors are an even bigger deterrent for investors, because they’re in it purely for the potential to make money by flipping homes or renting them out. When housing demand is down, investors are less motivated. There’s always at least some demand from individual buyers who need to move, but the same isn’t true for investors.
Additionally, investors themselves were deterred by high home prices and high interest rates. Roughly 7 of every 10 (71%) investor purchases were made in cash in the second quarter–down from 75% a year earlier–but they’re still impacted by high interest rates because they often use other types of loans to cover expenses.
“Moving forward, the investors who do come back may be more focused on scooping up rental properties than flipping homes,” said Redfin Senior Economist Sheharyar Bokhari. “All signs point to the rental market remaining relatively strong. Home prices and mortgage rates are high enough to motivate would-be first-time homebuyers to continue renting. The typical U.S. asking rent remains quite high, just $16 shy of its all-time high, so investors who are landlords stand to earn money. Investor purchases of rental properties could be limited by some of them building new properties to rent out, though.”
“Home flippers may be slower to come back,” Bokhari continued. “That’s mainly because mortgage rates are unlikely to decline significantly in the short term, which will keep homebuying demand relatively low and discourage flippers. Plus, investors have lower-risk places to park their money right now than real estate, with high yields in the bond market.”
Even if investors’ market share does pick back up, their purchase volume is likely to remain low. Like other buyers, they’re limited by a severe lack of listings, with homeowners locked in by relatively low mortgage rates.
Investors’ share of new listings is falling–but those who are selling are seeing big gains
Homes owned by investors are making up a smaller share of new listings on the market. Investors owned 8% of new listings in March, down slightly from 9% a year earlier and down from a peak of 13% at the end of 2021. Investors listed 36% fewer homes than a year earlier, compared with a 24% drop in overall new listings. March is the most recent month for which this data is available.
Most investors who are still flipping homes are making money. The typical home flipper who sold a home in June sold for 61% ($188,448) more than their initial purchase price. Though that’s a substantial gain, it’s down from a 69% ($199,946) premium a year earlier.
Just 3% of homes sold by flippers sold at a loss in June, down from a peak of 29% in September 2022 and roughly on par with 4% a year earlier.
“Investors aren’t helping to solve the country’s severe inventory shortage or its housing affordability crisis,” Bokhari said. “Flippers are putting far fewer homes on the market than they were during the same period in 2021 or 2022, and hardly any of them are taking a loss, which would at least give individual homebuyers a somewhat good deal. And the steady decline in investor purchases means they aren’t likely to replenish the housing market with newly renovated homes anytime soon.”
In this section, “ flipper” refers to an investor who sold a home within nine months of buying it. Additionally, flippers selling at a higher price than they bought doesn’t necessarily equal profit because it doesn’t take into account the money they spent renovating it.
Investors most commonly buy low-priced homes
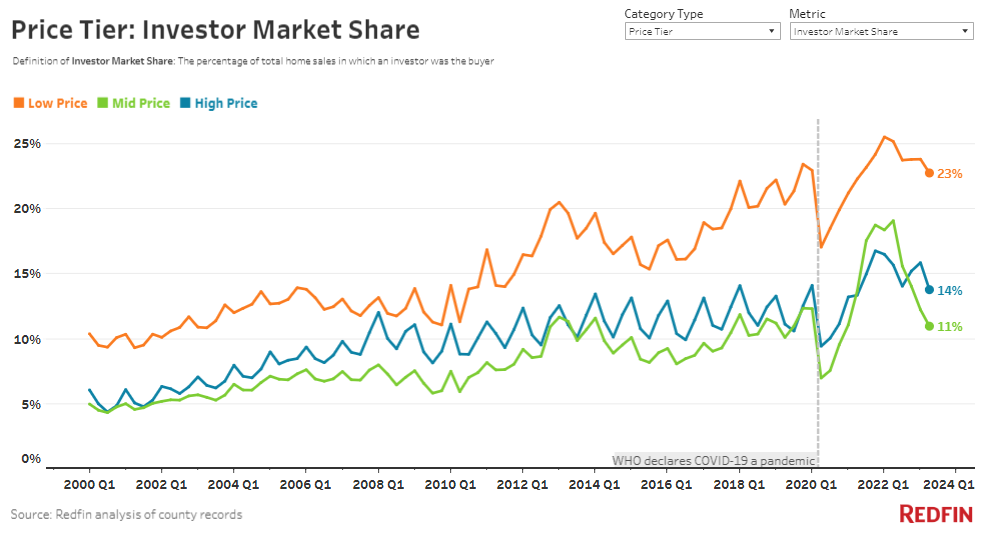
Investors bought 23% of low-priced homes that sold in the second quarter, down from 25% a year earlier but still much higher than investors’ market share for more expensive homes. They bought 11% of mid-priced homes, down from 19% a year earlier, and 14% of high-priced homes, down from 16% a year earlier.
Investors are attracted to low-priced homes for the same reason as other homebuyers: They cost less, which is especially attractive when home prices and interest and mortgage rates remain elevated. Investors who are buying homes to flip and re-sell are doing so in hopes that they can buy low and sell higher. Small homes–those with 1,400 square feet or less–made up 39.2% of investor purchases in the second quarter, the highest share of any second quarter on record and down just slightly from the record high of 40.6% in the first quarter of 2023.
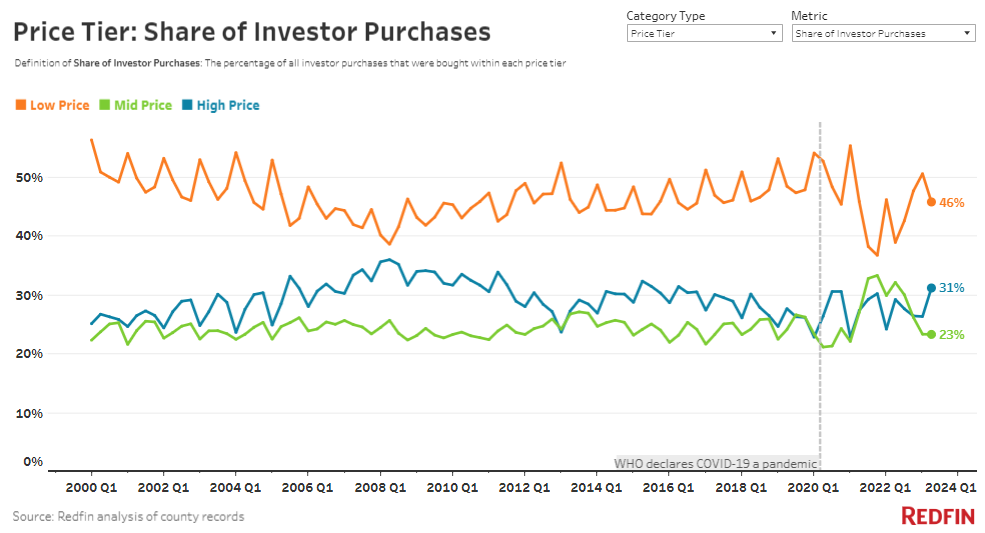
In that same vein, low-priced homes low-priced homes make up a substantial piece of investors’ homebuying pie. Low-priced homes made up 46% of investor purchases in the second quarter, up from 39% a year earlier. High-priced homes made up 31% of investor purchases, up from 29% a year earlier.
The uptick for the most affordable and the most expensive homes has cut into the share of mid-priced homes. Mid-priced homes made up 23% of investor purchases, down from a near-record-high of 32% a year earlier.
Single-family homes represent nearly 7 in 10 investor purchases
Single-family homes made up 68% of investor purchases in the second quarter. That’s down from 73% a year earlier, but still the lion’s share of purchases by real estate investors. The decline is partly due to a lack of single-family homes for sale.
Next come condos, which made up 20% of investor purchases, up from 16% a year earlier and the highest share since 2018. Townhouses made up 7% of purchases, followed by multi-family properties, which accounted for 5%.
But in terms of market share, investors have the highest when it comes to multi-family properties. Real estate investors purchased 31% of multi-family properties that sold in the second quarter, just shy of 32% a year earlier. Investors make up a relatively high share of multi-family purchases because those buildings are typically expensive and used as rental properties.
Investors purchased 15% of single-family homes, down from 20% a year earlier. Investors bought roughly one out of every six condos and townhouses that sold, on par with last year.
Metro-level highlights: Investor activity
The highlights below are for the second quarter of 2023, unless otherwise noted
-
- Metros where investor market share dropped most. Investors bought roughly 17% of homes sold in Phoenix, down from 32% a year earlier, the biggest decline of the metros in this analysis. The next-biggest drops were in Las Vegas and Atlanta, where roughly 18% of homes were bought by investors, down from about 33%. Jacksonville, FL (19%, down from 32%) and Charlotte, NC (16%, down from 29%) round out the top five. Investor market share–and investor purchases (see below)–fell most in the Sun Belt and Florida because those places had an even bigger boom in homebuying demand and investor activity than the rest of the country in 2021 and 2022. Now investors are pulling back quickly as those markets cool. Plus, several of those metros were popular among the iBuyer type of investor, many of which have now ceased operations.
- Metros where investor market share increased most. Investor market share fell in 25 of the metros in this analysis, and rose in the other 14–all modest increases. The biggest increase was in New York, where investors bought 18% of homes sold, up from about 16% a year earlier. Next come Seattle (11%, up from about 9%), Cleveland (20%, up from about 18%), Chicago (11%, up from about 10%) and Riverside, CA (19%, up from about 18%).
- Metros where investor purchases dropped most. Investor purchases dropped most in the same places where market share declined most. They dropped 65% year over year in Las Vegas, Jacksonville and Phoenix, the biggest declines of the metros in this analysis. They’re followed closely by Atlanta (-64%) and Charlotte, NC (-62%).
- Metros with the smallest declines in investor purchases. Investor purchases fell in all the metros Redfin analyzed, but they had the smallest year-over-year declines in Chicago (-13%), Providence, RI (-22%), West Palm Beach, FL (-23%), Seattle (-23%) and Cleveland (-25%).
- Metros with the highest market share. Investors had the highest market share in Miami, where they made 30% of home purchases. Next come three California metros: San Diego (22%), Anaheim, CA (21%) and San Francisco (21%). Cleveland (20%) rounds out the top five. Miami’s market share is high and holding steady (it’s down just 1 percentage point year over year) because it remains popular with both U.S. and foreign investors as its housing market has stayed relatively hot throughout this downturn.
- Metros with the highest median sale price of investor-bought homes. The median price of homes bought by investors in both San Francisco and San Jose was $1.8 million, by far the highest of the metros in this analysis. Next come three other California metros: Anaheim ($1.2 million), Oakland ($1.1 million) and Los Angeles ($1 million).
- Metros with the highest share of investor-owned new listings (March 2023): Miami (15%), Fort Lauderdale (12%) and Los Angeles (11%).
- Metros with the lowest share of investor-owned new listings (March 2023): Seattle (4%) and Providence, RI (4%).
- Metros with the highest share of investor-owned properties selling at a loss (June 2023): Detroit (14%), Phoenix (13%), San Francisco (12%) and Las Vegas (11%).
- Metros with the lowest share of investor-owned properties selling at a loss (June 2023): Columbus, OH (1%), San Diego (2%) and Miami (2%).
| Metro-Level Summary: Investor Home Purchases, Q2 2023
Includes the 39 most populous U.S. metros for which data was available |
|||||
| U.S. metro area | Investor purchases, YoY change | Total value of homes bought by investors | Median sale price of homes bought by investors | Share of purchased homes bought by investors | Share of purchased homes bought by investors, YoY change (in percentage points) |
| Anaheim, CA | -26.5% | $2,071,640,045 | $1,208,000 | 21.2% | -0.03 |
| Atlanta, GA | -64.2% | $1,239,203,362 | $253,600 | 17.8% | -14.63 |
| Baltimore, MD | -26.5% | $328,919,394 | $150,000 | 16.5% | 0.66 |
| Charlotte, NC | -61.5% | $568,460,541 | $269,500 | 16.0% | -12.54 |
| Chicago, IL | -12.5% | $773,090,699 | $245,000 | 11.2% | 1.24 |
| Cincinnati, OH | -31.2% | $221,474,525 | $155,000 | 17.2% | -0.82 |
| Cleveland, OH | -24.6% | $185,129,469 | $101,836 | 19.7% | 1.63 |
| Columbus, OH | -46.5% | $225,617,709 | $200,000 | 13.6% | -5.18 |
| Denver, CO | -52.1% | $957,828,877 | $515,300 | 12.5% | -3.96 |
| Detroit, MI | -26.7% | $110,521,752 | $82,000 | 18.8% | -1.18 |
| Fort Lauderdale, FL | -33.4% | $980,913,103 | $350,000 | 18.5% | -1.95 |
| Jacksonville, FL | -64.8% | $394,232,576 | $245,000 | 19.3% | -12.61 |
| Las Vegas, NV | -65.0% | $785,918,213 | $385,000 | 17.5% | -14.63 |
| Los Angeles, CA | -34.6% | $4,224,657,036 | $1,045,000 | 18.6% | -1.47 |
| Miami, FL | -41.1% | $2,150,306,167 | $450,000 | 29.7% | -0.96 |
| Milwaukee, WI | -32.6% | $158,918,788 | $152,750 | 14.0% | -1.65 |
| Minneapolis, MN | -39.5% | $427,945,972 | $282,170 | 10.0% | -1.31 |
| Montgomery County, PA | -29.1% | $179,861,239 | $300,000 | 9.1% | 0.73 |
| Nashville, TN | -52.9% | $589,228,771 | $366,321 | 15.7% | -7.20 |
| New Brunswick, NJ | -26.0% | $466,506,181 | $384,900 | 11.2% | 0.12 |
| New York, NY | -26.3% | $2,818,651,776 | $775,000 | 18.1% | 2.25 |
| Newark, NJ | -31.3% | $296,395,584 | $408,000 | 12.5% | 0.24 |
| Oakland, CA | -30.6% | $1,169,317,000 | $1,100,000 | 15.3% | 0.62 |
| Orlando, FL | -55.4% | $720,501,488 | $316,000 | 18.1% | -9.51 |
| Philadelphia, PA | -27.2% | $228,603,072 | $133,159 | 17.6% | 1.18 |
| Phoenix, AZ | -64.6% | $2,052,937,410 | $415,000 | 16.5% | -15.26 |
| Portland, OR | -35.9% | $425,547,309 | $535,000 | 11.8% | 0.67 |
| Providence, RI | -21.9% | $96,484,368 | $305,000 | 8.3% | 0.57 |
| Riverside, CA | -34.2% | $1,435,877,865 | $565,000 | 18.5% | 1.18 |
| Sacramento, CA | -38.9% | $775,175,400 | $605,000 | 16.6% | -1.54 |
| San Diego, CA | -31.1% | $2,068,671,500 | $999,500 | 21.9% | -0.24 |
| San Francisco, CA | -31.6% | $1,459,292,420 | $1,812,500 | 20.6% | 0.27 |
| San Jose, CA | -29.5% | $1,188,205,364 | $1,800,000 | 15.7% | -0.17 |
| Seattle, WA | -23.1% | $777,506,242 | $856,000 | 10.6% | 1.86 |
| Tampa, FL | -51.7% | $1,071,828,499 | $300,000 | 15.5% | -9.37 |
| Virginia Beach, VA | -33.4% | $192,727,327 | $182,350 | 10.2% | -0.72 |
| Warren, MI | -38.5% | $144,747,929 | $167,000 | 8.7% | -0.31 |
| Washington, DC | -29.8% | $834,863,756 | $435,000 | 8.4% | 0.14 |
| West Palm Beach, FL | -22.9% | $1,568,224,474 | $497,000 | 17.1% | -1.25 |
Methodology
For this analysis, we looked at county sale records for homes purchased from January 2000 through June 2023. We define an investor as any buyer whose name includes at least one of the following keywords: LLC, Inc, Trust, Corp, Homes. We also define an investor as any buyer whose ownership code on a purchasing deed includes at least one of the following keywords: association, corporate trustee, company, joint venture, corporate trust. This data may include purchases made through family trusts for personal use.
We analyzed home sales in the 50 most populous metro areas, but only included 39 metros in this report due to non-disclosure of sale prices in some counties.
For the price-tier analysis, we looked at all home sales in a given year and sorted each sale into one of three buckets: low-priced, mid-priced or high-priced. Low-priced means a home’s sale price was in the bottom tercile of local sale prices, while mid-priced means it was in the middle tercile and high-priced means it was in the top tercile.