
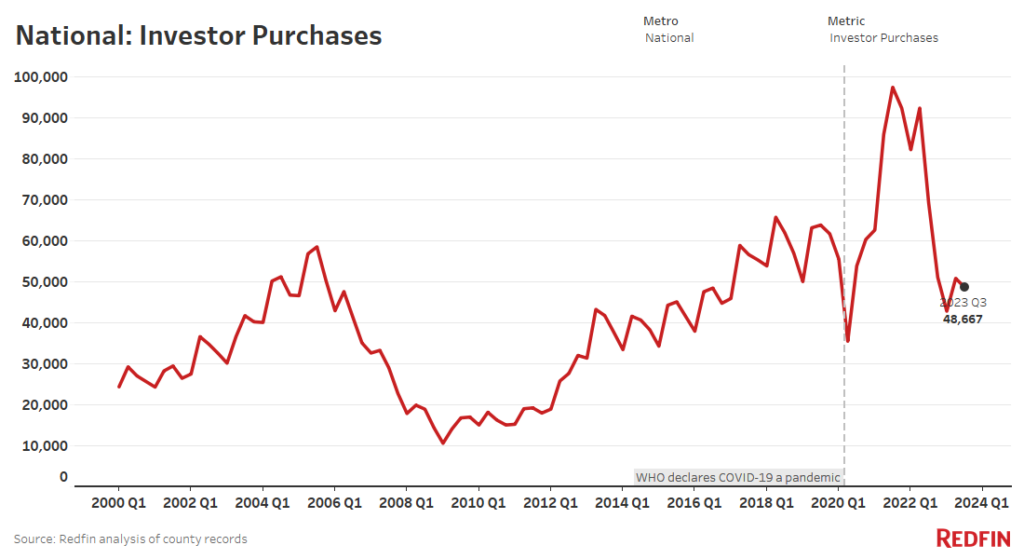
Nationwide, investor purchases fell 30% year over year to the lowest third-quarter level in seven years, as rising mortgage rates, high home prices and a lackluster rental market made investing less attractive.
Investor purchases of U.S. homes dropped 29.7% year over year in the third quarter to 48,667—the lowest level of any third quarter since 2016. By comparison, overall home purchases fell 22.2% to 305,219—the lowest third-quarter level since 2012.
The seven metros where investor purchases declined fastest are all in the Sun Belt. Atlanta saw the steepest decline (-49.7%), followed by Charlotte, NC (-49.6%), Jacksonville, FL (-48.2%), Phoenix (-47.4%), Las Vegas (-43.3%), Orlando, FL (-42.6%) and Tampa, FL (-41.3%).
This is according to a Redfin analysis of county records across 39 of the most populous U.S. metropolitan areas. The national figures in this report represent an aggregation of those metros. We define an investor as any institution or business that purchases residential real estate. When we refer to a “record,” the record dates back to the first quarter of 2000. Data is subject to revision.
“Investors are very quiet in Phoenix,” said local Redfin Premier real estate agent Heather Mahmood-Corley. “If I get any investor clients these days, it’s usually the mom-and-pop ones. The bigger investors who used to come in and buy five or 10 homes at a time—you just don’t see that anymore. The money they were getting from hedge funds has dried up, rents are down and demand for housing in general has slowed because so many people are staying put.”
Investors piled into the Sun Belt during the pandemic to profit off of surging housing and rental values as scores of remote workers moved in. Because investor purchases in the region jumped so dramatically, they now have relatively more room to fall. Appetite for homes in many Sun Belt metros has also cooled because so many buyers have been priced out.

Investors Bought $36 Billion Worth of U.S. Homes, Down 20% Year Over Year
Investors purchased $36 billion worth of U.S. homes in the third quarter, down 19.5% from a year earlier. The typical home purchased by investors cost $475,115, up slightly from $449,895 a year earlier, as overall home prices have ticked up.
Home purchases by both investors and individual buyers have plunged from pandemic heights because elevated mortgage rates and home prices have cut into buying power, and house hunters don’t have enough homes to choose from. The typical homebuyer’s monthly payment is now more than $2,700, up roughly 11% from a year ago, as mortgage rates remain elevated. While 71% of investor purchases were made in cash in the third quarter, investors are still impacted by high interest rates because they often use other types of loans to cover expenses.
Investors have retreated faster than regular buyers partly because many of them buy homes purely to make money, which has become harder to do. Home prices are growing, but at a far slower pace than they were during the pandemic homebuying boom, and many sellers are being forced to cut their list prices after putting their homes on the market due to sluggish demand. That’s making it less attractive to be in the business of home flipping. Investors who buy homes to generate rental income are backing off, too, because rents have stopped growing and rental vacancies are on the rise.
“We don’t expect investors to dive back into the market in a big way anytime soon,” said Redfin Senior Economist Sheharyar Bokhari. “Borrowing costs are unlikely to fall significantly in the near future, and while home prices may soften a bit, they probably won’t cool enough to bring back a critical mass of investors.”
Investors buy up homes when prices are low and they can find deals and/or when they expect prices to rise substantially. Today, prices are high and aren’t expected to post significant decreases or increases in the near future. Some investors are shifting their money into other investments that offer good returns and lower risk, such as Treasury bonds.
Investors Purchased Roughly One of Every Six Homes That Sold
Investors bought 15.9% of U.S. homes that sold in the third quarter, down slightly from 17.6% a year earlier but higher than pre-pandemic levels.
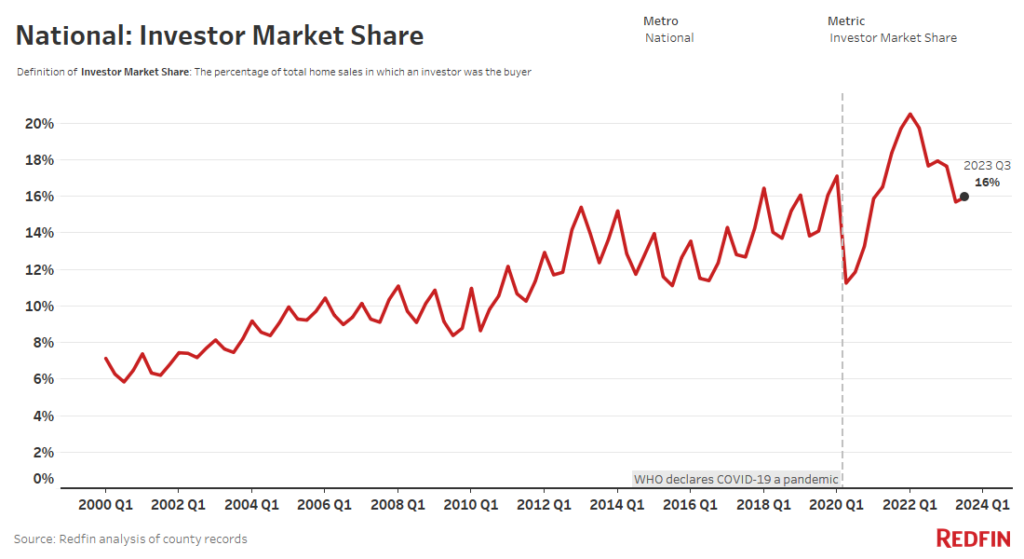
Investor market share has declined because investors have backed off from the housing market more quickly than regular homebuyers.
Investors Listed Fewer Homes, But Those Who Did Sell Still Reaped Gains
Investors listed 16.4% fewer homes in September than they did a year earlier. But the typical home sold by an investor went for $179,116 (61.2%) more than they originally bought it for. That’s up from $144,379 (44.6%) a year earlier. September is the most recent month for which this data is available.
Many of the investors who are selling today likely bought before the pandemic home price surge, which is why they’re still able to bring in profits. But it’s important to note that selling a home for more than the purchase price isn’t necessarily the same thing as reaping a large profit. That’s because investors, especially home flippers, spend money remodeling and maintaining homes before selling, which cuts into returns.
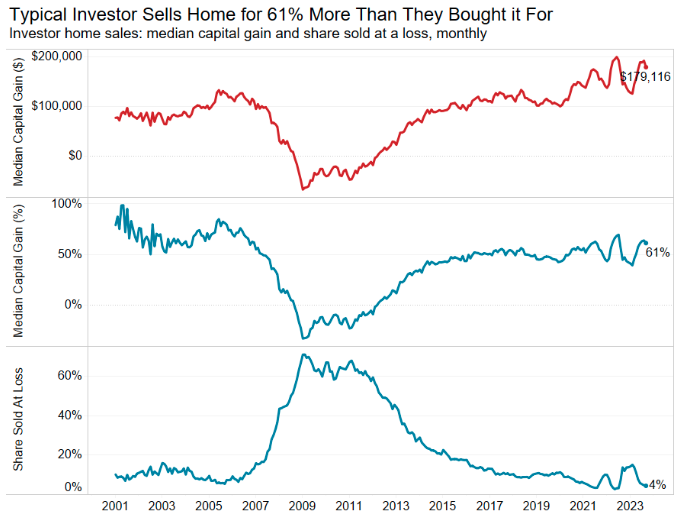
Overall, investors owned 8.2% of new listings in September, comparable with 8.8% a year earlier. Just 4.5% of homes sold by investors sold at a loss during the month, down from 13.8% a year earlier.
Mahmood-Corley of Phoenix said she’s seeing more investors sell than buy.
“The investors who bought up all the Airbnbs are selling—some are institutional investors and some are mom-and-pop investors who got in over their heads,” she said. “They’re selling because the Airbnb market isn’t as strong as it was during the pandemic, and in some areas, new rules on short-term rentals have made owning them less attractive. There are also just a lot of unknowns right now, so some people want to get rid of their investment properties so they don’t have to deal with the uncertainty.”
Investors Bought Nearly 1 of Every 4 Low-Priced Homes That Sold
Investors bought 23.5% of low-priced homes that sold in the third quarter, comparable with 23.8% a year earlier. They purchased 13.7% of high-priced homes (little changed from a year earlier) and 11.4% of mid-priced homes (down from 15.6% a year earlier).
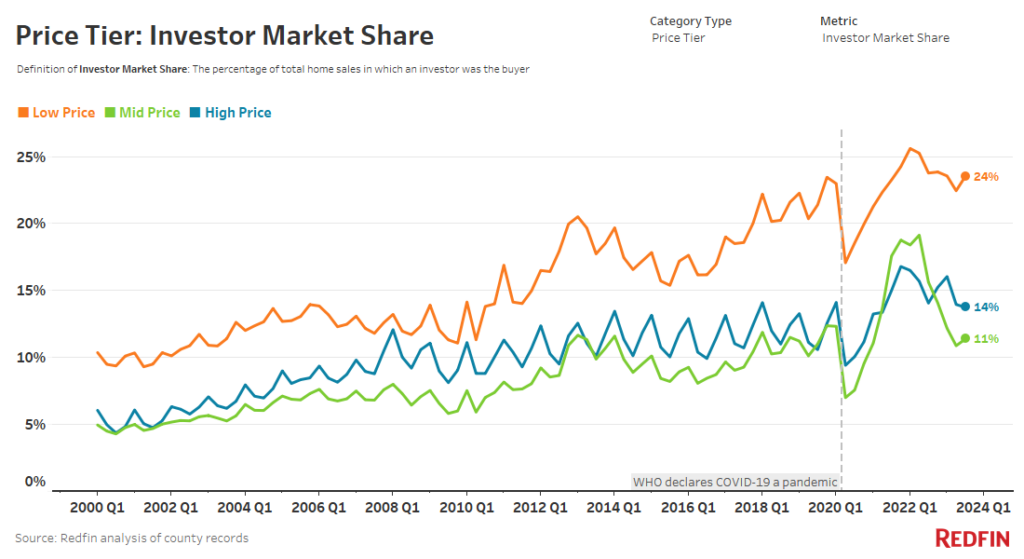
Investors are drawn to affordable homes for the same reason as other homebuyers: They cost less, which is especially attractive when home prices and borrowing costs remain elevated. And when housing affordability is this strained, there could be more potential for price increases in the lower price tier.
Low-priced homes made up 45.2% of investor purchases in the third quarter, up from 42.5% a year earlier. High-priced homes accounted for 30.8% (vs 27.6% a year earlier) and mid-priced homes made up 24% (vs 30% a year earlier).
Starter homes, which we define in this report as homes with 1,400 square feet or less, represented 38.9% of investor purchases in the third quarter, the highest share of any third quarter on record and down just slightly from the all-time high of 40.5% in the first quarter of 2023.
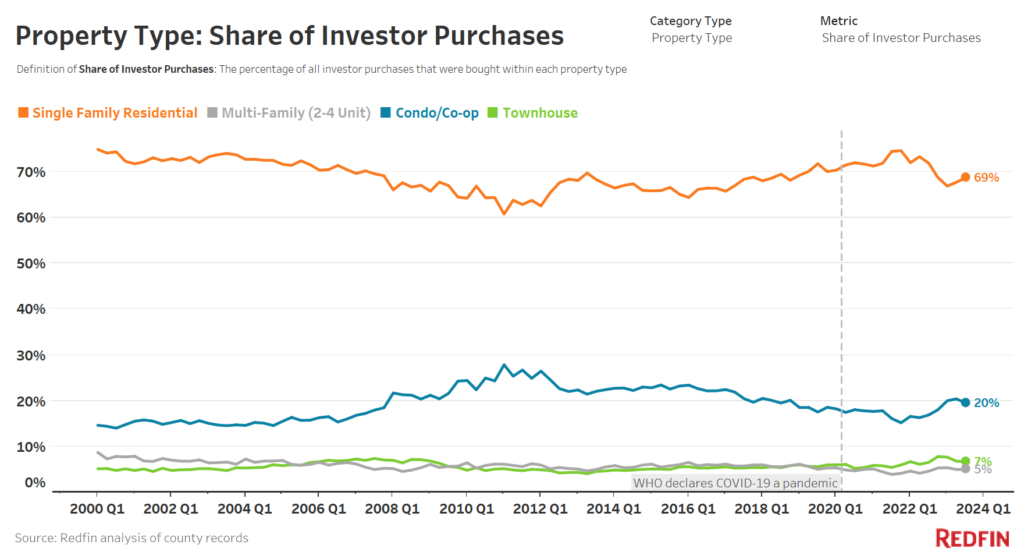
Single-Family Homes Made Up the Majority of Investor Purchases
Single-family homes represented 68.7% of investor purchases in the third quarter, down from 71.9% a year earlier. Next came condos, which accounted for 19.6%, up from 16.9% a year earlier. Townhouses and multi-family properties made up 6.7% and 5% of investor purchases, respectively, little changed from a year earlier.
Investors have the largest presence in the multifamily market. They purchased 30.1% of multi-family properties that sold in the third quarter, comparable with a year earlier. Investors have a relatively large market share in the multifamily segment because those buildings are typically too expensive and not feasible for regular homebuyers, and apartments offer the potential for large returns from rental income.
Investors bought 15.4% of single-family homes that sold in the third quarter, down from 17.7% a year earlier. They bought a respective 16.2% and 15.1% of condos and townhomes that sold—on par with last year.
Metro-Level Highlights: Investor Activity
The figures below cover the third quarter of 2023, unless otherwise noted. Changes are year over year.
Where investor purchases decreased most/least:
- Biggest decreases: Atlanta (-49.7%), Charlotte, NC (-49.6%), Jacksonville, FL (-48.2%)
- Smallest decreases: Montgomery County, PA (-0.7%), Sacramento, CA (-6.2%), Oakland, CA (-6.3%)
Where the share of homes bought by investors decreased/increased most:
- Biggest decreases: In Jacksonville, investors bought 19.6% of homes that sold, down 9.7 percentage points from a year earlier. Next came Atlanta (-9.5 ppts) and Charlotte (-8 ppts).
- Biggest increases: Oakland (2.5 ppts), Sacramento (2.4 ppts), Montgomery County (2.3 ppts).
Where investors bought the highest/lowest share of homes that sold:
- Highest share: In Miami, investors bought 30.5% of homes that sold. Next came San Diego (22.2%) and Anaheim, CA (22%).
- Lowest share: Providence, RI (8.2%), Warren, MI (8.5%), Washington, D.C. (8.6%).
Where investors owned the highest/lowest share of listings (September 2023):
- Highest share: In Miami, investors owned 13.2% of new listings. Next came San Diego (12.9%) and Detroit (12%).
- Lowest share: Providence (3.4%), Montgomery County (4.2%), Seattle (4.5%).
Where investors had the highest/lowest capital gain percentages (September 2023):
- Highest gains: In Philadelphia, the typical home sold by an investor sold for 113.6% more than the investor originally purchased it for. Next came Newark, NJ (103%) and Warren (95.9%).
- Lowest gains: San Francisco (31.6%), Sacramento (40.5%), Anaheim (45.8%).
Where investors were most/least likely to sell at a loss (September 2023):
- Most likely: In Detroit, 23.6% of homes sold by investors sold for less than the investors bought them for. Next came San Francisco (13.1%) and San Jose, CA (10.7%).
- Least likely: West Palm Beach, FL (0.9%), Anaheim (1.2%), Miami (1.6%).
Metro Summary: Investor Home Purchases, Q3 2023
| U.S. metro area | Investor purchases, YoY change | Total value of homes bought by investors | Median purchase price of homes bought by investors | Share of purchased homes bought by investors | Share of purchased homes bought by investors, YoY change (ppts) |
|---|---|---|---|---|---|
| Anaheim, CA | -11.9% | $2,260,082,091 | $1,234,500 | 22.0% | 0.4 |
| Atlanta, GA | -49.7% | $1,346,396,584 | $267,000 | 18.7% | -9.5 |
| Baltimore, MD | -24.3% | $319,162,662 | $169,950 | 15.8% | 0.6 |
| Charlotte, NC | -49.6% | $554,580,103 | $288,000 | 17.6% | -8 |
| Chicago, IL | -22.5% | $835,073,015 | $260,000 | 11.2% | -0.3 |
| Cincinnati, OH | -18.5% | $249,185,284 | $173,453 | 17.5% | 0.7 |
| Cleveland, OH | -19.3% | $211,198,693 | $110,000 | 19.5% | 1.6 |
| Columbus, OH | -35.1% | $245,401,137 | $215,000 | 12.8% | -3.3 |
| Denver, CO | -27.3% | $970,806,705 | $520,000 | 14.5% | -0.5 |
| Detroit, MI | -8.7% | $114,246,158 | $87,000 | 17.4% | 0.7 |
| Fort Lauderdale, FL | -19.1% | $836,653,202 | $355,000 | 19.5% | -1.1 |
| Jacksonville, FL | -48.2% | $423,082,533 | $269,950 | 19.6% | -9.7 |
| Las Vegas, NV | -43.3% | $774,143,994 | $400,000 | 21.5% | -5.9 |
| Los Angeles, CA | -14.7% | $4,479,504,000 | $1,020,000 | 20.0% | 0.3 |
| Miami, FL | -14.0% | $1,999,765,266 | $480,000 | 30.5% | -0.7 |
| Milwaukee, WI | -15.1% | $199,374,000 | $170,000 | 13.0% | 0.6 |
| Minneapolis, MN | -28.6% | $511,832,121 | $295,000 | 9.0% | -1.2 |
| Montgomery County, PA | -0.7% | $226,718,555 | $300,000 | 9.5% | 2.3 |
| Nashville, TN | -39.5% | $588,405,453 | $376,000 | 16.7% | -4.5 |
| New Brunswick, NJ | -12.1% | $573,229,143 | $410,000 | 10.5% | 1.1 |
| New York, NY | -32.5% | $3,543,101,011 | $825,000 | 17.2% | 1.9 |
| Newark, NJ | -17.2% | $365,863,401 | $410,000 | 12.1% | 1.7 |
| Oakland, CA | -6.3% | $1,172,644,000 | $1,086,000 | 16.3% | 2.5 |
| Orlando, FL | -42.6% | $713,303,124 | $310,500 | 19.1% | -7.4 |
| Philadelphia, PA | -24.0% | $186,433,961 | $128,000 | 16.7% | -0.1 |
| Phoenix, AZ | -47.4% | $1,599,581,087 | $399,900 | 18.9% | -7.7 |
| Portland, OR | -22.6% | $416,007,057 | $572,213 | 11.4% | 0.2 |
| Providence, RI | -23.3% | $114,895,086 | $323,000 | 8.2% | 0.8 |
| Riverside, CA | -16.6% | $1,116,341,182 | $542,250 | 18.2% | 1.6 |
| Sacramento, CA | -6.2% | $912,496,500 | $599,000 | 19.0% | 2.4 |
| San Diego, CA | -11.0% | $2,000,092,500 | $1,050,000 | 22.2% | 1.4 |
| San Francisco, CA | -18.5% | $1,354,500,809 | $1,700,000 | 20.8% | -0.6 |
| San Jose, CA | -8.3% | $1,065,494,009 | $1,678,000 | 16.5% | 1.2 |
| Seattle, WA | -31.6% | $618,431,094 | $868,250 | 8.8% | -1.3 |
| Tampa, FL | -41.3% | $885,599,831 | $300,000 | 17.9% | -6.1 |
| Virginia Beach, VA | -21.3% | $181,665,374 | $190,000 | 11.2% | 0.8 |
| Warren, MI | -11.5% | $176,249,668 | $175,000 | 8.5% | 1 |
| Washington, D.C. | -22.1% | $707,336,642 | $450,000 | 8.6% | 0 |
| West Palm Beach, FL | -7.6% | $1,187,433,202 | $469,500 | 17.1% | -1.6 |
| National—U.S.A. | -29.7% | $36,036,310,237 | $475,115 | 15.9% | -1.7 |
Methodology
For this analysis, we looked at county sale records for homes purchased from January 2000 through September 2023. We define an investor as any buyer whose name includes at least one of the following keywords: LLC, Inc, Trust, Corp, Homes. We also define an investor as any buyer whose ownership code on a purchasing deed includes at least one of the following keywords: association, corporate trustee, company, joint venture, corporate trust. This data may include purchases made through family trusts for personal use.
We analyzed home sales in the 50 most populous metro areas, but only included 39 metros in this report due to non-disclosure of sale prices in some counties.
For the price-tier analysis, we looked at all home sales in a given year and sorted each sale into one of three buckets: low-priced, mid-priced or high-priced. Low-priced means a home’s sale price was in the bottom tercile of local sale prices, while mid-priced means it was in the middle tercile and high-priced means it was in the top tercile.


