The Redfin Housing Demand Index began the year strong at 130.5 in January, up 0.5 percent month over month. The seasonally adjusted number of buyers requesting home tours remained unchanged from December to January, while the number making offers increased 1.2 percent.
“Inventory has been deteriorating for more than two years, yet 2018 started off with buyer demand stronger than in any previous January we’ve measured,” said Redfin chief economist Nela Richardson. “Along with inventory declines, buyers contended with rising mortgage rates, an overhaul of the tax code and a jumpy stock market. However, strong local labor markets helped keep buyers enthusiastic about homeownership despite headwinds.”
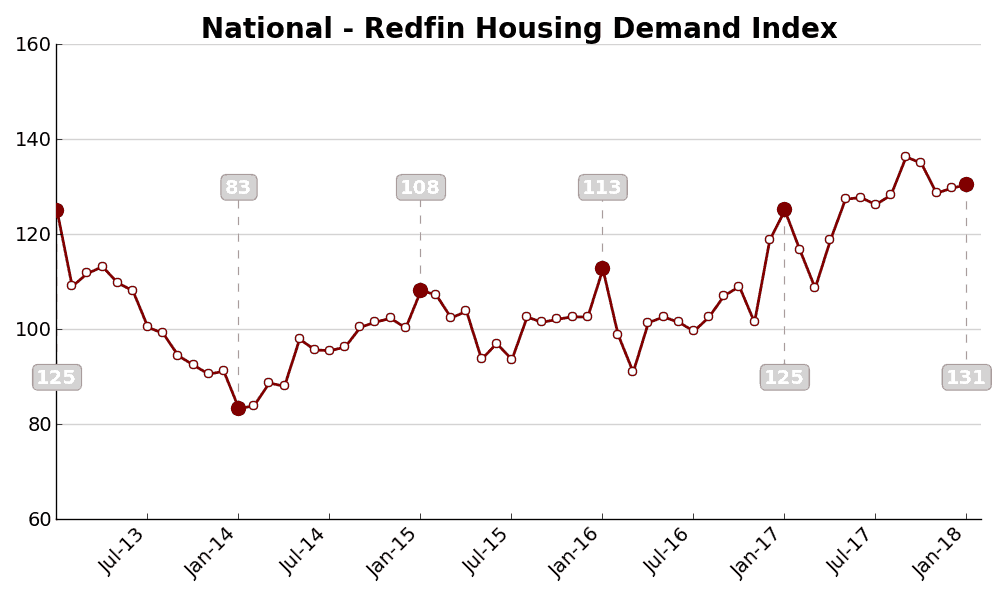
The Demand Index is based on thousands of Redfin customers requesting home tours and writing offers. The Demand Index is adjusted for Redfin’s market share growth. A level of 100 represents the historical average for the three-year period from January 2013 to December 2015.
Compared with January 2017, the Demand Index was up 4.8 percent and the number of buyers requesting tours was up 13.7 percent. Meanwhile, the number of buyers making offers slid 9.7 percent year over year.
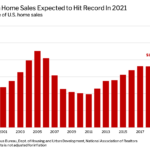
January offers and sales were heavily restrained by a 19.9 percent year-over-year decline in inventory, the largest since at least 2014, when we first began tracking the metric for the 15 markets included in the Demand Index. January marked the 32nd consecutive month of declining supply of homes.
Redfin agents report that the effects of the inventory shortage and strong demand are felt most acutely in affordable price ranges, with homes that do get listed selling within days and above asking price.
With mortgage rates and home prices expected to rise and nearly one in five homes already selling above list price in January, buyers contending for a diminishing supply of homes can expect a competitive season ahead.
Metro-Level Demand Highlights
Below, we provide a slideshow of local charts for each of the metros tracked by the Redfin Housing Demand Index and highlight noteworthy trends and agent insights from select markets. If you’d like to learn more about a particular market, please email press@redfin.com.