
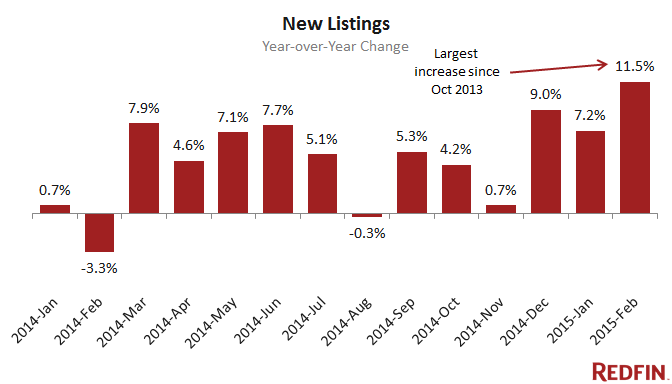
The housing market showed continued signs of strength last month, pointing toward a healthy spring season. In welcome news for buyers, newly listed homes shot up by 11.5 percent over last year, the largest increase since October 2013.
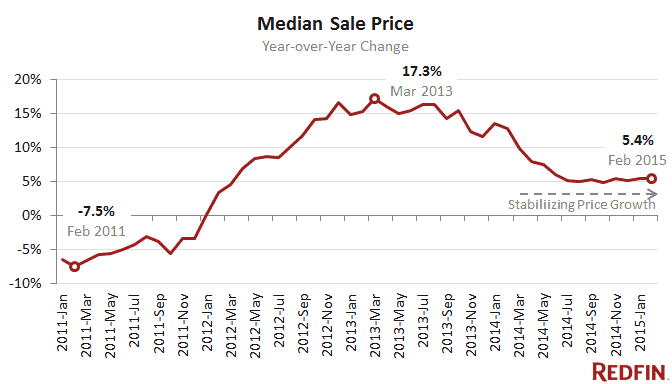
Across the 50 major metros that Redfin tracks, the number of homes sold increased 3.2 percent year over year. The median sale price increased 5.4 percent from February last year, to $258,300. For seven months now, price growth has remained steady at a level between 4.9 percent and 5.4 percent.
With more homes for sale, buyers can be choosier and less aggressive with their offers. In February, 16.4 percent of properties sold above asking price, down from 18.6 percent a year ago. The median difference in sale-to-list price was -3.5 percent compared to -3 percent a year ago. And the share of Redfin offers that encountered competition also dropped, by 1.6 percentage points to 58.2 percent. While that may sound like a small drop, it’s the 18th consecutive month that bidding wars have eased year over year.

Other February Highlights
Sales
- For the second month in a row, San Antonio took the lead in home sales increases, with a 25.7% jump from February 2014. San Antonio has posted double-digit growth in five of the past six months.
- Orlando and Tampa saw strong growth, at 23.1% and 21.6%, respectively.
New Listings
- Indianapolis had a surge in new listings, with 26.6% more homes listed for sale vs. last February.
- Boston saw a 23% drop in new listings vs. last year and a 10.9% decrease in overall inventory. According to Redfin agent Alex Coon, record-breaking snowfall is shifting Boston to a more traditional spring market that will pick up in April.
Prices
- The median sale price in Fort Lauderdale grew faster than in any other market, with an 18.4% increase since last year. The February median sale price in Fort Lauderdale was $189,250.
- Median sale prices declined year-over-year in 5 markets: Hudson Valley (-5.3%), Raleigh-Durham (-2.4%), Baltimore (-2.2%), Camden (-1.3%) and Philadelphia (-1.0%).
- In San Francisco, the median price was up 16.2% from last February to $979,750. At this rate, next month it will surpass $1 million.
Competition
- Denver saw the largest percentage point increase in the number of homes selling above asking price. Nearly 40% of homes sold above list, a 19.1 percentage point increase over last February.
- Nine out of 10 offers written by Redfin agents in Oakland, San Francisco and San Jose encountered competition from another buyer. Bidding wars increased 8.7 percentage points in Oakland, 4 percentage points in San Jose and 1.9 percentage points in San Francisco year over year.
- Denver remained the fastest market in the country, with half of homes selling in eight days or less.
Click here to download the latest Real-Time Market Tracker in an Excel spreadsheet.
Median Sale Price
| Metro | Median Sale Price | Month-over- Month |
Year-over- Year |
|---|---|---|---|
| Allentown, PA | $160,000 | 6.7% |
5.9%
|
| Atlanta, GA | $173,500 | 5.8% |
15.7%
|
| Austin, TX | $250,000 | 4.2% |
8.7%
|
| Baltimore, MD | $225,000 | 7.1% |
-2.2%
|
| Boston, MA | $325,000 | -5.5% |
8.3%
|
| Camden, NJ | $165,000 | -5.7% |
-1.3%
|
| Charlotte, NC | $187,000 | 9.8% |
8.9%
|
| Chicago, IL | $175,000 | 0.0% |
12.5%
|
| Dallas-Fort Worth, TX | $203,000 | 5.5% |
10.4%
|
| Denver, CO | $295,000 | 5.4% |
16.3%
|
| Fort Lauderdale, FL | $189,200 | 7.5% |
18.4%
|
| Fresno, CA | $206,700 | -1.6% |
9.1%
|
| Hampton Roads, VA | $200,000 | 7.7% |
8.1%
|
| Honolulu, HI | $495,000 | -7.5% |
7.1%
|
| Houston, TX | $200,000 | 3.5% |
8.1%
|
| Hudson Valley, NY | $372,000 | -3.4% |
-5.3%
|
| Indianapolis, IN | $135,800 | 4.5% |
6.1%
|
| Jacksonville, FL | $166,500 | 11.0% |
14.7%
|
| Las Vegas, NV | $189,000 | 2.2% |
8.0%
|
| Long Island, NY | $360,000 | -4.0% |
4.3%
|
| Los Angeles, CA | $480,000 | 2.1% |
8.4%
|
| Memphis, TN | $149,500 | 12.4% |
16.8%
|
| Miami, FL | $215,000 | -2.3% |
10.3%
|
| Minneapolis-St. Paul, MN | $200,000 | 2.6% |
9.3%
|
| Nashville, TN | $207,000 | -2.1% |
8.9%
|
| Oakland, CA | $499,400 | 1.9% |
8.6%
|
| Omaha, NE | $150,000 | -0.3% |
1.7%
|
| Orange County, CA | $555,000 | 1.8% |
2.8%
|
| Orlando, FL | $165,600 | 3.5% |
3.5%
|
| Philadelphia, PA | $200,000 | -8.3% |
-1.0%
|
| Phoenix, AZ | $200,000 | 1.1% |
7.8%
|
| Portland, OR | $274,800 | 2.2% |
3.7%
|
| Providence, RI | $181,000 | -6.2% |
6.9%
|
| Raleigh-Durham, NC | $207,000 | 0.5% |
-2.4%
|
| Reno, NV | $250,000 | 2.0% |
14.2%
|
| Richmond, VA | $199,700 | 6.4% |
11.6%
|
| Riverside-San Bernardino, CA | $286,000 | 4.8% |
6.9%
|
| Sacramento, CA | $310,000 | 12.7% |
12.7%
|
| San Antonio, TX | $187,900 | 4.9% |
11.8%
|
| San Diego, CA | $442,500 | -1.0% |
7.9%
|
| San Francisco, CA | $979,800 | 11.3% |
16.2%
|
| San Jose, CA | $842,000 | 14.4% |
17.1%
|
| Seattle, WA | $360,000 | -0.7% |
2.9%
|
| Tacoma, WA | $237,400 | 7.9% |
8.9%
|
| Tampa, FL | $148,000 | 8.0% |
9.6%
|
| Tucson, AZ | $169,900 | 3.3% |
3.0%
|
| Ventura County, CA | $485,000 | -1.0% |
9.0%
|
| Washington, DC | $350,000 | 1.7% |
2.9%
|
| West Palm Beach, FL | $200,000 | 0.0% |
5.3%
|
| Wilmington, DE | $197,500 | 4.0% |
7.9%
|
| Overall | $258,300 | 0.8% |
5.4%
|
Median List Price
| Metro | Median List Price | Month-over- Month |
Year-over- Year |
|---|---|---|---|
| Allentown, PA | $ 179,900 | 1.4% |
3.4%
|
| Atlanta, GA | $ 199,900 | 5.2% |
8.1%
|
| Austin, TX | $ 298,000 | 7.9% |
14.8%
|
| Baltimore, MD | $ 259,900 | 4.1% |
4.0%
|
| Boston, MA | $ 353,500 | 4.0% |
-1.5%
|
| Camden, NJ | $ 194,900 | 8.3% |
7.1%
|
| Chicago, IL | $ 250,000 | 9.2% |
8.7%
|
| Dallas-Fort Worth, TX | $ 225,000 | 2.3% |
12.8%
|
| Denver, CO | $ 325,000 | 3.2% |
9.2%
|
| Fort Lauderdale, FL | $ 260,000 | -13.3% |
0.0%
|
| Fresno, CA | $ 225,000 | 4.7% |
11.9%
|
| Hampton Roads, VA | $ 229,900 | 2.2% |
9.5%
|
| Honolulu, HI | $ 525,000 | -0.8% |
4.0%
|
| Houston, TX | $ 252,900 | 2.0% |
18.8%
|
| Hudson Valley, NY | $ 499,900 | 8.7% |
17.8%
|
| Indianapolis, IN | $ 139,900 | 0.0% |
-6.1%
|
| Jacksonville, FL | $ 200,000 | 5.3% |
14.4%
|
| Las Vegas, NV | $ 210,000 | 2.5% |
11.2%
|
| Long Island, NY | $ 415,000 | 1.2% |
5.2%
|
| Los Angeles, CA | $ 509,900 | 2.2% |
6.5%
|
| Memphis, TN | $ 149,900 | 7.1% |
7.8%
|
| Miami, FL | $ 310,000 | 6.9% |
16.3%
|
| Nashville, TN | $ 270,900 | 5.8% |
14.8%
|
| Oakland, CA | $ 558,000 | 10.5% |
11.8%
|
| Omaha, NE | $ 175,000 | 0.0% |
13.3%
|
| Orange County, CA | $ 625,000 | 2.6% |
4.3%
|
| Orlando, FL | $ 195,000 | 0.0% |
11.4%
|
| Philadelphia, PA | $ 250,000 | 11.2% |
8.7%
|
| Phoenix, AZ | $ 230,000 | -0.9% |
6.5%
|
| Portland, OR | $ 310,000 | 3.4% |
8.9%
|
| Providence, RI | $ 212,000 | -3.4% |
-3.2%
|
| Raleigh-Durham, NC | $ 249,900 | 4.6% |
8.7%
|
| Reno, NV | $ 277,000 | 7.4% |
15.9%
|
| Richmond, VA | $ 234,000 | 6.4% |
17.0%
|
| Riverside-San Bernardino, CA | $ 310,000 | 0.0% |
6.9%
|
| Sacramento, CA | $ 449,000 | 13.8% |
-3.2%
|
| San Antonio, TX | $ 219,000 | 7.9% |
15.3%
|
| San Diego, CA | $ 499,000 | 1.9% |
6.4%
|
| San Francisco, CA | $ 899,000 | 0.0% |
5.9%
|
| San Jose, CA | $ 797,900 | 7.3% |
14.0%
|
| Seattle, WA | $ 406,300 | 6.9% |
12.9%
|
| Tacoma, WA | $ 257,500 | 3.0% |
12.0%
|
| Tampa, FL | $ 179,900 | 2.1% |
17.2%
|
| Tucson, AZ | $ 199,900 | 0.0% |
2.5%
|
| Ventura County, CA | $ 549,000 | 4.6% |
5.6%
|
| Washington, DC | $ 400,000 | 8.1% |
4.0%
|
| West Palm Beach, FL | $ 264,900 | 8.1% |
12.7%
|
| Wilmington, DE | $ 219,900 | 10.0% |
10.0%
|
| Overall | $302,600 | 5.2% |
7.1%
|
Homes Sold
| Metro | Homes Sold | Month-over- Month |
Year-over- Year |
|---|---|---|---|
| Allentown, PA | 351 | -9.8% |
7.7%
|
| Atlanta, GA | 4,463 | 17.0% |
7.3%
|
| Austin, TX | 1,783 | 17.5% |
0.1%
|
| Baltimore, MD | 1,988 | 3.3% |
21.4%
|
| Boston, MA | 2,478 | -18.3% |
-1.6%
|
| Camden, NJ | 711 | -2.7% |
15.4%
|
| Charlotte, NC | 1,715 | -0.8% |
11.7%
|
| Chicago, IL | 5,653 | -1.2% |
-0.4%
|
| Dallas-Fort Worth, TX | 5,113 | 16.7% |
-5.2%
|
| Denver, CO | 2,953 | 16.7% |
0.8%
|
| Fort Lauderdale, FL | 2,176 | -2.4% |
2.3%
|
| Fresno, CA | 528 | 6.9% |
0.2%
|
| Hampton Roads, VA | 1,188 | 5.3% |
-0.8%
|
| Honolulu, HI | 358 | -31.3% |
-26.6%
|
| Houston, TX | 4,438 | 11.0% |
-7.6%
|
| Hudson Valley, NY | 648 | -9.5% |
11.3%
|
| Indianapolis, IN | 1,631 | 11.7% |
8.8%
|
| Jacksonville, FL | 1,463 | 11.6% |
-1.4%
|
| Las Vegas, NV | 2,393 | 8.2% |
-3.2%
|
| Long Island, NY | 1,350 | -9.7% |
0.9%
|
| Los Angeles, CA | 3,807 | -2.7% |
-3.8%
|
| Memphis, TN | 725 | 13.1% |
-10.3%
|
| Miami, FL | 2,362 | -6.4% |
13.4%
|
| Minneapolis-St. Paul, MN | 2,609 | 10.4% |
3.7%
|
| Nashville, TN | 1,643 | 5.3% |
9.5%
|
| Oakland, CA | 1,420 | -6.3% |
-1.9%
|
| Omaha, NE | 661 | 0.8% |
-4.9%
|
| Orange County, CA | 1,747 | 3.3% |
-0.1%
|
| Orlando, FL | 2,913 | 17.6% |
23.1%
|
| Philadelphia, PA | 2,266 | -3.3% |
19.1%
|
| Phoenix, AZ | 5,603 | 22.7% |
6.6%
|
| Portland, OR | 2,114 | 8.5% |
8.1%
|
| Providence, RI | 455 | -17.6% |
6.6%
|
| Raleigh-Durham, NC | 1,615 | 5.6% |
8.8%
|
| Reno, NV | 453 | 8.6% |
0.2%
|
| Richmond, VA | 887 | 8.0% |
18.9%
|
| Riverside-San Bernardino, CA | 3,266 | -0.8% |
-3.3%
|
| Sacramento, CA | 1,861 | 17.1% |
7.9%
|
| San Antonio, TX | 1,642 | 18.1% |
25.7%
|
| San Diego, CA | 2,203 | 15.2% |
-1.0%
|
| San Francisco, CA | 763 | 12.0% |
-22.6%
|
| San Jose, CA | 741 | -8.0% |
-31.9%
|
| Seattle, WA | 2,505 | 14.1% |
4.0%
|
| Tacoma, WA | 776 | 9.0% |
9.3%
|
| Tampa, FL | 3,978 | 22.6% |
21.6%
|
| Tucson, AZ | 873 | 16.1% |
-4.9%
|
| Ventura County, CA | 464 | -4.7% |
9.7%
|
| Washington, DC | 4,242 | 2.8% |
1.8%
|
| West Palm Beach, FL | 2,228 | 10.7% |
5.0%
|
| Wilmington, DE | 412 | -5.7% |
15.7%
|
| Overall | 100,615 | 6.5% |
3.2%
|
New Listings
| Metro | New Listings | Month-over- Month |
Year-over- Year |
|---|---|---|---|
| Allentown, PA | 760 | -9.8% |
22.6%
|
| Atlanta, GA | 7,994 | -4.0% |
10.9%
|
| Austin, TX | 2,679 | 9.7% |
3.5%
|
| Baltimore, MD | 3,642 | 0.2% |
10.8%
|
| Boston, MA | 4,086 | -16.8% |
-23.0%
|
| Camden, NJ | 1,960 | 1.5% |
16.8%
|
| Chicago, IL | 13,291 | 4.6% |
9.2%
|
| Dallas-Fort Worth, TX | 7,569 | 0.4% |
-4.3%
|
| Denver, CO | 4,131 | 12.6% |
5.1%
|
| Fort Lauderdale, FL | 1,324 | -7.7% |
12.1%
|
| Fresno, CA | 890 | -8.4% |
9.3%
|
| Hampton Roads, VA | 2,329 | -21.7% |
-3.4%
|
| Honolulu, HI | 1,011 | -5.1% |
15.9%
|
| Houston, TX | 8,235 | 0.1% |
13.1%
|
| Hudson Valley, NY | 1,390 | 0.4% |
-1.2%
|
| Indianapolis, IN | 2,938 | 6.3% |
26.6%
|
| Jacksonville, FL | 2,532 | -5.7% |
3.2%
|
| Las Vegas, NV | 4,060 | -5.6% |
3.3%
|
| Long Island, NY | 2,675 | -14.3% |
-3.7%
|
| Los Angeles, CA | 7,839 | -1.0% |
11.9%
|
| Memphis, TN | 1,166 | -9.8% |
23.9%
|
| Miami, FL | 2,155 | -9.6% |
5.7%
|
| Nashville, TN | 2,694 | -18.0% |
-12.3%
|
| Oakland, CA | 2,447 | 18.0% |
0.9%
|
| Omaha, NE | 1,255 | -1.6% |
1.8%
|
| Orange County, CA | 3,619 | 6.0% |
14.5%
|
| Orlando, FL | 4,565 | -5.9% |
7.3%
|
| Philadelphia, PA | 4,994 | 4.2% |
23.5%
|
| Phoenix, AZ | 8,945 | -10.9% |
-5.0%
|
| Portland, OR | 3,579 | 4.5% |
20.7%
|
| Providence, RI | 777 | -25.4% |
-20.9%
|
| Reno, NV | 595 | 15.8% |
-6.9%
|
| Richmond, VA | 1,687 | -11.2% |
7.9%
|
| Riverside-San Bernardino, CA | 7,189 | 0.5% |
22.2%
|
| Sacramento, CA | 165 | 11.5% |
5.8%
|
| San Antonio, TX | 2,614 | 13.5% |
17.9%
|
| San Diego, CA | 3,900 | -5.3% |
-0.0%
|
| San Francisco, CA | 1,325 | 24.6% |
-6.7%
|
| San Jose, CA | 1,413 | 29.2% |
0.4%
|
| Seattle, WA | 4,006 | 13.8% |
11.2%
|
| Tacoma, WA | 1,202 | 1.7% |
4.0%
|
| Tampa, FL | 6,137 | -2.5% |
9.5%
|
| Tucson, AZ | 1,797 | -13.5% |
3.3%
|
| Ventura County, CA | 923 | -5.5% |
2.2%
|
| Washington, DC | 7,841 | 10.8% |
7.4%
|
| West Palm Beach, FL | 4,004 | -13.8% |
4.8%
|
| Wilmington, DE | 846 | 7.6% |
10.2%
|
| Overall | 171,394 | -0.8% |
11.5%
|
Inventory
| Metro | Inventory | Month-over- Month |
Year-over- Year |
|---|---|---|---|
| Allentown, PA | 4,500 | 0.1% |
-7.5%
|
| Atlanta, GA | 32,700 | -1.8% |
-4.1%
|
| Austin, TX | 7,700 | 0.0% |
-3.0%
|
| Baltimore, MD | 17,000 | -3.0% |
14.3%
|
| Boston, MA | 19,700 | -9.0% |
-10.9%
|
| Camden, NJ | 10,600 | 1.0% |
-0.5%
|
| Chicago, IL | 56,600 | 5.7% |
6.1%
|
| Dallas-Fort Worth, TX | 22,600 | -0.5% |
-21.7%
|
| Denver, CO | 6,700 | 5.2% |
-17.1%
|
| Fresno, CA | 2,700 | -2.9% |
22.2%
|
| Hampton Roads, VA | 11,700 | 0.4% |
5.5%
|
| Honolulu, HI | 3,900 | -20.4% |
-17.4%
|
| Houston, TX | 24,300 | 2.4% |
-2.8%
|
| Indianapolis, IN | 19,400 | 4.4% |
0.5%
|
| Jacksonville, FL | 10,300 | -1.2% |
-27.6%
|
| Las Vegas, NV | 18,900 | 2.2% |
-4.3%
|
| Long Island, NY | 16,800 | -0.7% |
1.4%
|
| Los Angeles, CA | 19,900 | 3.9% |
10.3%
|
| Memphis, TN | 5,900 | -0.6% |
61.9%
|
| Miami, FL | 12,600 | 0.9% |
-0.5%
|
| Minneapolis-St. Paul, MN | 20,400 | 2.6% |
-5.9%
|
| Nashville, TN | 14,700 | -0.8% |
-5.4%
|
| Oakland, CA | 3,700 | 1.5% |
-16.9%
|
| Omaha, NE | 4,000 | -5.6% |
-18.9%
|
| Orange County, CA | 7,600 | 12.6% |
31.0%
|
| Orlando, FL | 22,700 | -9.7% |
-16.9%
|
| Philadelphia, PA | 24,900 | -0.8% |
3.8%
|
| Phoenix, AZ | 33,500 | 1.3% |
-9.2%
|
| Portland, OR | 9,300 | -3.5% |
-21.1%
|
| Providence, RI | 4,900 | -2.7% |
0.7%
|
| Reno, NV | 2,200 | 10.6% |
5.8%
|
| Richmond, VA | 6,400 | -2.9% |
8.1%
|
| Riverside-San Bernardino, CA | 27,600 | 4.2% |
24.0%
|
| San Antonio, TX | 11,500 | 1.3% |
10.9%
|
| San Diego, CA | 9,100 | -1.7% |
-5.9%
|
| San Francisco, CA | 2,100 | 4.4% |
-7.3%
|
| San Jose, CA | 2,500 | -8.1% |
23.5%
|
| Seattle, WA | 8,100 | -3.3% |
-24.0%
|
| Tacoma, WA | 4,500 | -4.9% |
-22.0%
|
| Tampa, FL | 29,200 | 0.1% |
-15.1%
|
| Tucson, AZ | 8,900 | 6.9% |
7.7%
|
| Ventura County, CA | 2,200 | -1.0% |
1.7%
|
| Washington, DC | 22,600 | 0.2% |
8.1%
|
| West Palm Beach, FL | 17,900 | 3.1% |
1.3%
|
| Wilmington, DE | 4,800 | -2.5% |
-2.3%
|
| Overall | 652,600 | 0.4% |
0.6%
|


