The share of million-dollar-plus homes is on the upswing after dropping to a 12-month low in February. That’s because scarce inventory is driving up prices, pushing many homes on the cusp over the seven-figure mark.
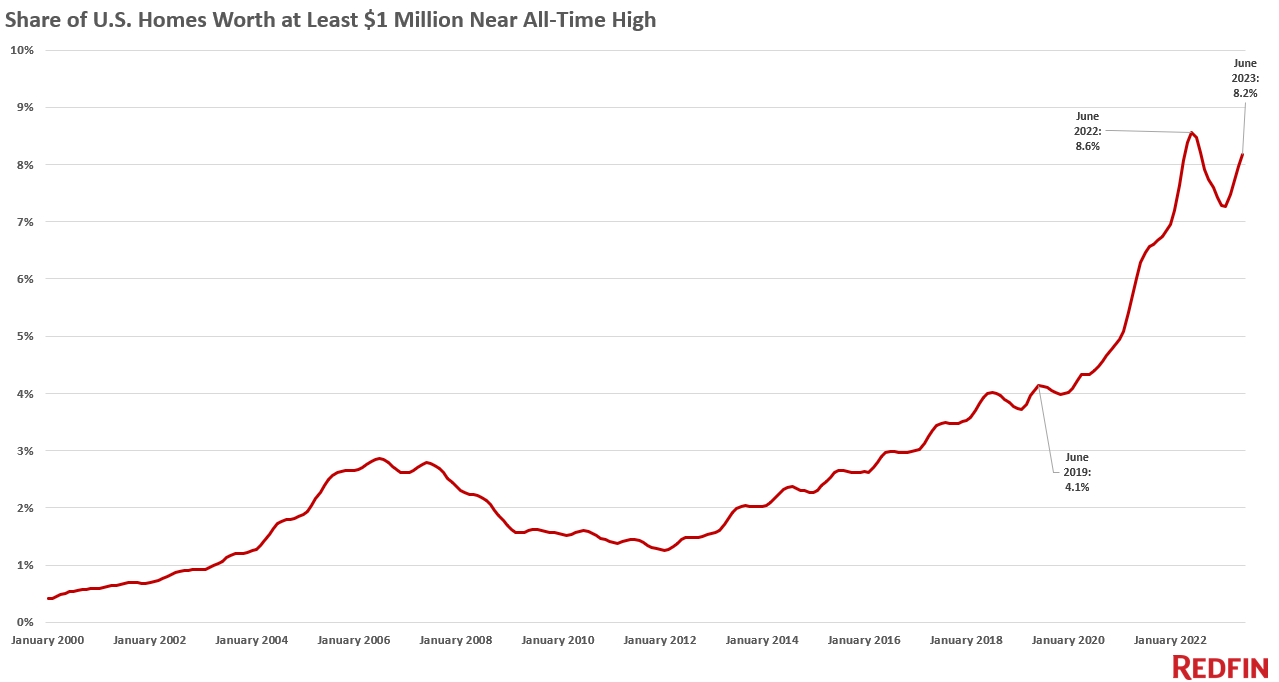
Just over 8% of U.S. homes are worth $1 million or more, near June 2022’s all-time high of 8.6%.
This analysis estimated current home values using the Redfin Estimate, public records and MLS data, and past home values using public records and MLS data. The figures in this report represent June 2023, unless otherwise noted. See the end of this report for a detailed methodology.
The share of homes worth seven figures is on the upswing after dipping to a 12-month low of 7.3% in February. That’s because home prices are rising on a year-over-year basis after falling at the beginning of the year. The median U.S. home-sale price rose 3% in July, the biggest increase since last November. Prices are rising faster for high-end homes, with the median sale price of U.S. luxury homes up 4.6% year over year to $1.2 million in the second quarter.
Today’s elevated mortgage rates are discouraging potential home sellers, with homeowners staying put to keep their relatively low mortgage rates. Inventory is so low that even though many buyers are sidelined by high rates, those who are in the market are competing for the few homes for sale. That’s driving home prices up and pushing many of those on the cusp above the million-dollar mark.
“The supply shortage is making many listings feel hot,” said Redfin Economics Research Lead Chen Zhao. “In most of the country, expensive properties that are in good condition and priced fairly are attracting buyers and in some cases bidding wars, mostly because for-sale signs are few and far between right now.”
“Still, there’s no rush to offload high-value homes,” Zhao continued. “Recent economic signals that the U.S. may avoid a broad recession could cause high-end buyers to feel more confident in making a major purchase in the coming months. There may be more demand coming down the pipeline.”
For homebuyers, the uptick in homes worth seven figures illustrates ongoing challenges with housing affordability in the U.S. And for buyers using loans, monthly payments on million-dollar homes are even more expensive than they were a year ago. A buyer purchasing a $1 million home would have a monthly mortgage payment of $6,604 with June’s average 6.7% mortgage rate, up from $5,984 with last June’s typical rate of around 5.5%.
The share of homes worth seven figures has doubled since before the pandemic; just over 4% of homes were valued at $1 million or more in June 2019. The share has shot up because home prices skyrocketed in 2020 and 2021 as record-low mortgage rates and remote work drove Americans to buy homes.
East Coast metros are gaining seven-figure homes fastest
Parts of New England are gaining million-dollar homes fastest. Just over one-quarter (25.8%) of homes in the Bridgeport, CT metro–which is made up of many popular New York City suburbs–are worth at least $1 million, up from 23.1% a year ago, the biggest increase of the metros in this analysis. It’s followed by Boston, where the share increased from 20.3% to 21.5%, and Newark, NJ (8.7% to 9.7%).
All in all, the portion of homes worth $1 million or more is up year over year in 55 of the 99 most populous U.S. metros. But the uptick is small, less than one percentage point, in almost all of those.
The portion of million-dollar-plus homes is unchanged in three metros and down in the remaining 41.
Share of seven-figure homes is falling in pricey West Coast metros, but they still make up substantial portion of homes
Expensive coastal metros are losing million-dollar homes fastest. The share dropped from 39.3% to 33% over the last year in Seattle, the biggest decline of the metros in this analysis. It’s followed by Oakland, CA (55.1% to 49%) and Oxnard, CA (40.2% to 34.5%). Los Angeles, San Diego, San Jose, San Francisco, Anaheim, New York and Washington, D.C. are also among the metros where the share fell.
Pricey parts of the country, especially along the West Coast, have seen outsized drops in their portion of million-dollar homes because those markets cooled more than others. Rising mortgage rates and the faltering tech economy deterred homebuyers in many of those places over the last year, though they are now starting to bounce back as buyers get used to elevated rates and the economy smooths out.
California has the highest share of million-dollar-plus homes in the country, by far. First is San Francisco, where 81.2% of homes are worth at least $1 million, down from 84.2% a year earlier. It’s followed closely by San Jose (79.6%, down from 82.9%). Next come Anaheim, Oakland, San Diego and Los Angeles, all places where the share of seven-figure homes has fallen a bit over the last year, but where roughly 40% to 50% of all are still worth at least $1 million.
Million-dollar homes are virtually nonexistent in some parts of Texas and the Rust Belt
There are essentially no million-dollar homes in several inexpensive metros, including parts of Texas and upstate New York.
The share of homes worth $1 million or more is 0.5% or lower in Omaha, NE; Dayton, OH; McAllen, TX; El Paso, TX; Akron, OH; Detroit; Buffalo, NY; Elgin, IL and Rochester, NY.
| Metro-level summary: Share of homes worth at least $1 million, June 2023
Sorted by biggest increase to biggest decline in share of homes worth $1 million or more |
|||
| U.S. metro area | Share of homes worth at least $1 million, YoY change (percentage points) | Share of homes worth at least $1 million, June 2023 | Share of homes worth at least $1 million, June 2022 |
| Bridgeport, CT | 2.74 pp | 25.8% | 23.1% |
| Boston, MA | 1.18 pp | 21.5% | 20.3% |
| Newark, NJ | 1.02 pp | 9.7% | 8.7% |
| Miami, FL | 0.97 pp | 14.3% | 13.3% |
| Montgomery County, PA | 0.88 pp | 5.0% | 4.1% |
| New Brunswick, NJ | 0.84 pp | 10.2% | 9.4% |
| Nassau County, NY | 0.73 pp | 16.1% | 15.4% |
| Charleston, SC | 0.73 pp | 11.8% | 11.1% |
| Worcester, MA | 0.66 pp | 2.5% | 1.9% |
| Fort Lauderdale, FL | 0.54 pp | 7.4% | 6.8% |
| Providence, RI | 0.50 pp | 2.5% | 2.0% |
| Knoxville, TN | 0.46 pp | 2.9% | 2.4% |
| New Haven, CT | 0.39 pp | 2.4% | 2.0% |
| Hartford, CT | 0.38 pp | 1.6% | 1.2% |
| West Palm Beach, FL | 0.36 pp | 13.5% | 13.1% |
| Virginia Beach, VA | 0.36 pp | 2.7% | 2.3% |
| Frederick, MD | 0.32 pp | 13.9% | 13.5% |
| Richmond, VA | 0.31 pp | 2.2% | 1.9% |
| Milwaukee, WI | 0.31 pp | 1.8% | 1.5% |
| Greenville, SC | 0.30 pp | 2.8% | 2.5% |
| Charlotte, NC | 0.29 pp | 4.4% | 4.1% |
| Wilmington, DE | 0.29 pp | 1.4% | 1.1% |
| Baltimore, MD | 0.27 pp | 3.5% | 3.3% |
| Atlanta, GA | 0.24 pp | 3.8% | 3.5% |
| Orlando, FL | 0.23 pp | 3.5% | 3.2% |
| Jacksonville, FL | 0.23 pp | 4.8% | 4.5% |
| Camden, NJ | 0.22 pp | 1.1% | 0.9% |
| Little Rock, AR | 0.20 pp | 1.0% | 0.8% |
| Greensboro, NC | 0.19 pp | 1.0% | 0.8% |
| Louisville, KY | 0.17 pp | 1.1% | 0.9% |
| Birmingham, AL | 0.16 pp | 1.3% | 1.1% |
| Cincinnati, OH | 0.15 pp | 1.2% | 1.1% |
| Warren, MI | 0.15 pp | 1.4% | 1.2% |
| Columbia, SC | 0.14 pp | 0.8% | 0.7% |
| Grand Rapids, MI | 0.14 pp | 1.6% | 1.4% |
| Columbus, OH | 0.13 pp | 1.2% | 1.1% |
| Tampa, FL | 0.13 pp | 5.2% | 5.0% |
| Des Moines, IA | 0.11 pp | 0.8% | 0.6% |
| Pittsburgh, PA | 0.10 pp | 0.9% | 0.8% |
| Kansas City, MO | 0.10 pp | 0.9% | 0.8% |
| St. Louis, MO | 0.10 pp | 1.2% | 1.1% |
| Tulsa, OK | 0.08 pp | 0.8% | 0.8% |
| Memphis, TN | 0.08 pp | 1.2% | 1.1% |
| Cleveland, OH | 0.07 pp | 0.7% | 0.6% |
| Allentown, PA | 0.07 pp | 0.7% | 0.7% |
| Philadelphia, PA | 0.06 pp | 2.5% | 2.5% |
| Detroit, MI | 0.06 pp | 0.4% | 0.4% |
| Akron, OH | 0.06 pp | 0.4% | 0.4% |
| Oklahoma City, OK | 0.05 pp | 0.8% | 0.8% |
| Dayton, OH | 0.04 pp | 0.2% | 0.2% |
| Nashville, TN | 0.03 pp | 8.2% | 8.2% |
| Omaha, NE | 0.02 pp | 0.2% | 0.1% |
| Albany, NY | 0.01 pp | 0.9% | 0.9% |
| Baton Rouge, LA | 0.01 pp | 0.8% | 0.8% |
| Rochester, NY | 0.01 pp | 0.5% | 0.5% |
| Buffalo, NY | 0.00 pp | 0.4% | 0.4% |
| Elgin, IL | 0.00 pp | 0.5% | 0.5% |
| Chicago, IL | -0.01 pp | 3.6% | 3.6% |
| McAllen, TX | -0.02 pp | 0.3% | 0.3% |
| Minneapolis, MN | -0.02 pp | 2.4% | 2.4% |
| Lake County, IL | -0.03 pp | 3.9% | 4.0% |
| El Paso, TX | -0.03 pp | 0.3% | 0.3% |
| Lakeland, FL | -0.03 pp | 0.7% | 0.8% |
| Bakersfield, CA | -0.08 pp | 0.8% | 0.9% |
| Indianapolis, IN | -0.10 pp | 4.4% | 4.5% |
| New Orleans, LA | -0.13 pp | 2.2% | 2.3% |
| Tucson, AZ | -0.17 pp | 3.0% | 3.2% |
| San Antonio, TX | -0.17 pp | 2.1% | 2.3% |
| Fresno, CA | -0.18 pp | 1.7% | 1.9% |
| Fort Worth, TX | -0.21 pp | 3.1% | 3.3% |
| Houston, TX | -0.24 pp | 3.5% | 3.7% |
| North Port, FL | -0.24 pp | 12.0% | 12.3% |
| Riverside, CA | -0.25 pp | 7.1% | 7.3% |
| Stockton, CA | -0.33 pp | 4.6% | 4.9% |
| Cape Coral, FL | -0.33 pp | 7.5% | 7.9% |
| Raleigh, NC | -0.34 pp | 5.4% | 5.8% |
| National | -0.38 pp | 8.2% | 8.6% |
| Dallas, TX | -0.42 pp | 5.9% | 6.3% |
| Washington, DC | -0.48 pp | 11.8% | 12.2% |
| New York, NY | -0.49 pp | 28.6% | 29.1% |
| Las Vegas, NV | -0.72 pp | 3.5% | 4.2% |
| Portland, OR | -0.77 pp | 6.7% | 7.5% |
| Boise City, ID | -0.94 pp | 5.6% | 6.5% |
| Colorado Springs, CO | -1.10 pp | 4.7% | 5.8% |
| Tacoma, WA | -1.32 pp | 6.9% | 8.3% |
| Denver, CO | -1.62 pp | 11.0% | 12.6% |
| Phoenix, AZ | -1.67 pp | 7.2% | 8.9% |
| Sacramento, CA | -1.70 pp | 8.8% | 10.5% |
| Anaheim, CA | -1.76 pp | 55.4% | 57.2% |
| San Francisco, CA | -3.04 pp | 81.2% | 84.2% |
| San Jose, CA | -3.25 pp | 79.6% | 82.9% |
| Honolulu, HI | -3.78 pp | 38.0% | 41.8% |
| San Diego, CA | -3.81 pp | 39.7% | 43.5% |
| Austin, TX | -4.30 pp | 10.6% | 14.9% |
| Los Angeles, CA | -5.15 pp | 38.1% | 43.2% |
| Oxnard, CA | -5.67 pp | 34.5% | 40.2% |
| Oakland, CA | -6.12 pp | 49.0% | 55.1% |
| Seattle, WA | -6.29 pp | 33.0% | 39.3% |
Methodology
This analysis estimated current (June 2023) home values using the Redfin Estimate, MLS data and public records. The Redfin Estimate covers more than 90 million single-family homes, condos, townhouses and multifamily properties, and is available in most but not all parts of the U.S. Historical values were imputed using public records and MLS data on price per square foot trends by zip code (or city, county, or state when zip-code data is insufficient). Both existing homes and new-construction homes are included in this dataset, which dates back to the year 2000. Homes are not added to the dataset until they are first built or sold.
The share of homes worth at least $1 million were calculated using these raw numbers: 7,463,930 U.S. homes were worth at least $1 million in June 2023, compared with 7,739,772 in June 2022.
Editor’s note: A previous version of this report included the Salt Lake City, UT metro area. Salt Lake City has been removed from the report because the data was erroneous.
 United States
 Canada