-
Luxury home prices in the Bay Area and Seattle fell between 10% and 13% in the second quarter—more than anywhere else in the country. Nationwide, luxury prices rose 5% from a year earlier.
-
Luxury home sales dropped 24%, the smallest decline in a year.
-
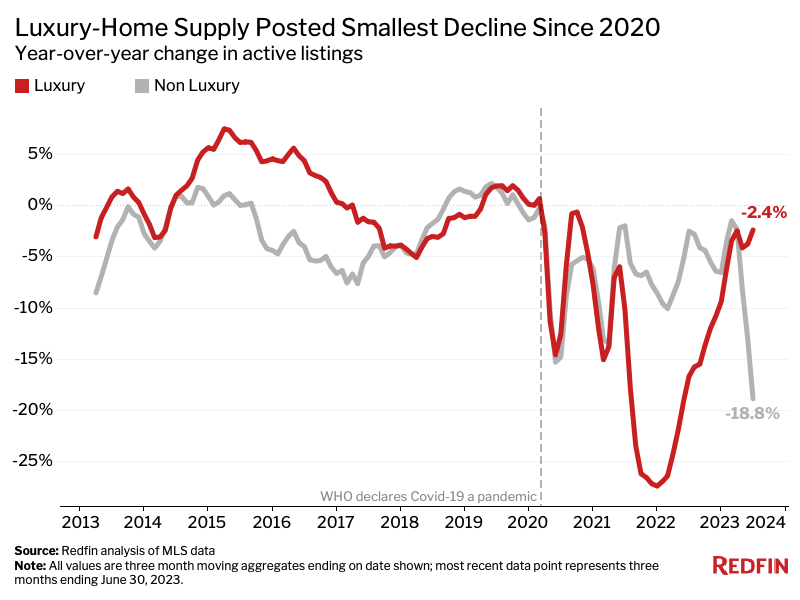
Non luxury listings declined roughly twice as much as luxury listings, as middle-income homeowners were handcuffed by high mortgage rates.
Luxury home prices in San Francisco are falling faster than anywhere else in the nation.
The median sale price of luxury homes in San Francisco fell a record 12.7% year over year to $4.8 million in the second quarter—the largest decline among the 50 most populous U.S. metropolitan areas. While $4.8 million may not sound like a bargain, it is compared with the $5.5 million record high hit a year earlier.
Three other pricey West Coast tech hubs also saw double-digit declines. In Seattle, luxury sale prices decreased a record 12.3% to $2.5 million—the second biggest drop in the country. Next came Oakland, CA (-11.1% to $2.8 million) and San Jose, CA (-10.3% to $4.3 million).
“Buyers are getting big discounts on high-end condos in San Francisco right now—especially those under 1,000 square feet,” said local Redfin Premier real estate agent Ali Mafi. “Those homes are having trouble selling, and some sellers are losing a lot of money.”
Nationwide, luxury sale prices are still higher than they were last year. The median sale price of luxury homes rose 4.6% year over year to a record $1.2 million in the second quarter. By comparison, the median sale price of non luxury homes climbed 1.5% to a record $340,000. While homebuyer demand has slowed across the board this year, prices are being propped up by a lack of inventory, which is fueling competition in many markets.
This is according to an analysis that divided all U.S. residential properties into tiers based on Redfin Estimates of the homes’ market values as of July 16, 2023. This report defines luxury homes as those estimated to be in the top 5% based on market value, and non luxury homes as those estimated to be in the 35th-65th percentile based on market value.
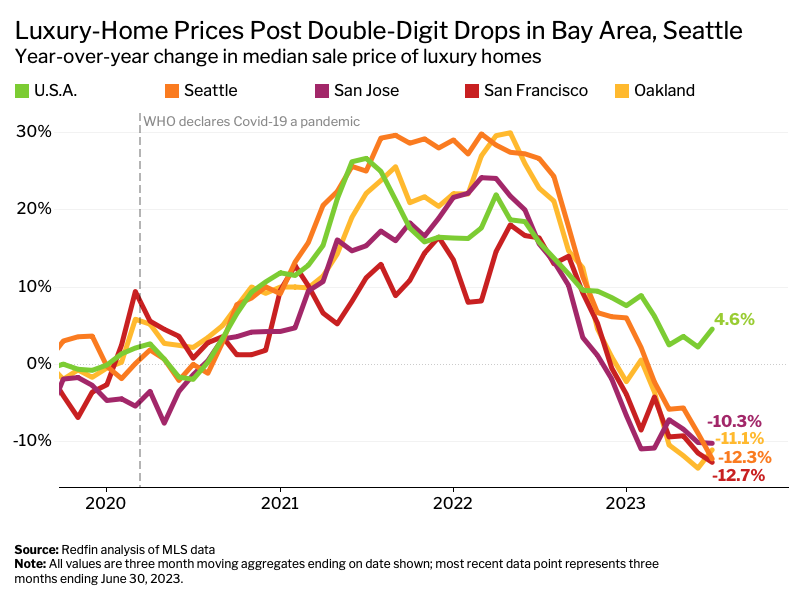
Luxury housing prices in expensive coastal areas have taken a relatively big hit because those markets were already among the most expensive in the nation, meaning prices had more room to fall. Additionally, tech hubs have been disproportionately impacted by stock-market declines and tech layoffs, which have diminished buying power for high-end house hunters. In San Francisco, increasing housing supply is also likely contributing to the drop in prices; the metro was one of just three that saw new listings rise in the second quarter.
But the stock market’s recent rally and easing recession worries, along with declining prices, may be starting to bolster high-end home purchases. Luxury sales in San Francisco fell just 4% year over year in the second quarter—a smaller drop than any other major metro—following more than a year of double-digit declines.
Relatively affordable East Coast markets experienced the largest price increases. In New Brunswick, NJ, the median sale price of luxury homes rose 12.1% year over year to $1.8 million—the largest increase among the 50 biggest metros. Next came Charlotte, NC (9.2%), Newark, NJ (9.2%), Orlando, FL (8.8%) and Virginia Beach, VA (7.8%).
Luxury Home Listings Fall Roughly Half as Fast as Non Luxury Listings
New listings of luxury homes fell 17.1% year over year in the second quarter, while those of non luxury homes plunged a record 29.8%.

“High mortgage rates are prompting many middle-income homeowners to stay put, but wealthy homeowners can often afford to move even if it means taking on a higher rate and monthly payment,” said Redfin Chief Economist Daryl Fairweather. “Wealthy buyers are also more likely to pay in cash, meaning they’re less likely to be deterred by elevated mortgage rates.”
Luxury listings are also holding up relatively well due to an increase in homebuilding. Newly built homes tend to be more expensive, meaning they often fall into the luxury tier. With so few people listing homes, builders are cashing in on being the only game in town.
Nationwide, the total number of luxury homes on the market fell just 2.4% in the second quarter, the smallest decline since 2020, while non luxury supply plunged a record 18.8%.
Luxury Home Sales Post Smallest Decline in a Year
Luxury home sales fell 24.1% year over year in the second quarter. While that’s a substantial decline, it’s the smallest in a year. Non luxury sales dropped 19.4%. The decrease in home sales has eased across the board as Americans have grown accustomed to high mortgage rates, bringing some buyers off the sidelines.
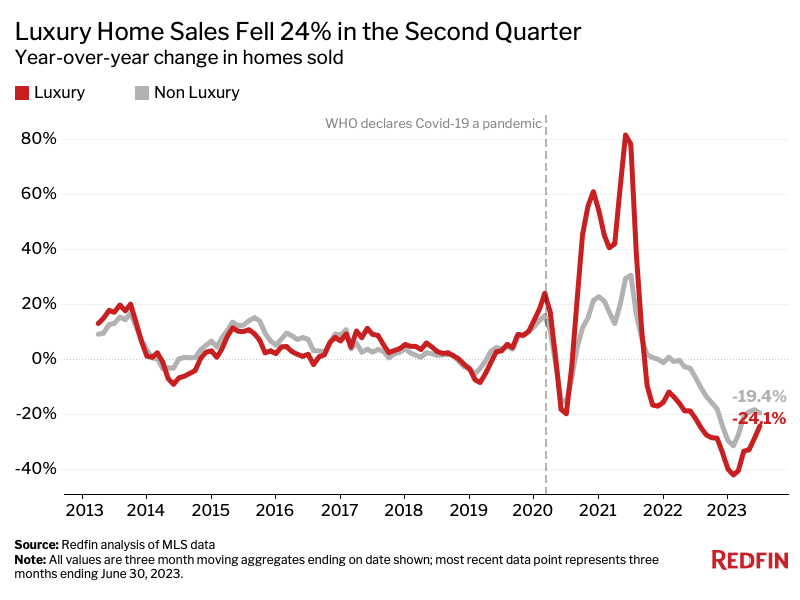
The gap between luxury and non luxury sales is shrinking; at the start of the year, luxury sales were down a record 42%, while non luxury sales were down just 31.4%.
Luxury sales have consistently declined more than non luxury sales over the last year because people tend to purchase fewer expensive goods during times of economic uncertainty, but the gap is likely narrowing in part due to an improving stock market and easing recession fears.
“Normally when the housing market is hurting, it’s the luxury market that’s hurting the most by far, but today’s market is unusual because there isn’t a recession,” Fairweather said. “While a lot of high-end homebuyers remain on the sidelines, many of the ones who are in the market are still willing to spend big.”
Metro-Level Luxury Market Highlights: Three Months Ending June 30, 2023
Redfin’s metro-level data includes the 50 most populous U.S. metropolitan areas.
- Prices: The median sale price of luxury homes fell most in San Francisco (-12.7% YoY), Seattle (-12.3%) and Oakland, CA (-11.1%). It rose most in New Brunswick, NJ (12.1%), Charlotte, NC (9.2%) and Newark, NJ (9.2%).
- Supply: Active listings of luxury homes fell most in Chicago (-26.4% YoY), Cincinnati (-26%) and Cleveland (-25.6%). They rose most in Austin, TX (53.2%), Nashville (28.4%) and Tampa, FL (21.5%).
- New listings: New listings of luxury homes fell most in Las Vegas (-36.2% YoY), Phoenix (-34.9%) and Detroit (-34.6%). They rose in just three metros: Austin (13.1%), San Francisco (4.5%) and Nashville (0.7%).
- Home sales: Luxury home sales fell most in Miami (-40.1% YoY), Nassau County, NY (-39.3%) and Los Angeles (-36.2%). They fell least in San Francisco (-4%), Tampa (-7.5%) and Fort Worth, TX (-9%).
Luxury Housing Market Summary by Metro Area: Three Months Ending June 30, 2023
| U.S. Metro Area | Median Sale Price | Median Sale Price, YoY Change | Active Listings, YoY Change | New Listings, YoY Change | Homes Sold, YoY Change | Median Days On Market |
| Anaheim, CA | $3,895,000 | 3.9% | -9.3% | -23.7% | -29.3% | 44 |
| Atlanta, GA | $1,202,000 | 6.8% | 9.7% | -12.8% | -24.5% | 23 |
| Austin, TX | $1,750,000 | -7.9% | 53.2% | 13.1% | -9.5% | 55 |
| Baltimore, MD | $1,075,000 | 2.4% | -17.0% | -31.4% | -19.9% | 20 |
| Boston, MA | $2,210,000 | 0.5% | -5.6% | -19.3% | -25.2% | 21 |
| Charlotte, NC | $1,310,000 | 9.2% | 4.2% | -7.0% | -11.4% | 35 |
| Chicago, IL | $1,175,000 | 6.8% | -26.4% | -31.2% | -34.1% | 61 |
| Cincinnati, OH | $805,000 | 7.3% | -26.0% | -18.2% | -28.2% | 7 |
| Cleveland, OH | $700,000 | 4.5% | -25.6% | -34.0% | -20.1% | 20 |
| Columbus, OH | $844,400 | 4.2% | -9.4% | -15.9% | -25.1% | 36 |
| Dallas, TX | $1,350,000 | -1.3% | 6.7% | -11.7% | -11.5% | 28 |
| Denver, CO | $1,700,000 | -0.8% | 1.6% | -16.1% | -22.9% | 11 |
| Detroit, MI | $635,000 | 1.4% | -23.6% | -34.6% | -30.4% | 12 |
| Fort Lauderdale, FL | $1,575,000 | -1.6% | 1.1% | -29.5% | -33.7% | 83 |
| Fort Worth, TX | $1,100,000 | -2.2% | 12.0% | -5.2% | -9.0% | 31 |
| Houston, TX | $1,125,000 | 7.1% | -0.3% | -13.9% | -24.7% | 17 |
| Indianapolis, IN | $805,000 | 1.9% | 2.1% | -10.1% | -13.1% | 6 |
| Jacksonville, FL | $1,346,300 | 7.7% | -3.2% | -17.7% | -20.7% | 36 |
| Kansas City, MO | $855,000 | 6.9% | 0.1% | -19.4% | -9.3% | 27 |
| Las Vegas, NV | $1,152,000 | -6.0% | -8.5% | -36.2% | -19.3% | 77 |
| Los Angeles, CA | $3,399,000 | -2.9% | -5.1% | -21.1% | -36.2% | 44 |
| Miami, FL | $2,900,000 | 5.5% | -2.1% | -33.1% | -40.1% | 114 |
| Milwaukee, WI | $875,000 | 6.0% | -23.1% | -27.5% | -27.1% | 51 |
| Minneapolis, MN | $1,004,000 | 0.4% | -1.9% | -9.1% | -26.8% | 17 |
| Montgomery County, PA | $1,275,000 | 4.3% | -14.9% | -27.4% | -34.3% | 28 |
| Nashville, TN | $1,700,000 | 4.3% | 28.4% | 0.7% | -25.9% | 62 |
| Nassau County, NY | $2,350,000 | 5.4% | 2.7% | -6.4% | -39.3% | 79 |
| New Brunswick, NJ | $1,775,000 | 12.1% | -11.0% | -20.1% | -31.5% | 59 |
| New York, NY | $3,500,000 | 7.7% | -6.9% | -14.6% | -36.0% | 86 |
| Newark, NJ | $1,625,000 | 9.2% | -21.2% | -28.0% | -29.7% | 15 |
| Oakland, CA | $2,800,000 | -11.1% | -14.6% | -21.5% | -28.9% | 12 |
| Orlando, FL | $1,100,000 | 8.8% | 3.0% | -17.9% | -18.6% | 20 |
| Philadelphia, PA | $1,012,500 | 4.9% | -2.5% | -18.4% | -23.4% | 35 |
| Phoenix, AZ | $1,595,000 | -0.3% | 1.6% | -34.9% | -10.4% | 60 |
| Pittsburgh, PA | $751,800 | 4.8% | -7.2% | -16.2% | -17.4% | 62 |
| Portland, OR | $1,300,000 | -3.7% | -1.8% | -11.3% | -23.2% | 13 |
| Providence, RI | $1,250,000 | 4.2% | -14.2% | -26.2% | -36.1% | 32 |
| Riverside, CA | $1,352,500 | -3.4% | -6.7% | -23.9% | -24.5% | 50 |
| Sacramento, CA | $1,482,500 | -4.5% | 3.1% | -3.8% | -20.8% | 25 |
| San Antonio, TX | $949,000 | 5.4% | 17.1% | -11.5% | -31.3% | 47 |
| San Diego, CA | $3,200,000 | 1.6% | -0.3% | -10.3% | -26.6% | 22 |
| San Francisco, CA | $4,800,000 | -12.7% | 15.6% | 4.5% | -4.0% | 22 |
| San Jose, CA | $4,307,500 | -10.3% | -8.9% | -20.4% | -12.8% | 14 |
| Seattle, WA | $2,500,000 | -12.3% | -4.3% | -22.2% | -23.9% | 9 |
| St. Louis, MO | $821,000 | 2.6% | -9.5% | -21.4% | -19.5% | 12 |
| Tampa, FL | $1,350,000 | 1.9% | 21.5% | -14.1% | -7.5% | 25 |
| Virginia Beach, VA | $997,500 | 7.8% | -2.9% | -13.0% | -15.6% | 24 |
| Warren, MI | $850,000 | 6.3% | -10.9% | -23.1% | -21.3% | 18 |
| Washington, D.C. | $1,675,000 | 1.5% | -8.8% | -23.7% | -29.0% | 23 |
| West Palm Beach, FL | $2,850,000 | 3.0% | 20.9% | -25.5% | -11.1% | 75 |
| National—U.S.A. | $1,150,000 | 4.6% | -2.4% | -17.1% | -24.1% | 37 |
Non Luxury Housing Market Summary by Metro Area: Three Months Ending June 30, 2023
| U.S. Metro Area | Median Sale Price | Median Sale Price, YoY Change | Active Listings, YoY Change | New Listings, YoY Change | Homes Sold, YoY Change | Median Days On Market |
| Anaheim, CA | $960,500 | -3.0% | -30.4% | -38.2% | -22.3% | 27 |
| Atlanta, GA | $369,700 | 2.0% | -2.5% | -24.7% | -14.2% | 27 |
| Austin, TX | $465,000 | -12.5% | -0.7% | -31.8% | -18.4% | 53 |
| Baltimore, MD | $350,000 | 1.5% | -28.4% | -33.6% | -26.2% | 10 |
| Boston, MA | $671,800 | 3.4% | -32.0% | -37.3% | -27.4% | 18 |
| Charlotte, NC | $352,700 | -0.6% | -1.5% | -20.4% | -18.1% | 37 |
| Chicago, IL | $300,000 | 3.5% | -27.9% | -32.4% | -21.5% | 47 |
| Cincinnati, OH | $252,000 | 6.0% | -34.3% | -25.9% | -21.3% | 5 |
| Cleveland, OH | $200,000 | 6.9% | -26.2% | -30.5% | -14.1% | 12 |
| Columbus, OH | $293,000 | 5.0% | -19.1% | -24.3% | -18.0% | 33 |
| Dallas, TX | $389,900 | -2.5% | -3.2% | -22.2% | -6.7% | 29 |
| Denver, CO | $570,000 | -5.0% | -20.7% | -33.4% | -21.2% | 9 |
| Detroit, MI | $150,000 | 0.0% | -14.0% | -19.0% | -14.2% | 14 |
| Fort Lauderdale, FL | $400,000 | 8.0% | -7.1% | -20.9% | -19.8% | 45 |
| Fort Worth, TX | $325,000 | -3.0% | 1.8% | -19.5% | -1.5% | 28 |
| Houston, TX | $300,000 | 0.0% | 0.7% | -17.5% | -9.5% | 28 |
| Indianapolis, IN | $255,000 | 2.0% | -16.8% | -25.3% | -20.1% | 6 |
| Jacksonville, FL | $349,900 | 1.1% | -6.1% | -30.4% | -14.3% | 46 |
| Kansas City, MO | $273,000 | 1.5% | -18.1% | -23.0% | -16.8% | 11 |
| Las Vegas, NV | $389,900 | -9.3% | -26.2% | -46.6% | -19.8% | 41 |
| Los Angeles, CA | $797,000 | -4.0% | -30.6% | -39.4% | -25.0% | 32 |
| Miami, FL | $465,000 | 10.2% | -13.6% | -32.0% | -22.1% | 48 |
| Milwaukee, WI | $285,000 | 6.3% | -31.0% | -32.9% | -23.1% | 35 |
| Minneapolis, MN | $360,000 | 0.0% | -20.7% | -25.9% | -20.7% | 13 |
| Montgomery County, PA | $442,500 | 5.0% | -23.4% | -30.1% | -23.1% | 11 |
| Nashville, TN | $423,700 | 0.9% | 1.3% | -24.3% | -22.0% | 46 |
| Nassau County, NY | $612,000 | 2.0% | -35.3% | -40.3% | -24.4% | 27 |
| New Brunswick, NJ | $496,500 | 8.2% | -35.4% | -42.7% | -27.0% | 33 |
| New York, NY | $700,000 | 2.2% | -27.0% | -34.2% | -29.0% | 56 |
| Newark, NJ | $505,000 | 10.5% | -34.3% | -36.5% | -26.3% | 19 |
| Oakland, CA | $925,000 | -10.6% | -35.7% | -40.6% | -33.6% | 12 |
| Orlando, FL | $375,000 | 2.2% | -7.2% | -28.5% | -12.3% | 23 |
| Philadelphia, PA | $239,900 | 4.3% | -19.8% | -33.1% | -24.9% | 37 |
| Phoenix, AZ | $425,000 | -9.6% | -22.6% | -47.4% | -18.6% | 47 |
| Pittsburgh, PA | $195,000 | 1.9% | -21.0% | -28.8% | -19.3% | 47 |
| Portland, OR | $535,000 | -2.7% | -35.5% | -42.9% | -37.0% | 9 |
| Providence, RI | $430,000 | 6.2% | -31.0% | -36.2% | -21.8% | 20 |
| Riverside, CA | $540,000 | -2.7% | -27.8% | -40.5% | -27.9% | 38 |
| Sacramento, CA | $545,000 | -8.4% | -30.2% | -36.3% | -25.4% | 11 |
| San Antonio, TX | $293,100 | 1.1% | 5.2% | -20.8% | -12.1% | 45 |
| San Diego, CA | $831,000 | -3.0% | -37.6% | -44.7% | -26.7% | 12 |
| San Francisco, CA | $1,375,000 | -11.3% | -26.7% | -33.0% | -29.9% | 15 |
| San Jose, CA | $1,450,000 | -8.2% | -34.6% | -37.6% | -29.3% | 10 |
| Seattle, WA | $765,000 | -7.8% | -34.1% | -42.1% | -36.3% | 6 |
| St. Louis, MO | $230,000 | 5.1% | -17.7% | -22.1% | -21.0% | 10 |
| Tampa, FL | $360,000 | 0.0% | -8.9% | -30.8% | -8.1% | 25 |
| Virginia Beach, VA | $320,500 | 4.7% | -26.3% | -31.8% | -22.9% | 19 |
| Warren, MI | $284,900 | 3.6% | -24.5% | -30.5% | -18.1% | 10 |
| Washington, D.C. | $513,900 | 0.8% | -24.2% | -32.9% | -23.1% | 23 |
| West Palm Beach, FL | $430,000 | 5.9% | -1.6% | -29.8% | -9.2% | 55 |
| National—U.S.A. | $340,000 | 1.5% | -18.8% | -29.8% | -19.4% | 28 |