
Homebuyers are turning to newly built single-family homes as overall inventory sits at an all-time low. New homes are most common in El Paso, TX, Omaha, NE and Raleigh, NC, and least common in California and Hawaii.
Newly built homes made up nearly one-third (31.4%) of U.S. single-family homes on the market in the second quarter. That’s the highest share of any second quarter on record, with new construction keeping the housing market afloat amid the severe shortage of existing homes for sale.
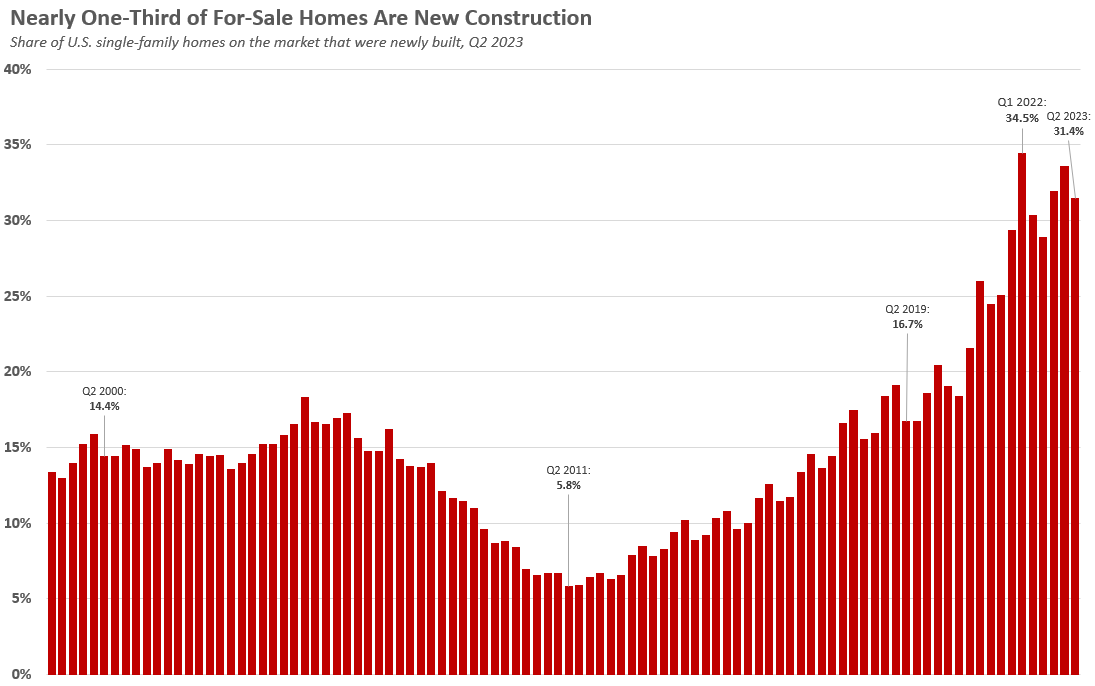
The portion of new homes of all inventory is up from 30.3% a year earlier and nearly double the pre-pandemic share of about 17% in the second quarter of 2019.
The second quarter’s share is down from a near-record-high of 33.6% the previous quarter, but that’s a normal seasonal pattern, as the share of new homes tends to peak in the winter months.
New homes make up a near-record share of housing inventory for a few reasons:
- The pandemic-fueled homebuilding boom. Builders rushed to capitalize on the pandemic homebuying frenzy, driven by record-low mortgage rates and remote work. Building permits for single-family U.S. homes soared in 2021 and early 2022.
- Lack of existing homes on the market. Builders aren’t constructing as many new single-family homes as they were at the height of the pandemic–but so few homeowners are putting their homes on the market that new homes still make up a huge share of available inventory. Total inventory dropped 15% year over year to an all-time low in June. With mortgage rates hovering near a two-decade high, homeowners are grasping onto their relatively low rates and staying put. Builders don’t experience that same lock-in effect.
- Leftover inventory. Because elevated mortgage rates have slowed homebuying demand, builders haven’t yet offloaded all the new homes they completed over the last few years. Although buyers have made a dent in the glut of new-construction homes on the market over the last several months, there are still plenty of new homes on the market. The number of newly built single-family homes for sale was up 4.5% year over year in June, compared with an 18% drop for existing homes.
Homebuilders are benefiting from the scarcity of existing homes on the market
With inventory at a record low, many buyers are turning to new construction. But because overall demand is still relatively low, with high rates continuing to sideline many would-be homebuyers, some builders are lowering prices and offering perks to offload excess inventory.
For many homebuyers, new construction is a welcome option in today’s market–especially in the southern part of the country, where new homes tend to be more prevalent. That’s partly because new homes are often easier to find and partly because builders are more likely than individual homeowners to offer concessions; builders typically don’t have the option of pulling a home off the market if they’re unable to get the price they want.
“Builders are still building but homeowners aren’t selling, so new construction is the only option for many buyers,” said Shauna Pendleton, a Redfin Premier agent in Boise, ID, where new homes made up nearly 40% of single-family inventory in the second quarter. “A lot of buyers want to secure a home now because they’re worried prices are going to go back up, and new construction is more plentiful with perks that are hard to pass up. One builder is doing a promotion where buyers get anywhere from $15,000 to $25,000 worth of concessions. It was supposed to end in June, but they extended it through July, and now they’re extending it through August. That money can cover all of a buyer’s appliances with money left over for a mortgage-rate buydown.”
New construction has dropped off most in Boise–but it still makes up nearly 40% of inventory
Boise is one example of the role of newly built homes in today’s housing market. New homes made up 38% of single-family homes for sale in Boise in the second quarter, the fourth-highest share in the country. But that’s down from almost half (49%) a year earlier, the biggest decline in the country.
The Idaho capital experienced a residential building boom in 2021 and early 2022 as builders worked to keep up with rampant pandemic-driven demand, with out-of-town remote workers flooding into Boise, attracted to its relatively low cost of living and outdoorsy lifestyle. There were so many new homes on the market that nearly half of last summer’s single-family inventory was new construction.
Boise’s housing market has cooled considerably due to elevated mortgage rates and the end of the remote-work migration boom, but builders are still constructing a lot of new homes, according to Pendleton. Even though they make up a smaller portion of for-sale single-family inventory than they did a year ago, the share is still significant because 1) builders are still building and they’re offloading excess inventory, and 2) there’s a serious lack of existing homes for sale, with Boise’s total inventory down 51% year over year in June.
Metro-level highlights: Q2 2023
- Metros where new construction is most prevalent: Newly built homes made up more than half (52%) of single-family homes for sale in El Paso, TX, the biggest share of the metros in this analysis. It’s followed by Omaha, NE (46%), Raleigh, NC (42.1%), Oklahoma City (39%) and Boise (38%). New construction is typically prevalent in parts of the country with sprawling land and loose building codes.
- Metros where new construction is least prevalent: Newly built homes made up just 2.8% of single-family homes for sale in Honolulu, the smallest share of the metros in this analysis. Next come San Diego (3.3%), Pittsburgh, PA (3.3%), Oxnard, CA (3.7%) and Detroit ((3.8%). New construction tends to be relatively uncommon in California because of limited land and strict regulations.
- Metros with the biggest upticks in newly built homes: New homes made up 33% of single-family inventory in Tulsa, OK, up from 20% a year earlier. That’s the biggest jump of the metros in this analysis. It’s followed by Richmond, VA (35%, up from 23%), Albany, NY (24%, up from 13%), Phoenix (26%, up from 15%) and Elgin, IL (25%, up from 15%).
- Metros with the biggest declines in newly built homes: Boise saw the biggest year-over-year decline by far, with new homes making up 38.3% of inventory, down from 49% a year earlier. It’s followed by Austin, TX (30.4%, down from 34.5%), Honolulu (2.8%, down from 6.4%), Allentown, PA (14.9%, down from 18.5%) and Houston (35.3%, down from 38.5%).
| Metro-level summary: Share of single-family homes for sale that were new construction, Q2 2023 | |||
| U.S. metro area | Q2 2023 | Q2 2022 | YoY Change (percentage points) |
| Albany, NY | 24.2% | 12.8% | 11.4 pts. |
| Allentown, PA | 14.9% | 18.5% | -3.6 pts. |
| Anaheim, CA | 4.7% | 3.1% | 1.6 pts. |
| Atlanta, GA | 24.3% | 20.6% | 3.7 pts. |
| Austin, TX | 30.4% | 34.5% | -4.1 pts. |
| Bakersfield, CA | 9.7% | 9.3% | 0.4 pts. |
| Baltimore, MD | 14.1% | 9.5% | 4.6 pts. |
| Birmingham, AL | 17.1% | 18.6% | -1.5 pts. |
| Boise, ID | 38.3% | 49% | -10.7 pts. |
| Boston, MA | 17.2% | 10% | 7.2 pts. |
| Bridgeport, CT | 9.3% | 5.6% | 3.7 pts. |
| Buffalo, NY | 8.6% | 6.9% | 1.7 pts. |
| Camden, NJ | 5.9% | 3.6% | 2.3 pts. |
| Cape Coral, FL | 27.2% | 26.6% | 0.6 pts. |
| Charleston, SC | 33.8% | 27.8% | 6 pts. |
| Charlotte, NC | 31.3% | 24.9% | 6.4 pts. |
| Chicago, IL | 6.4% | 4.7% | 1.7 pts. |
| Cincinnati, OH | 23.6% | 16.1% | 7.5 pts. |
| Cleveland, OH | 9.5% | 7.2% | 2.3 pts. |
| Columbus, OH | 12.4% | 10.4% | 2 pts. |
| Dallas, TX | 28.4% | 28.3% | 0.1 pts. |
| Dayton, OH | 9.8% | 11% | -1.2 pts. |
| Denver, CO | 19.1% | 14.6% | 4.5 pts. |
| Detroit, MI | 3.8% | 3.2% | 0.6 pts. |
| El Paso, TX | 52.1% | 47.7% | 4.4 pts. |
| Elgin, IL | 25.2% | 15% | 10.2 pts. |
| Fort Lauderdale, FL | 4.6% | 4.4% | 0.2 pts. |
| Fort Worth, TX | 31.8% | 25.5% | 6.3 pts. |
| Frederick, MD | 18.1% | 13.2% | 4.9 pts. |
| Fresno, CA | 14.4% | 12% | 2.4 pts. |
| Grand Rapids, MI | 19.6% | 21% | -1.4 pts. |
| Greensboro, NC | 21.9% | 24.3% | -2.4 pts. |
| Greenville, SC | 33.8% | 29.4% | 4.4 pts. |
| Hartford, CT | 9.9% | 5.8% | 4.1 pts. |
| Honolulu, HI | 2.8% | 6.40% | -3.6 pts. |
| Houston, TX | 35.3% | 38.5% | -3.2 pts. |
| Indianapolis, IN | 23.9% | 23.7% | 0.2 pts. |
| Jacksonville, FL | 26.9% | 26.7% | 0.2 pts. |
| Knoxville, TN | 25.4% | 22.1% | 3.3 pts. |
| Lake County, IL | 4.5% | 4.9% | -0.4 pts. |
| Lakeland, FL | 29.6% | 32.2% | -2.6 pts. |
| Las Vegas, NV | 13% | 7.3% | 5.7 pts. |
| Little Rock, AR | 16.2% | 16.9% | -0.7 pts. |
| Los Angeles, CA | 5.9% | 3.9% | 2.0 pts. |
| Louisville, KY | 21.2% | 16.8% | 4.4 pts. |
| McAllen, TX | 29.1% | 20.9% | 8.2 pts. |
| Memphis, TN | 17% | 17.9% | -0.9 pts. |
| Miami, FL | 8.1% | 5.7% | 2.4 pts. |
| Milwaukee, WI | 9.6% | 6.6% | 3 pts. |
| Minneapolis, MN | 31.2% | 27.1% | 4.1 pts. |
| Montgomery County, PA | 18% | 12.2% | 5.8 pts. |
| Nashville, TN | 33.8% | 25.3% | 8.5 pts. |
| Nassau County, NY | 8.6% | 6.1% | 2.5 pts. |
| New Brunswick, NJ | 11.8% | 8.6% | 3.2 pts. |
| New Haven, CT | 8.4% | 5% | 3.4 pts. |
| New Orleans, LA | 26.1% | 21.8% | 4.3 pts. |
| New York, NY | 5.50% | 4.9% | 0.6 pts. |
| Newark, NJ | 6.60% | 4.4% | 2.2 pts. |
| North Port, FL | 25.8% | 25.3% | 0.5 pts. |
| Oakland, CA | 6.3% | 3.1% | 3.2 pts. |
| Oklahoma City, OK | 39.3% | 42% | -2.7 pts. |
| Omaha, NE | 45.5% | 36% | 9.5 pts. |
| Orlando, FL | 19.6% | 19.3% | 0.3 pts. |
| Oxnard, CA | 3.7% | 4% | -0.3 pts. |
| Philadelphia, PA | 13.2% | 5.9% | 7.3 pts. |
| Phoenix, AZ | 25.6% | 14.9% | 10.7 pts. |
| Pittsburgh, PA | 3.3% | 3.4% | -0.1 pts. |
| Portland, OR | 19.2% | 17.7% | 1.5 pts. |
| Providence, RI | 10.9% | 8.5% | 2.4 pts. |
| Raleigh, NC | 42.1% | 37.4% | 4.7 pts. |
| Richmond, VA | 34.8% | 22.6% | 12.2 pts. |
| Riverside, CA | 9.5% | 6.8% | 2.7 pts. |
| Rochester, NY | 17.1% | 13.1% | 4 pts. |
| Sacramento, CA | 12.4% | 7.6% | 4.8 pts. |
| Salt Lake City, UT | 18.4% | 20.7% | -2.3 pts. |
| San Antonio, TX | 32.2% | 38.3% | -6.1 pts. |
| San Diego, CA | 3.3% | 3.1% | 0.2 pts. |
| San Francisco, CA | 7.00% | 3.9% | 3.1 pts. |
| San Jose, CA | 9.6% | 5.3% | 4.3 pts. |
| Seattle, WA | 19% | 12.9% | 6.1 pts. |
| St. Louis, MO | 19.80% | 14.5% | 5.3 pts. |
| Stockton, CA | 16.3% | 10.8% | 5.5 pts. |
| Tacoma, WA | 20% | 19% | 1 pts. |
| Tampa, FL | 18.4% | 17.4% | 1 pts. |
| Tucson, AZ | 25.60% | 22.2% | 3.4 pts. |
| Tulsa, OK | 33.1% | 19.8% | 13.3 pts. |
| Virginia Beach, VA | 22.1% | 15.4% | 6.7 pts. |
| Warren, MI | 18.8% | 13.4% | 5.4 pts. |
| Washington, D.C. | 17.5% | 13% | 4.5 pts. |
| West Palm Beach, FL | 8.4% | 6.1% | 2.3 pts. |
| Worcester, MA | 14.1% | 10.2% | 3.9 pts. |


