
- The median sale price was just 1.5% below its all-time high in June, and the average home sold for above its list price for the first time in roughly a year.
- The number of homes for sale fell 15% to an all-time low in June, the biggest decline in two years, as elevated rates kept sellers on the sidelines.
- Demand is inching up as house hunters get used to high mortgage rates; pending sales posted their biggest monthly increase since 2021.
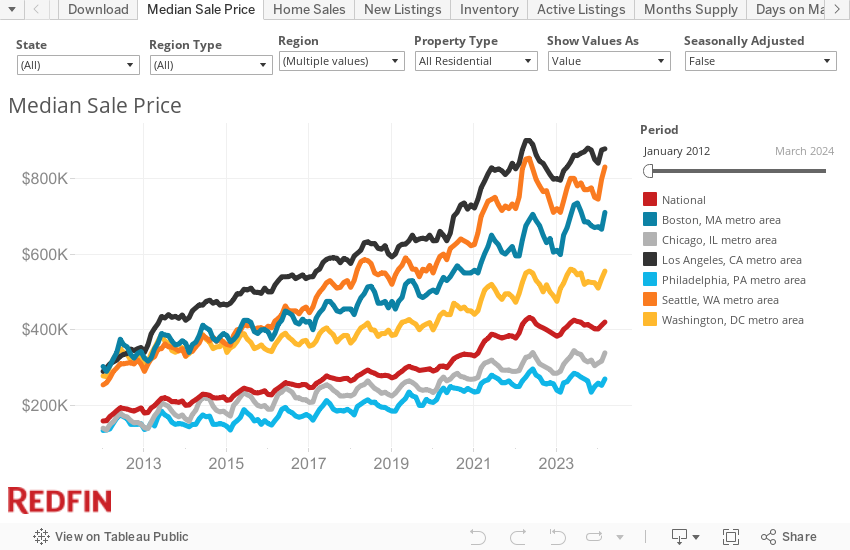
A record low number of homes for sale combined with an uptick in homebuyer demand propped up housing prices in June, even as elevated mortgage rates kept many buyers on the sidelines. The median U.S. home sale price was $426,056 in June, just 1.5% ($6,341) below the all-time high of $432,397 set in May 2022.

June’s median sale price was down 0.6% from a year earlier—the smallest decline of the past five months—and the average home sold for more than its list price for the first time in roughly a year.

“Today’s housing market is extraordinary; it feels hot even though there are very few homes changing hands,” said Redfin Chief Economist Daryl Fairweather.
“Sellers are getting multiple offers if their home is priced well and in a desirable area even though there aren’t a lot of buyers out there. That’s because house hunters have so few homes to choose from. More buyers are starting to come out of the woodwork as they get used to elevated mortgage rates, which is making the market feel even hotter.”
While mortgage rates are expected to start gradually declining in response to cooling inflation, they’re unlikely to fall enough to bring a critical mass of sellers back to the market anytime soon, meaning housing supply should remain low. When rates do ultimately fall more significantly, prices will likely jump as more buyers move off of the sidelines.
Home Prices Climb Relatively Quickly in Affordable Markets
Affordable areas are seeing home prices climb relatively quickly. In Rochester, NY, the median sale price rose 13.1% year over year to $250,000—the biggest increase among the metros Redfin analyzed. It was followed by Milwaukee (11.6%) and Omaha, NE (10.4%).
“We haven’t really felt the effects of high mortgage rates on homebuyer demand in Rochester,” said local Redfin real estate agent Kimberly Hogue. “You can still find a nice house in a desirable part of town for $300,000 or less, and a lot of people here can afford the monthly payment for a home in that price range. Of course, those homes tend to sell for tens of thousands of dollars above the asking price. There are plenty of remote workers moving in, and lately I’ve helped several locals move farther out for more acreage.”
Hogue continued: “I recently had a rural listing get more than 20 offers. One of the bidders offered to send the sellers on a cruise, but the sellers didn’t bite. Instead, they went with an offer that was $100,000 over the asking price.”
Prices fell most in Boise, ID (-10.4%), Austin, TX (-7.8%) and Las Vegas (-7.8%)—pandemic boomtowns that saw prices surge as scores of remote workers moved in.
June 2023 Highlights
| June 2023 | Month-Over-Month Change | Year-Over-Year Change | |
| Median sale price | $426,056 | 1.9% | -0.6% |
| Pending sales, seasonally adjusted | 396,468 | 1.9% | -16.2% |
| Homes sold, seasonally adjusted | 404,331 | -3.0% | -19.8% |
| New listings, seasonally adjusted | 450,350 | -3.5% | -30.6% |
| All homes for sale, seasonally adjusted (active listings) | 1,318,154 | -4.7% | -15.0% |
| Months of supply | 1.8 | 0 | 0 |
| Median days on market | 29 | -2 | 11 |
| Share of for-sale homes with a price drop | 15.9% | 1.9 ppts | -0.02 ppts |
| Share of homes sold above final list price | 39.7% | 2.2 ppts | -15.5 ppts |
| Average sale-to-final-list-price ratio | 100.3% | 0.3 ppts | -2.0 ppts |
| Share of home offers written by Redfin agents that faced competition, seasonally adjusted | 46.8% | -1.7 ppts | -5.1 ppts |
| Pending sales that fell out of contract, as % of overall pending sales | 15.7% | 1.5 ppts | 1.6 ppts |
| Share of homes sales in which seller offered concession to buyer | 36.1% | -3.1 ppts | 13.9 ppts |
| Average 30-year fixed mortgage rate | 6.71% | 0.28 ppts | 1.19 ppts |
Note: Data is subject to revision
Pending Home Sales Post Biggest Monthly Increase Since 2021
Seasonally-adjusted pending home sales rose 1.9% from a month earlier in June to the highest level since fall, representing the largest monthly increase since October 2021. Pending sales have now climbed for three consecutive months on a revised basis following 16 straight months of declines. Pending sales fell 16.2% year over year in June, the smallest annual decline in a year. Still, pending sales in June were lower than they were at any point during the three years leading up to the pandemic.
“Homebuyer demand has bottomed out,” Fairweather said. “High rates are still giving a lot of buyers pause, but the sticker shock is no longer as severe as it was when rates skyrocketed last year. With home prices back near record highs, buyers are also less worried that they’ll buy a house that’ll plunge in value.”
Closed home sales dropped 19.8% year over year to the lowest level since May 2020, and fell 3% month over month on a seasonally adjusted basis.
Lack of Homes for Sale Is Fueling Bidding Wars in Some Markets
The total number of homes for sale dropped 15% year over year to an all-time low in June, the biggest annual decline in nearly two years. That’s largely because rising mortgage rates kept homeowners from selling, intensifying a yearslong housing shortage. New listings fell 30.6% from a year earlier to roughly 450,000—the lowest level and largest annual decline on record aside from April 2020, when the onset of the pandemic brought the housing market to a halt.

Months of supply stood at just 1.8—the lowest level for any June on record prior to the pandemic. Months of supply is the length of time it would take for the existing supply of homes for sale to be bought up at the market’s current pace if no new homes came on the market.
Homeowners are staying put because for a majority of them, selling and buying a new house would mean taking on a much higher mortgage rate. Roughly nine in 10 homeowners with mortgages have an interest rate below 6%. The average 30-year-fixed mortgage rate in June was 6.71%, not far from the 20-year-high of 7.08% hit in the fall Today’s average mortgage rate is even higher, at 6.96%.
The lack of homes on the market is fueling homebuyer bidding wars in some areas. Nearly half (46.8%) of home offers written by Redfin agents in June faced competition. While that’s down from 51.8% a year earlier and a peak of 70.4% in January 2022, it’s notable that so many buyers are facing competition at a time when demand is sluggish. An offer is considered part of a bidding war if a Redfin agent reported that it faced at least one competing bid.
Competition varies widely from market to market. In Rochester, NY, the typical home is selling for 14.1% more than its asking price—the highest premium among the metros Redfin analyzed. But in Austin, TX, the typical home is selling for 2.1% less than its asking price.
Metro-Level Highlights: June 2023
Data in the bullets below came from a list of the 91 U.S. metro areas with populations of at least 750,000. Select metros may be excluded from time to time to ensure data accuracy. A full metro-level data table can be found in the “download” tab of the dashboard embedded below or in the monthly section of the Redfin Data Center. Refer to our metrics definition page for explanations of metrics used in this report. Metro-level data is not seasonally adjusted.
- Pending sales: In Boise, ID, pending sales fell 70.7% year over year, more than any other metro Redfin analyzed. It was followed by Baton Rouge, LA (-61.8%) and Allentown, PA (-54.8%). The smallest declines were in Fort Worth, TX (-0.6%), Dallas (-2.6%) and El Paso, TX (-4.6%).
- Closed sales: In Tacoma, WA, closed home sales dropped 34.2% year over year, more than any other metro Redfin analyzed. Next came Oxnard, CA (-31.5%) and Lake County, IL (-30.8%). Closed sales rose in one metro: North Port, FL (4%).
- Prices: Median sale prices fell from a year earlier in 35 of the metros Redfin analyzed. The biggest declines were in Boise (-10.4%), Austin, TX (-9.7%) and Las Vegas (-7.8%). The biggest increases were in Rochester, NY (13.1%), Milwaukee (11.6%) and Omaha, NE (10.4%).
- Listings: New listings fell most from a year earlier in Allentown (-57.1%), Boise (-55.4%) and Hartford, CT (-53.3%). They fell least in McAllen, TX (-10.3%), Houston (-15.4%) and Detroit (-18.1%).
- Supply: Active listings fell most from a year earlier in Allentown (-49.7%), Boise (-49%) and Hartford (-45.1%). They rose most in New Orleans (38.4%), North Port (31.7%) and McAllen (30.8%).
- Competition: In Rochester, 78% of homes sold above their final list price, the highest share among the metros Redfin analyzed. Next came Hartford (75.3%) and Worcester, MA (70.8%). The share was lowest in North Port (9.7%), Cape Coral, FL (12%) and West Palm Beach, FL (12.2%).


