
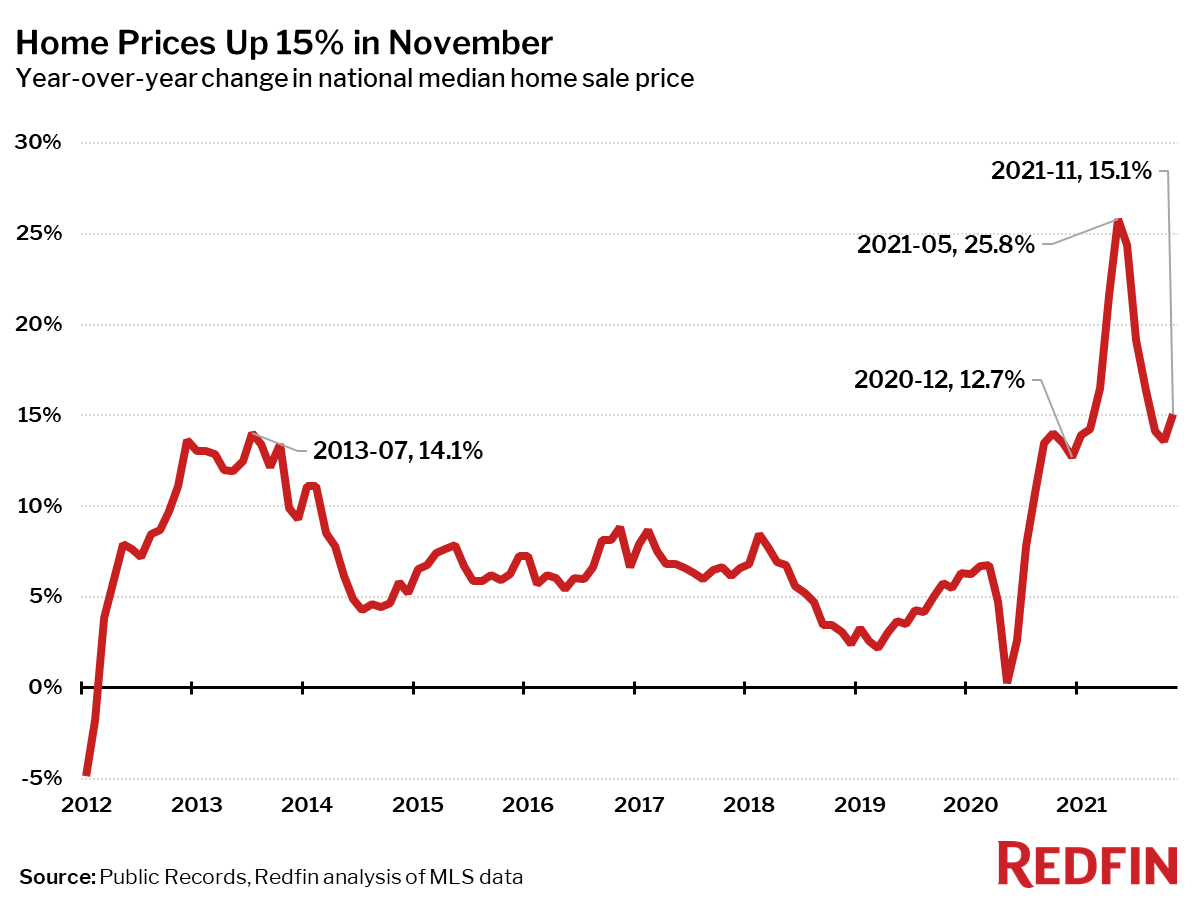
Home prices rose 15% from a year earlier, just shy of their all-time high.
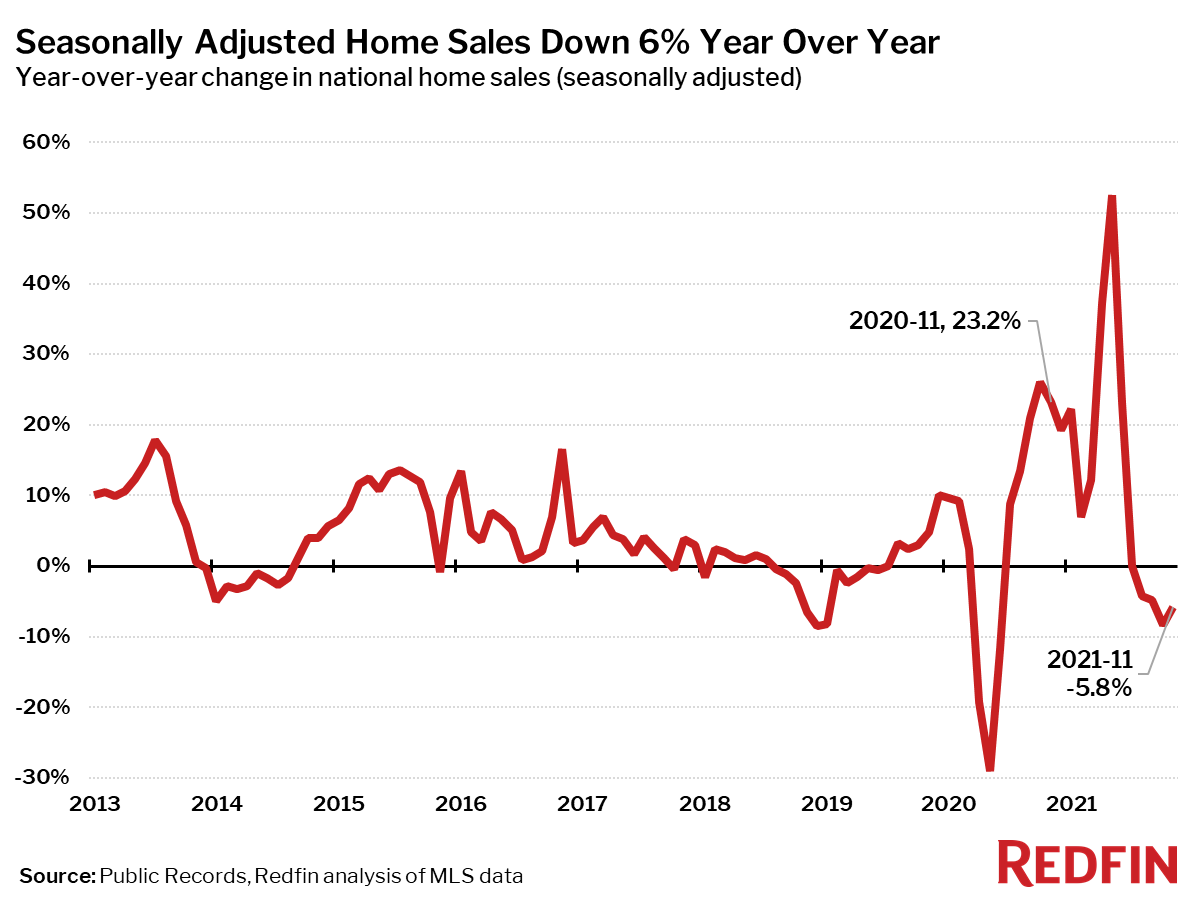
The seasonally-adjusted number of homes for sale fell 18% year over year in November to an all-time low, sending the median sale price up 15% to $383,100. November marked the 16th consecutive month of double-digit price gains, and so far in December there are no signs of the typical seasonal slowdown in price growth that usually comes at the end of the year. Seasonally-adjusted closed home sales and new listings of homes for sale both fell from a year earlier, by 6% and 9% respectively, and the average home sold for 0.6% more than list price.
“I wish I had better news for homebuyers this holiday season, but in many ways the housing market is more challenging than ever,” said Redfin Chief Economist Daryl Fairweather. “At least buyers have the benefit of low mortgage rates. But by next year, inflation may spread to more consumer goods. So even though our new year’s forecast includes more listings and slower home-price growth, buyers may feel so pinched by other expenses that they have to reduce their housing budgets.”
| Market Summary | November 2021 | Month-Over-Month | Year-Over-Year |
|---|---|---|---|
| Median sale price | $383,100 | 0.9% | 15.1% |
| Homes sold, seasonally-adjusted | 616,500 | 0.8% | -5.8% |
| Pending sales, seasonally-adjusted | 614,300 | 1.2% | 0.8% |
| New listings, seasonally-adjusted | 643,400 | 0.1% | -8.7% |
| All Homes for sale, seasonally-adjusted | 1,360,200 | -2.5% | -18.0% |
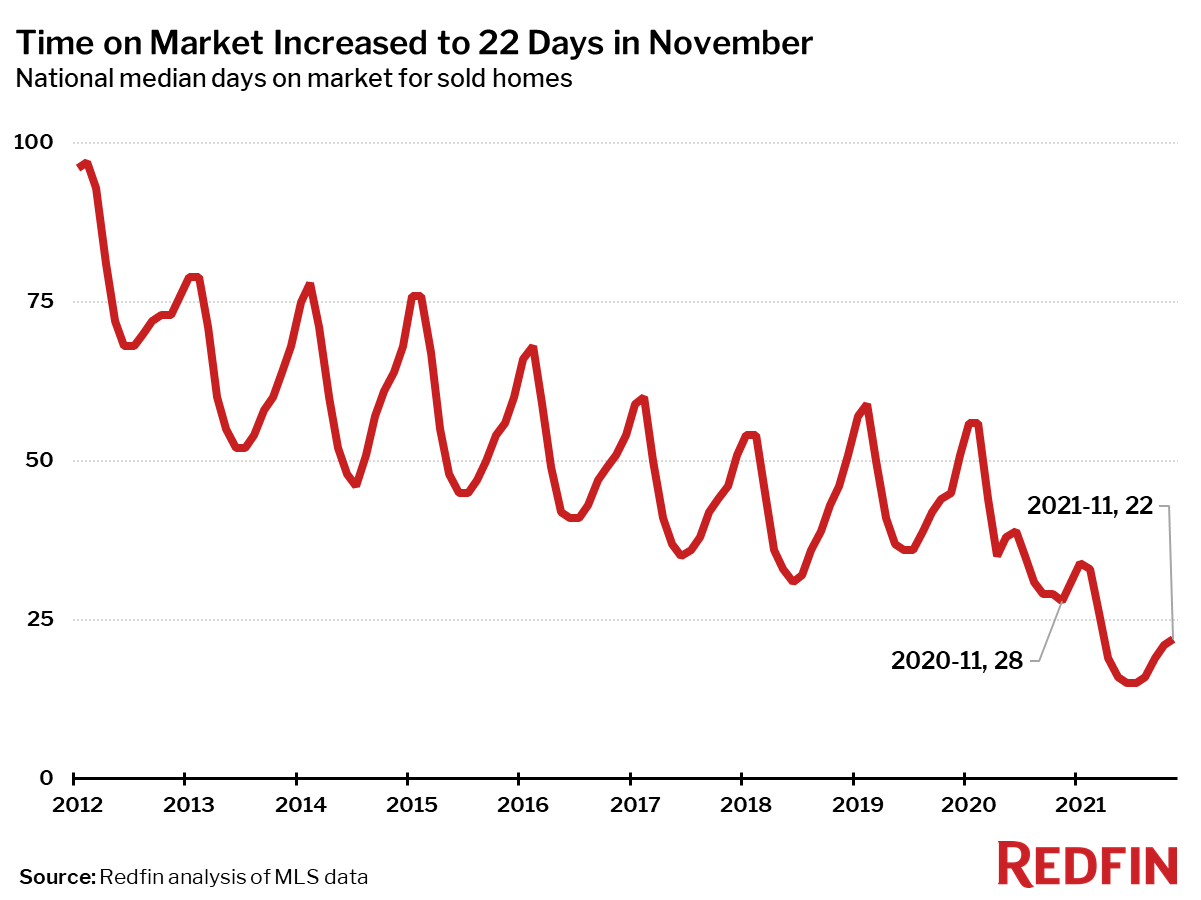
| Median days on market | 22 | 1 | -6 |
| Months of supply | 1.2 | -0.2 | -0.5 |
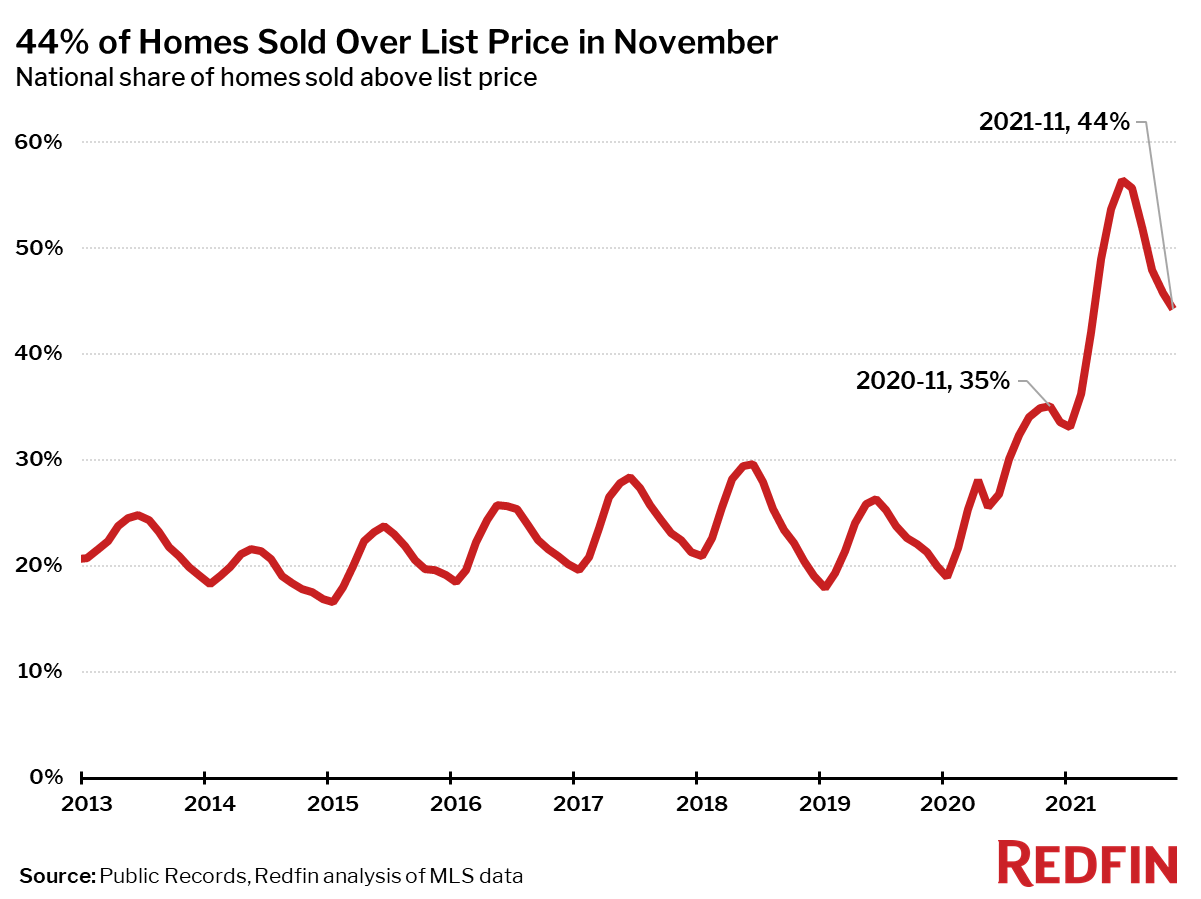
| Sold above list | 44.3% | -1.5 pts† | 9.1 pts† |
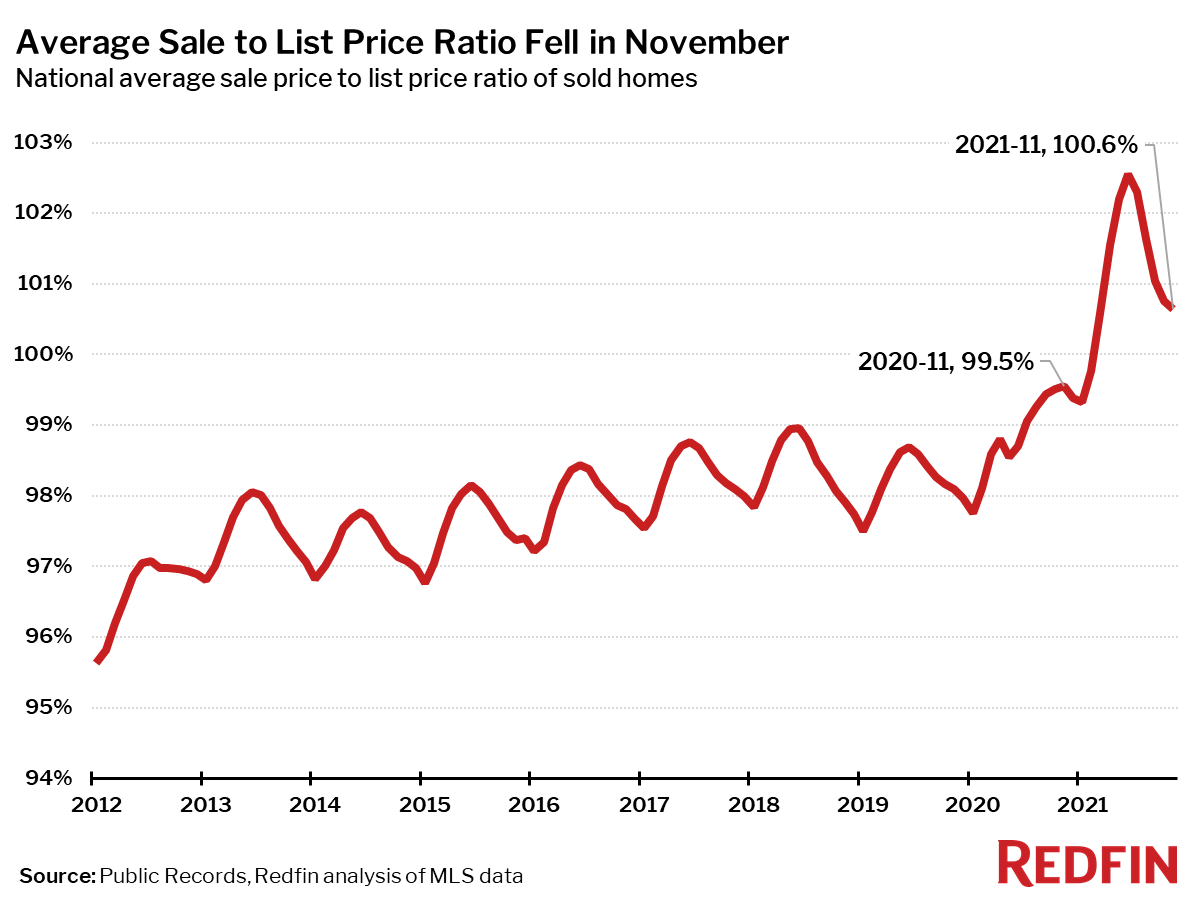
| Average Sale-to-list | 100.6% | -0.1 pts† | 1.1 pts† |
| Average 30-year fixed mortgage rate | 3.07% | 0 pts† | +0.3 pts† |
Median sale prices increased from a year earlier in all of the 85 largest metro areas Redfin tracks. The smallest increases were in Baltimore, MD, Bridgeport, CT and Newark, NJ. The largest price increases were in Austin, TX (+31%), Phoenix, AZ (+27%) and North Port, FL (+27%).
Seasonally-adjusted home sales in November were down 6% from a year earlier, a slightly less severe decline than the previous month. Home sales fell in 49 of the 85 largest metro areas Redfin tracks. The biggest sales declines were seen in Nassau County, NY (-21%), Bridgeport, CT (-19%) and McAllen, TX (-17%). The largest gains were in places where sales were still somewhat depressed in November 2020, including Honolulu (+31%), San Francisco (+13%) and Tulsa, OK (11%).
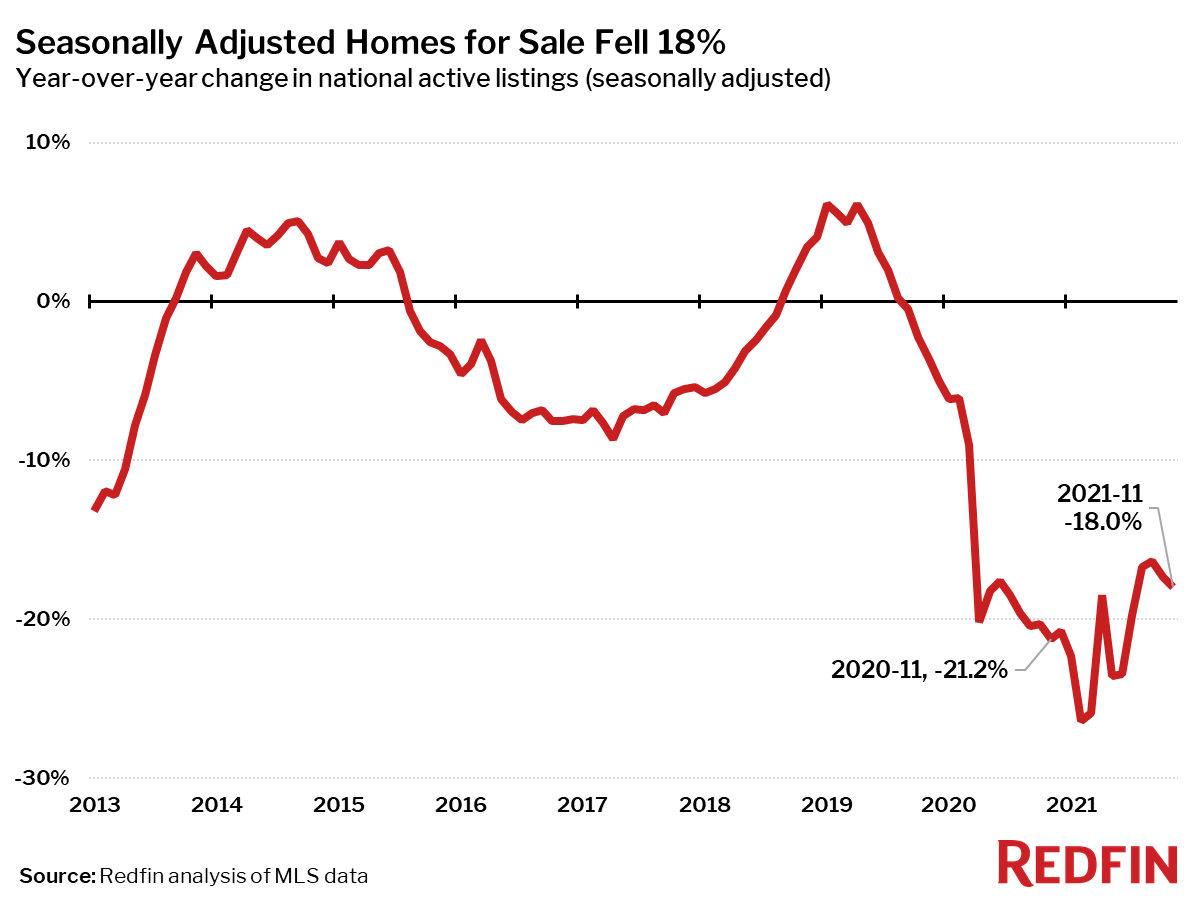
Seasonally adjusted active listings—the count of all homes that were for sale at any time during the month—hit an all-time low in November, falling 18% year over year.
Only four of the 85 largest metros tracked by Redfin posted a year-over-year increase in the number of seasonally adjusted active listings of homes for sale: Detroit, MI (+7%), Milwaukee, WI (+4%), Austin, TX (+3%) and Tacoma, WA (+2%). The biggest year-over-year declines in active housing supply in November were in Baton Rouge, LA (-51%), Salt Lake City (-50%) and Sacramento, CA (-48%).
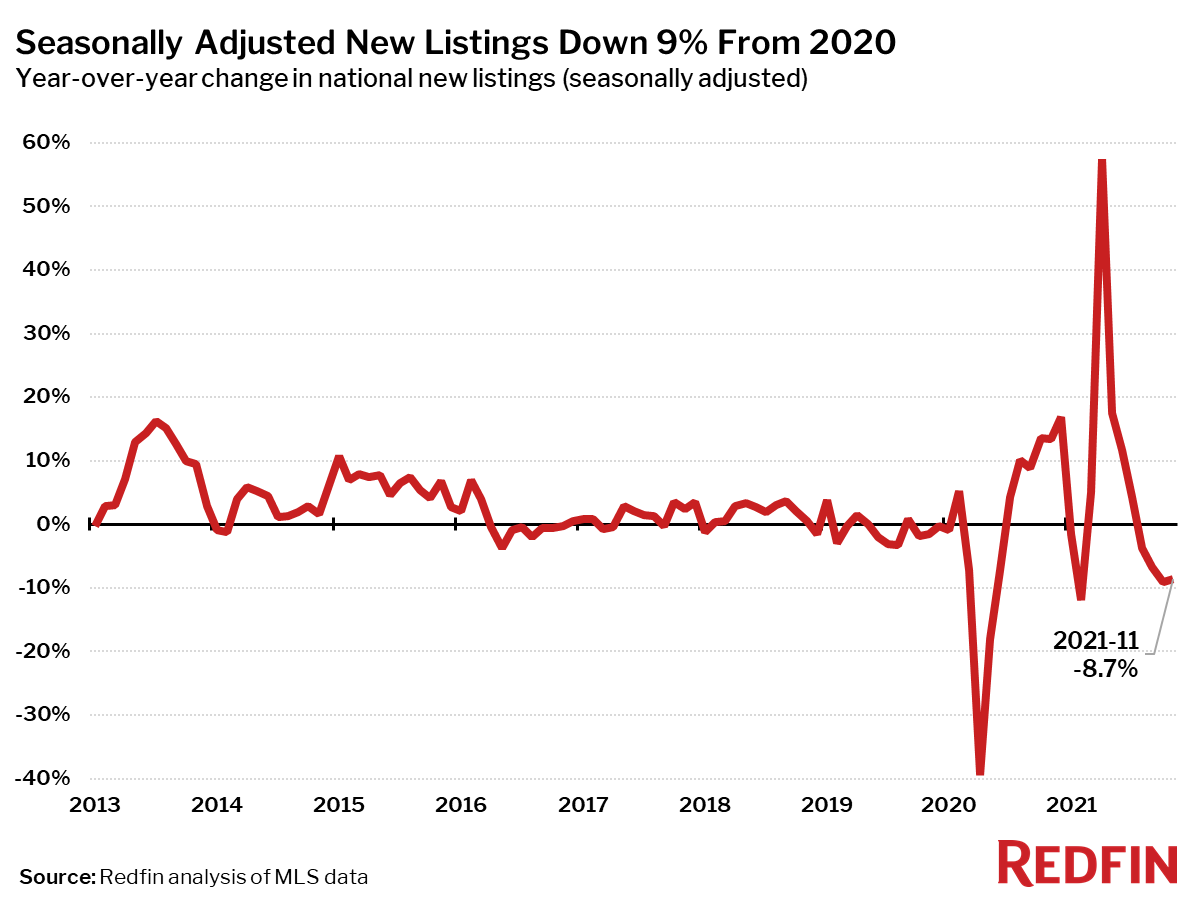
Seasonally adjusted new listings of homes for sale were down 9% in November from a year earlier, on par with the decline seen in October. New listings fell from a year ago in 57 of the 85 largest metro areas. The biggest declines were in Baton Rouge, LA (-55%), Salt Lake City, UT (-55%) and Allentown, PA (-52%). New listings rose the most from a year ago in Detroit, MI (+20%), Pittsburgh, PA (+11%) and Indianapolis, IN (+9%).
The housing market became less competitive in November than it was in prior months as homes spent longer on the market and were less likely to sell above list price.
The typical home that sold in November went under contract in 22 days—nearly a week faster than a year earlier, when homes sold in a median 28 days, but up seven days from the record low of 15 days in June.
In November, 44% of homes sold above list price, down 12 percentage points from the record high in June, but up 9 percentage points from a year earlier.
The average sale-to-list price ratio also dipped slightly in November to 100.6%, down from a record high of 102.6% in June but up from 99.5% a year earlier.
Other November Highlights
Competition
- Indianapolis and Seattle were the fastest markets, with half of all homes pending sale in just 6 days. Denver and Grand Rapids, MI were the next fastest markets with 7 median days on market, followed by North Port, FL (9).
- The most competitive market in November was Oakland, CA where 76.7% of homes sold above list price, followed by 75.8% in San Jose, CA, 70.8% in San Francisco, 64.7% in Rochester, NY, and 64.4% in Buffalo, NY.
Prices
- Austin, TX had the nation’s highest price growth, rising 31.2% since last year to $478,795. Phoenix had the second highest growth at 27.4% year-over-year price growth, followed by North Port, FL (27.1%), West Palm Beach, FL (25%), and Raleigh, NC (24.5%).
- No metros saw price declines in November.
Sales
- Honolulu, HI led the nation in year-over-year sales growth, up 31.2%, followed by San Francisco, up 12.7%. Tulsa, OK rounded out the top three with sales up 11.4% from a year ago.
- Nassau County, NY saw the largest decline in sales since last year, falling 20.6%. Home sales in Bridgeport, CT and McAllen, TX declined by 18.7% and 17.4%, respectively.
Inventory
- Detroit had the highest increase in the number of homes for sale, up 7.3% year over year, followed by Milwaukee (3.8%) and Austin, TX (3.5%).
- Baton Rouge, LA had the largest decrease in overall active listings, falling 50.6% since last November. Salt Lake City (-50.1%), Sacramento, CA (-48.0%), and North Port, FL (-41.2%) also saw far fewer homes available on the market than a year ago.
Redfin Estimate
- Miami (84.6%) had the largest share of homes predicted to sell for below list price, according to Redfin Estimate data, followed by West Palm Beach, FL (79.7%) and Fort Lauderdale, FL (79.2%).
- Oakland, CA (91.9%) had the largest share of homes predicted to sell at or above list price, followed by San Jose, CA (90.8%) and San Francisco (87.0%).
Below are market-by-market breakdowns for prices, inventory, new listings and sales for markets with populations of 750,000 or more. For downloadable data on all of the markets Redfin tracks, visit the Redfin Data Center.
Median Sale Price
| Redfin Metro | Median Sale Price | Month-Over-Month | Year-Over-Year |
|---|---|---|---|
| Albany, NY | $265,000 | 2.0% | 10.9% |
| Allentown, PA | $260,000 | 0.0% | 5.5% |
| Anaheim, CA | $927,500 | 0.8% | 16.7% |
| Atlanta, GA | $349,300 | 1.2% | 23.4% |
| Austin, TX | $478,800 | 3.0% | 31.2% |
| Bakersfield, CA | $325,000 | -1.5% | 14.0% |
| Baltimore, MD | $330,000 | -1.5% | 2.3% |
| Baton Rouge, LA | $245,400 | 3.1% | 6.4% |
| Birmingham, AL | $262,100 | 0.8% | 9.7% |
| Boston, MA | $610,000 | 2.5% | 10.9% |
| Bridgeport, CT | $480,000 | 2.1% | 3.2% |
| Buffalo, NY | $209,800 | -2.4% | 14.1% |
| Camden, NJ | $265,000 | 0.0% | 10.4% |
| Charleston, SC | $364,400 | -0.2% | 12.1% |
| Charlotte, NC | $360,400 | 4.1% | 20.9% |
| Chicago, IL | $290,000 | 0.7% | 8.2% |
| Cincinnati, OH | $241,000 | 0.5% | 10.3% |
| Cleveland, OH | $187,500 | -1.3% | 7.1% |
| Columbus, OH | $274,900 | 0.9% | 13.5% |
| Dallas, TX | $381,000 | 0.3% | 18.3% |
| Dayton, OH | $180,000 | 0.0% | 12.6% |
| Denver, CO | $538,000 | 1.5% | 17.0% |
| Detroit, MI | $180,000 | 2.9% | 12.5% |
| El Paso, TX | $210,000 | 3.5% | 16.0% |
| Elgin, IL | $285,000 | 5.3% | 9.3% |
| Fort Lauderdale, FL | $360,000 | 2.9% | 13.9% |
| Fort Worth, TX | $323,000 | 0.9% | 21.4% |
| Frederick, MD | $490,000 | -2.0% | 8.9% |
| Fresno, CA | $379,200 | 2.5% | 18.5% |
| Grand Rapids, MI | $270,000 | 3.1% | 17.3% |
| Greensboro, NC | $230,000 | 0.0% | 12.2% |
| Greenville, SC | $287,000 | 1.8% | 16.7% |
| Hartford, CT | $275,000 | 1.9% | 7.8% |
| Houston, TX | $313,300 | 2.7% | 16.5% |
| Indianapolis, IN | $250,000 | -0.3% | 11.8% |
| Jacksonville, FL | $322,900 | 2.5% | 20.5% |
| Kansas City, MO | $270,000 | 0.0% | 8.0% |
| Knoxville, TN | $300,000 | 5.3% | 20.7% |
| Lake County, IL | $284,000 | -0.4% | 10.9% |
| Las Vegas, NV | $394,000 | 3.7% | 22.4% |
| Los Angeles, CA | $815,000 | 0.6% | 13.2% |
| Louisville, KY | $235,000 | -1.7% | 6.8% |
| McAllen, TX | $198,000 | 1.5% | 20.0% |
| Memphis, TN | $265,000 | -0.6% | 17.8% |
| Miami, FL | $420,000 | 5.0% | 20.0% |
| Milwaukee, WI | $260,000 | 0.0% | 8.3% |
| Minneapolis, MN | $340,000 | -0.1% | 9.7% |
| Montgomery County, PA | $391,000 | 0.4% | 10.1% |
| Nashville, TN | $397,200 | -1.9% | 18.6% |
| Nassau County, NY | $580,000 | 0.0% | 9.0% |
| New Brunswick, NJ | $426,000 | 0.2% | 12.1% |
| New Haven, CT | $280,000 | 1.2% | 12.0% |
| New Orleans, LA | $270,500 | 0.2% | 4.9% |
| New York, NY | $645,000 | -0.8% | 10.3% |
| Newark, NJ | $450,000 | -1.1% | 4.7% |
| North Port, FL | $403,000 | 3.3% | 27.1% |
| Oakland, CA | $905,000 | -3.2% | 7.7% |
| Oklahoma City, OK | $230,000 | 2.2% | 9.5% |
| Omaha, NE | $257,000 | 2.8% | 6.4% |
| Orlando, FL | $350,000 | 1.4% | 19.9% |
| Oxnard, CA | $796,000 | 3.2% | 12.9% |
| Philadelphia, PA | $265,000 | 1.9% | 8.2% |
| Phoenix, AZ | $430,000 | 1.2% | 27.4% |
| Pittsburgh, PA | $211,200 | 0.5% | 10.1% |
| Portland, OR | $514,000 | -0.2% | 14.2% |
| Providence, RI | $380,000 | 0.3% | 15.2% |
| Raleigh, NC | $396,000 | 1.3% | 24.5% |
| Richmond, VA | $318,300 | -0.5% | 9.8% |
| Riverside, CA | $515,000 | 0.8% | 17.3% |
| Rochester, NY | $183,000 | -1.6% | 7.6% |
| Sacramento, CA | $550,000 | 1.9% | 16.5% |
| Salt Lake City, UT | $485,400 | 2.2% | 24.5% |
| San Antonio, TX | $305,000 | 0.0% | 18.4% |
| San Diego, CA | $775,000 | 2.0% | 17.4% |
| San Francisco, CA | $1,575,000 | 1.0% | 12.5% |
| San Jose, CA | $1,400,000 | 1.4% | 16.7% |
| Seattle, WA | $715,000 | -1.4% | 13.7% |
| St. Louis, MO | $225,000 | 2.9% | 8.0% |
| Tacoma, WA | $505,000 | -1.0% | 16.1% |
| Tampa, FL | $330,000 | 2.6% | 22.2% |
| Tucson, AZ | $323,800 | 1.2% | 22.2% |
| Tulsa, OK | $230,000 | 0.0% | 11.7% |
| Honolulu, HI | $685,000 | -2.1% | 8.7% |
| Virginia Beach, VA | $285,000 | 0.0% | 5.6% |
| Warren, MI | $262,100 | -1.1% | 9.2% |
| Washington, DC | $495,000 | 0.6% | 9.6% |
| West Palm Beach, FL | $400,000 | 6.7% | 25.0% |
| Worcester, MA | $365,000 | 2.1% | 12.9% |
| National | $383,100 | 0.9% | 15.1% |
Homes Sold
| Redfin Metro | Homes Sold | Month-Over-Month | Year-Over-Year |
|---|---|---|---|
| Albany, NY | 1,069 | -3.8% | -3.7% |
| Allentown, PA | 894 | -10.2% | -16.0% |
| Anaheim, CA | 2,566 | -8.3% | -9.3% |
| Atlanta, GA | 8,741 | -6.4% | -5.3% |
| Austin, TX | 2,952 | -4.2% | -12.5% |
| Bakersfield, CA | 857 | -0.6% | 1.4% |
| Baltimore, MD | 4,089 | -3.2% | -1.0% |
| Baton Rouge, LA | 1,008 | 0.4% | -1.1% |
| Birmingham, AL | 1,435 | -1.8% | 0.1% |
| Boston, MA | 4,610 | 6.0% | 0.5% |
| Bridgeport, CT | 1,244 | -6.9% | -18.7% |
| Buffalo, NY | 1,087 | -21.3% | -12.5% |
| Camden, NJ | 1,741 | -8.8% | -4.2% |
| Charleston, SC | 1,507 | -13.5% | -7.8% |
| Charlotte, NC | 4,226 | 7.6% | 3.5% |
| Chicago, IL | 8,387 | -6.3% | 5.3% |
| Cincinnati, OH | 2,752 | -7.7% | -1.6% |
| Cleveland, OH | 2,807 | -6.1% | 9.3% |
| Columbus, OH | 2,733 | -12.2% | 2.4% |
| Dallas, TX | 5,447 | -7.7% | -6.5% |
| Dayton, OH | 1,080 | -7.2% | 2.8% |
| Denver, CO | 5,229 | -4.5% | 2.4% |
| Detroit, MI | 1,869 | -11.3% | -3.6% |
| El Paso, TX | 825 | -4.1% | -1.8% |
| Elgin, IL | 1,048 | -14.1% | -10.7% |
| Fort Lauderdale, FL | 3,004 | -5.0% | -6.4% |
| Fort Worth, TX | 2,902 | -2.9% | 0.3% |
| Frederick, MD | 1,719 | -7.3% | 1.9% |
| Fresno, CA | 778 | -6.4% | 0.4% |
| Grand Rapids, MI | 1,328 | -12.0% | -10.8% |
| Greensboro, NC | 899 | -13.0% | 2.4% |
| Greenville, SC | 1,229 | 4.4% | 8.3% |
| Hartford, CT | 1,637 | -1.9% | -0.8% |
| Houston, TX | 8,534 | -2.9% | 2.3% |
| Indianapolis, IN | 3,277 | -1.6% | 0.7% |
| Jacksonville, FL | 2,926 | -3.0% | 8.3% |
| Kansas City, MO | 3,197 | -6.9% | -2.3% |
| Knoxville, TN | 1,292 | -9.1% | 1.6% |
| Lake County, IL | 1,271 | -4.0% | -1.3% |
| Las Vegas, NV | 4,113 | 6.3% | 9.5% |
| Los Angeles, CA | 6,493 | -4.0% | 6.0% |
| Louisville, KY | 1,712 | -10.6% | -2.8% |
| McAllen, TX | 313 | -16.8% | -17.4% |
| Memphis, TN | 1,346 | -6.5% | -3.2% |
| Miami, FL | 2,858 | -8.8% | 4.8% |
| Milwaukee, WI | 1,932 | -9.0% | -1.9% |
| Minneapolis, MN | 5,600 | -8.1% | -3.4% |
| Montgomery County, PA | 2,463 | -3.6% | -6.9% |
| Nashville, TN | 3,716 | -1.4% | 8.4% |
| Nassau County, NY | 2,535 | -15.4% | -20.6% |
| New Brunswick, NJ | 3,306 | -9.4% | -12.2% |
| New Haven, CT | 1,060 | -10.8% | -11.3% |
| New Orleans, LA | 1,277 | 6.9% | -1.4% |
| New York, NY | 6,344 | -12.5% | 8.6% |
| Newark, NJ | 2,257 | -3.8% | -16.5% |
| North Port, FL | 2,137 | 4.3% | -9.4% |
| Oakland, CA | 2,840 | -2.4% | 0.7% |
| Oklahoma City, OK | 2,033 | -3.9% | 7.0% |
| Omaha, NE | 1,270 | -1.9% | 1.4% |
| Orlando, FL | 4,239 | -3.0% | 3.0% |
| Oxnard, CA | 806 | -1.5% | -2.2% |
| Philadelphia, PA | 2,304 | 1.6% | 0.8% |
| Phoenix, AZ | 8,229 | 0.4% | -4.0% |
| Pittsburgh, PA | 2,439 | -1.9% | 0.7% |
| Portland, OR | 3,674 | -10.3% | -0.3% |
| Providence, RI | 2,033 | 1.6% | -4.1% |
| Raleigh, NC | 2,394 | -3.3% | -3.6% |
| Richmond, VA | 1,925 | -1.9% | 11.1% |
| Riverside, CA | 5,492 | -3.9% | -0.3% |
| Rochester, NY | 1,076 | -17.6% | -12.7% |
| Sacramento, CA | 2,777 | -5.4% | -9.4% |
| Salt Lake City, UT | 1,492 | -4.1% | -11.9% |
| San Antonio, TX | 2,643 | -13.9% | -14.6% |
| San Diego, CA | 3,089 | -7.3% | -8.0% |
| San Francisco, CA | 1,332 | -1.1% | 12.7% |
| San Jose, CA | 1,553 | -7.1% | 7.1% |
| Seattle, WA | 4,495 | -9.4% | -0.2% |
| St. Louis, MO | 3,763 | -5.6% | -1.0% |
| Tacoma, WA | 1,532 | -5.7% | 1.1% |
| Tampa, FL | 5,978 | -0.8% | 3.3% |
| Tucson, AZ | 1,580 | 8.9% | 6.5% |
| Tulsa, OK | 1,398 | -6.8% | 11.4% |
| Honolulu, HI | 946 | -2.8% | 31.2% |
| Virginia Beach, VA | 2,637 | -9.4% | 9.6% |
| Warren, MI | 3,684 | -10.2% | -3.7% |
| Washington, DC | 6,881 | -0.9% | 1.9% |
| West Palm Beach, FL | 2,805 | -5.1% | -7.5% |
| Worcester, MA | 1,158 | -0.4% | -0.9% |
| National | 616,500 | 0.8% | -5.8% |
New Listings
| Redfin Metro | New Listings | Month-Over-Month | Year-Over-Year |
|---|---|---|---|
| Albany, NY | 877 | -17.4% | -3.7% |
| Allentown, PA | 396 | -43.2% | -51.5% |
| Anaheim, CA | 1,915 | -21.8% | -17.9% |
| Atlanta, GA | 7,458 | -20.6% | -4.8% |
| Austin, TX | 2,869 | -20.5% | 8.3% |
| Bakersfield, CA | 725 | -18.0% | -7.1% |
| Baltimore, MD | 3,217 | -24.3% | -7.0% |
| Baton Rouge, LA | 405 | -45.0% | -55.2% |
| Birmingham, AL | 1,231 | -15.0% | -9.5% |
| Boston, MA | 3,361 | -27.5% | -4.7% |
| Bridgeport, CT | 888 | -27.1% | -18.5% |
| Buffalo, NY | 907 | -24.7% | 5.3% |
| Camden, NJ | 1,441 | -19.2% | -14.1% |
| Charleston, SC | 1,312 | -14.9% | -2.9% |
| Charlotte, NC | 2,578 | -31.6% | -25.5% |
| Chicago, IL | 6,237 | -30.3% | -5.8% |
| Cincinnati, OH | 2,254 | -24.1% | -4.1% |
| Cleveland, OH | 2,330 | -26.0% | 3.4% |
| Columbus, OH | 2,252 | -23.1% | 1.8% |
| Dallas, TX | 5,041 | -14.5% | 1.0% |
| Dayton, OH | 876 | -29.0% | -7.7% |
| Denver, CO | 3,502 | -29.7% | 1.1% |
| Detroit, MI | 2,050 | -10.3% | 20.3% |
| El Paso, TX | 753 | -9.1% | -5.3% |
| Elgin, IL | 785 | -23.8% | 6.9% |
| Fort Lauderdale, FL | 2,738 | -16.0% | -18.3% |
| Fort Worth, TX | 2,598 | -19.0% | 2.9% |
| Frederick, MD | 1,228 | -30.7% | -12.2% |
| Fresno, CA | 686 | -18.5% | 2.8% |
| Grand Rapids, MI | 1,007 | -27.7% | 1.4% |
| Greensboro, NC | 531 | -34.6% | -33.3% |
| Greenville, SC | 1,089 | -18.1% | 0.0% |
| Hartford, CT | 1,234 | -19.9% | -9.2% |
| Houston, TX | 8,395 | -12.7% | 4.3% |
| Indianapolis, IN | 2,913 | -18.7% | 8.9% |
| Jacksonville, FL | 2,582 | -16.7% | 4.4% |
| Kansas City, MO | 2,433 | -27.4% | -8.2% |
| Knoxville, TN | 876 | -23.3% | -22.1% |
| Lake County, IL | 823 | -30.8% | -8.4% |
| Las Vegas, NV | 3,389 | -19.8% | 1.4% |
| Los Angeles, CA | 5,129 | -26.2% | -14.6% |
| Louisville, KY | 1,530 | -19.8% | -0.3% |
| McAllen, TX | 491 | -6.5% | 1.4% |
| Memphis, TN | 1,382 | -13.4% | 6.1% |
| Miami, FL | 3,294 | -12.3% | -2.7% |
| Milwaukee, WI | 1,393 | -30.9% | 4.3% |
| Minneapolis, MN | 3,600 | -34.9% | -0.1% |
| Montgomery County, PA | 1,934 | -19.4% | 0.8% |
| Nashville, TN | 2,831 | -18.1% | -9.4% |
| Nassau County, NY | 2,217 | -23.6% | -16.1% |
| New Brunswick, NJ | 2,520 | -24.6% | -13.3% |
| New Haven, CT | 800 | -24.1% | -18.7% |
| New Orleans, LA | 1,160 | -15.0% | -14.4% |
| New York, NY | 6,227 | -26.2% | -7.1% |
| Newark, NJ | 1,715 | -23.7% | -17.1% |
| North Port, FL | 2,026 | -8.2% | -6.5% |
| Oakland, CA | 1,773 | -38.4% | -18.7% |
| Oklahoma City, OK | 1,876 | -15.5% | 3.1% |
| Omaha, NE | 858 | -29.3% | 0.9% |
| Orlando, FL | 3,677 | -17.2% | -6.0% |
| Oxnard, CA | 555 | -26.2% | -12.6% |
| Philadelphia, PA | 2,267 | -20.6% | -2.1% |
| Phoenix, AZ | 7,307 | -16.9% | -2.5% |
| Pittsburgh, PA | 2,067 | -20.7% | 11.4% |
| Portland, OR | 2,545 | -29.7% | 1.6% |
| Providence, RI | 1,628 | -23.4% | -4.9% |
| Raleigh, NC | 1,882 | -24.4% | -3.2% |
| Richmond, VA | 1,413 | -24.1% | -4.5% |
| Riverside, CA | 4,770 | -20.4% | -0.5% |
| Rochester, NY | 823 | -22.2% | -2.4% |
| Salt Lake City, UT | 536 | -54.5% | -54.6% |
| San Antonio, TX | 2,820 | -14.7% | 1.0% |
| San Diego, CA | 2,418 | -19.3% | -10.4% |
| San Francisco, CA | 639 | -53.0% | -31.9% |
| San Jose, CA | 906 | -35.4% | -13.0% |
| Seattle, WA | 2,855 | -31.8% | -4.5% |
| St. Louis, MO | 1,778 | -46.0% | -39.5% |
| Tacoma, WA | 1,091 | -30.4% | 3.0% |
| Tampa, FL | 5,400 | -16.1% | 1.2% |
| Tucson, AZ | 1,360 | -21.6% | -1.4% |
| Tulsa, OK | 1,238 | -12.1% | 6.8% |
| Honolulu, HI | 765 | -16.3% | -12.1% |
| Virginia Beach, VA | 2,306 | -16.9% | 2.7% |
| Warren, MI | 3,011 | -23.1% | 1.1% |
| Washington, DC | 4,874 | -30.0% | -14.6% |
| West Palm Beach, FL | 2,917 | -7.9% | -12.8% |
| Worcester, MA | 915 | -19.9% | 2.0% |
| National | 643,400 | 0.1% | -8.7% |
All Homes for Sale
| Redfin Metro | All Homes for Sale | Month-Over-Month | Year-Over-Year |
|---|---|---|---|
| Albany, NY | 2,722 | -12.7% | -17.2% |
| Allentown, PA | 1,365 | -28.0% | -38.1% |
| Anaheim, CA | 5,172 | -17.9% | -39.3% |
| Atlanta, GA | 19,328 | -11.1% | -21.9% |
| Austin, TX | 8,493 | -9.5% | 3.5% |
| Bakersfield, CA | 1,976 | -11.7% | -9.4% |
| Baltimore, MD | 9,286 | -14.1% | -7.7% |
| Baton Rouge, LA | 1,675 | -24.6% | -50.6% |
| Birmingham, AL | 3,903 | -9.7% | -25.5% |
| Boston, MA | 9,833 | -19.3% | -21.5% |
| Bridgeport, CT | 4,106 | -16.2% | -31.4% |
| Buffalo, NY | 2,124 | -16.5% | -3.7% |
| Camden, NJ | 4,163 | -11.6% | -14.7% |
| Charleston, SC | 4,622 | -9.0% | -22.5% |
| Charlotte, NC | 8,575 | -16.0% | -31.0% |
| Chicago, IL | 23,324 | -16.1% | -15.3% |
| Cincinnati, OH | 7,954 | -10.3% | -6.8% |
| Cleveland, OH | 7,285 | -12.3% | -4.7% |
| Columbus, OH | 7,072 | -12.8% | -4.3% |
| Dallas, TX | 12,558 | -12.7% | -24.2% |
| Dayton, OH | 2,548 | -13.9% | -10.0% |
| Denver, CO | 7,121 | -24.0% | -15.6% |
| Detroit, MI | 5,821 | -6.7% | 7.3% |
| El Paso, TX | 2,193 | -6.9% | -23.5% |
| Elgin, IL | 2,022 | -14.6% | -10.6% |
| Fort Lauderdale, FL | 10,101 | -9.2% | -36.4% |
| Fort Worth, TX | 6,570 | -11.6% | -14.3% |
| Frederick, MD | 3,587 | -17.7% | -9.0% |
| Fresno, CA | 1,538 | -12.4% | -1.2% |
| Grand Rapids, MI | 2,186 | -18.6% | -13.5% |
| Greensboro, NC | 1,815 | -17.9% | -33.0% |
| Greenville, SC | 3,569 | -7.6% | -19.5% |
| Hartford, CT | 4,259 | -14.8% | -24.1% |
| Houston, TX | 24,452 | -7.8% | -11.3% |
| Indianapolis, IN | 5,924 | -10.8% | -10.4% |
| Jacksonville, FL | 6,863 | -10.9% | -16.3% |
| Kansas City, MO | 6,535 | -17.5% | -15.2% |
| Knoxville, TN | 3,383 | -13.2% | -24.3% |
| Lake County, IL | 2,847 | -17.5% | -20.2% |
| Las Vegas, NV | 9,544 | -9.3% | -20.8% |
| Los Angeles, CA | 17,212 | -14.3% | -24.7% |
| Louisville, KY | 3,944 | -10.1% | -14.4% |
| McAllen, TX | 1,723 | -1.5% | -16.1% |
| Memphis, TN | 3,410 | -20.2% | -20.0% |
| Miami, FL | 14,229 | -6.8% | -22.3% |
| Milwaukee, WI | 6,155 | -13.3% | 3.8% |
| Minneapolis, MN | 11,065 | -19.4% | -6.7% |
| Montgomery County, PA | 5,249 | -13.9% | -12.6% |
| Nashville, TN | 7,760 | -9.4% | -22.6% |
| Nassau County, NY | 8,222 | -12.4% | -25.2% |
| New Brunswick, NJ | 9,195 | -13.3% | -13.7% |
| New Haven, CT | 3,269 | -13.9% | -21.5% |
| New Orleans, LA | 3,394 | -12.9% | -23.7% |
| New York, NY | 33,619 | -8.5% | -24.5% |
| Newark, NJ | 6,742 | -11.6% | -21.5% |
| North Port, FL | 3,769 | -8.7% | -41.2% |
| Oakland, CA | 4,178 | -26.3% | -16.9% |
| Oklahoma City, OK | 4,553 | -8.6% | -5.8% |
| Omaha, NE | 1,923 | -17.8% | -10.0% |
| Orlando, FL | 8,218 | -13.2% | -32.3% |
| Oxnard, CA | 1,694 | -17.3% | -22.0% |
| Philadelphia, PA | 8,255 | -8.2% | -3.5% |
| Phoenix, AZ | 18,428 | -8.7% | -13.4% |
| Pittsburgh, PA | 9,271 | -8.3% | -2.0% |
| Portland, OR | 6,008 | -21.0% | -10.3% |
| Providence, RI | 4,873 | -11.7% | -13.4% |
| Raleigh, NC | 5,062 | -13.6% | -29.1% |
| Richmond, VA | 3,076 | -18.4% | -16.4% |
| Riverside, CA | 13,753 | -11.4% | -10.1% |
| Rochester, NY | 1,780 | -22.0% | -23.8% |
| Sacramento, CA | 4,923 | -19.6% | -48.0% |
| Salt Lake City, UT | 1,596 | -37.9% | -50.1% |
| San Antonio, TX | 7,661 | -8.6% | -16.8% |
| San Diego, CA | 5,081 | -16.5% | -25.3% |
| San Francisco, CA | 2,507 | -25.0% | -39.6% |
| San Jose, CA | 2,091 | -28.6% | -34.3% |
| Seattle, WA | 5,453 | -27.9% | -29.1% |
| St. Louis, MO | 6,465 | -25.6% | -33.3% |
| Tacoma, WA | 2,238 | -21.3% | 1.7% |
| Tampa, FL | 10,737 | -12.3% | -24.5% |
| Tucson, AZ | 4,361 | -6.4% | -7.0% |
| Tulsa, OK | 2,843 | -10.9% | -12.4% |
| Honolulu, HI | 3,050 | -6.7% | -19.5% |
| Virginia Beach, VA | 5,914 | -12.1% | -5.8% |
| Warren, MI | 8,227 | -15.1% | -6.8% |
| Washington, DC | 15,942 | -16.3% | -5.7% |
| West Palm Beach, FL | 9,019 | -6.6% | -38.5% |
| Worcester, MA | 2,418 | -16.0% | -7.6% |
| National | 1,360,200 | -2.5% | -18.0% |


