
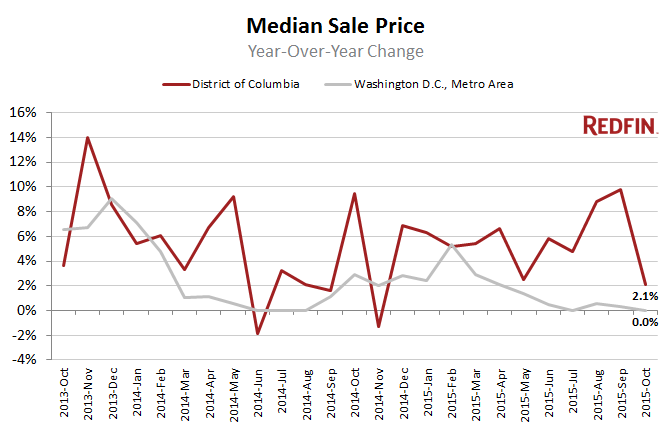
Washington, D.C., home prices rose 2.1 percent in October from a year earlier, to a median sale price of $499,000. It was the 11th-straight month of growth, but the smallest increase so far this year.
The District of Columbia has been insulated from the price slowdown in the broader DC-MD-VA metro region, where price growth has been sluggish for several months, hovering at or just above zero since June.
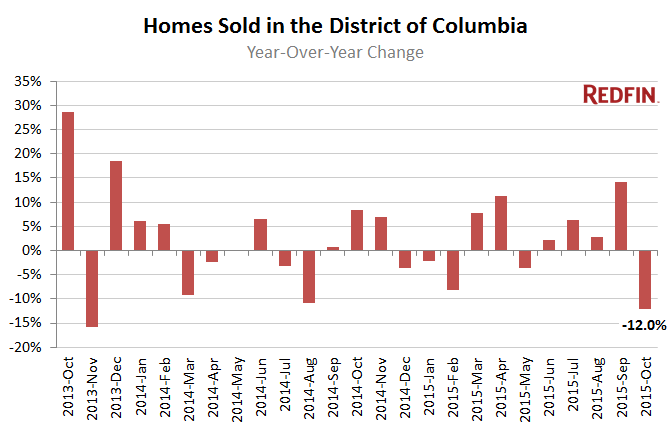
Sales in the city fell 12 percent from a year earlier but were up 2.9 percent across the broader region.
The total number of homes for sale was essentially flat compared to last year, leaving the city with 2.5 months of supply. That’s the most inventory the district has had since February, but still well below the six months that signals a balanced market. Across the metro area, inventory was flat and there were 3.8 months of supply.
Buyers Hunting for Deals
Redfin agents in the district say seasonality is one reason for October’s slow sales and modest price growth, but they also sense a subtle shift in the market that might be more than a seasonal chill.
“Buyers don’t seem to have the same level of urgency as they did over the summer and are less eager to make an offer. If they don’t see a home they like or think a home is overpriced, they’re walking away and waiting until more inventory hits in the spring,” Redfin agent Kas Divband said.
Divband said sellers today need to be especially careful when it comes to pricing. List prices in October were up 10.2 percent over last year, while sale prices were up only 2.1 percent, indicating that some sellers have unrealistic expectations for what their home can fetch.
“Both sellers and buyers are overestimating sellers’ control over the market right now,” said Divband. “Buyers are ignoring homes that are overpriced, rather than reaching out to see if the seller is willing to compromise. My advice is to make an offer. Buyers might be surprised at what they’re able to negotiate.”
Hot Neighborhoods
Homes priced correctly continue to sell fast; the typical home in the city was on the market for 10 days before going under contract.
Navy Yard, Congress Heights, Deanwood and Woodridge saw prices rise more than 50 percent over the last three months compared to last year. Prices fell the most in Edgewood–37.6 percent–followed by Massachusetts Avenue Heights, down 14.9 percent.
Homes in Georgetown, the U Street Corridor, Le Droit Park, Logan Circle and Shaw were the priciest per square foot, at over $600. For value, look to Deanwood and Bellevue / Congress Heights / Washington Highlands where homes are going for less than $175 per square foot.
See our city page for the most up-to-date data on Washington-area home prices.
Here’s what’s happening in your neighborhood:
| Neighborhood | Median Sale Price | Year-Over-Year | Homes sold | Year-Over-Year | Inventory | Year-Over-Year |
|---|---|---|---|---|---|---|
| 16th Street Heights | $700,000 | 26.6% | 43 | -6.5% | 39 | -4.9% |
| Adams Morgan / Kalorama Heights / Lanier Heights | $499,900 | 0.2% | 121 | 36.0% | 96 | -17.9% |
| American University Park / Friendship Heights / Tenleytown | $976,200 | 6.2% | 41 | -12.8% | 30 | -28.6% |
| Anacostia | $299,000 | 32.9% | 14 | 40.0% | 25 | 31.6% |
| Atlas District | $615,000 | -4.4% | 47 | 17.5% | 52 | 13.0% |
| Bellevue / Congress Heights / Washington Highlands | $210,000 | 7.7% | 33 | 37.5% | 67 | 1.5% |
| Benning Heights / Capitol View / Marshall Heights | $182,500 | -7.1% | 30 | 11.1% | 54 | -37.2% |
| Bloomingdale | $667,500 | 2.7% | 36 | 9.1% | 35 | -12.5% |
| Capitol Hill | $800,500 | 10.4% | 100 | -1.0% | 85 | 14.9% |
| Chevy Chase | $905,000 | 7.7% | 56 | 24.4% | 61 | 10.9% |
| Chinatown / Mount Vernon Square / Penn Quarters | $489,900 | 5.4% | 85 | -17.5% | 96 | 11.6% |
| Cleveland Park | $510,000 | 20.1% | 43 | 19.4% | 28 | 12.0% |
| Columbia Heights | $527,950 | 4.6% | 101 | 8.6% | 90 | 11.1% |
| Congress Heights | $261,000 | 70.6% | 16 | 60.0% | 38 | 31.0% |
| Deanwood | $282,000 | 64.9% | 19 | 26.7% | 27 | -30.8% |
| Dupont Circle | $457,500 | 11.6% | 108 | -8.5% | 88 | -2.2% |
| Eckington | $623,750 | 27.0% | 24 | 9.1% | 23 | -4.2% |
| Edgewood | $341,500 | -37.6% | 16 | -38.5% | 18 | 12.5% |
| Fairlawn / Twining / Randle Highlands / Penn Branch | $285,000 | -5.0% | 38 | 26.7% | 38 | -19.1% |
| Foggy Bottom / George Washington University / West End | $493,100 | 13.4% | 62 | -4.6% | 79 | 5.3% |
| Fort Totten / Lamont Riggs / Pleasant Hill / Queens Chapel | $385,000 | 15.1% | 29 | -23.7% | 39 | 30.0% |
| Foxhall / Palisades / Spring Valley / Wesley Heights | $1,250,000 | 6.4% | 43 | -12.2% | 82 | 24.2% |
| Georgetown | $1,282,500 | 6.9% | 50 | 6.4% | 84 | 3.7% |
| Glover Park / Cathedral Heights / McLean Gardens | $422,750 | 16.2% | 98 | -2.0% | 125 | 15.7% |
| Greenway / Benning / Dupont Park / River Terrace | $253,500 | 10.3% | 24 | 71.4% | 16 | -33.3% |
| Hill East | $699,900 | 7.5% | 72 | 38.5% | 43 | -12.2% |
| Howard University / Le Droit Park | $633,700 | -1.1% | 66 | 73.7% | 55 | 19.6% |
| Kingman Park | $465,000 | 15.4% | 30 | 3.4% | 42 | 13.5% |
| Logan Circle | $554,500 | -1.0% | 160 | -12.1% | 157 | -1.3% |
| Massachusetts Avenue Heights | $317,000 | -14.9% | 38 | 5.6% | 36 | -12.2% |
| Mount Pleasant | $665,000 | -8.8% | 27 | -18.2% | 16 | 45.5% |
| Navy Yard | $795,000 | 73.4% | 8 | -46.7% | 6 | 20.0% |
| NoMa | $651,500 | -1.4% | 20 | -23.1% | 32 | 113.3% |
| Petworth | $643,700 | 11.9% | 62 | 3.3% | 57 | -8.1% |
| Pleasant Plains | $490,000 | -0.6% | 27 | 3.8% | 26 | 13.0% |
| Shaw | $585,000 | -6.4% | 19 | -34.5% | 29 | 0.0% |
| Southwest / Waterfront | $325,000 | 5.3% | 60 | -7.7% | 36 | -16.3% |
| Stanton Park | $633,000 | 2.6% | 86 | 4.9% | 74 | -11.9% |
| Takoma Park | $667,500 | -1.8% | 16 | -15.8% | 21 | 10.5% |
| Trinidad / Arboretum / Ivy City | $412,500 | 13.0% | 51 | 64.5% | 54 | 22.7% |
| Truxton Circle | $699,900 | 32.8% | 19 | 18.8% | 22 | -21.4% |
| U Street Corridor | $590,000 | -8.9% | 64 | -4.5% | 44 | 0.0% |
| Union Station / Kingman Park / Stanton Park | $563,000 | -4.6% | 116 | -0.9% | 125 | 6.8% |
| Van Ness / Forest Hills / Wakefield | $501,000 | 28.5% | 29 | -12.1% | 32 | -8.6% |
| Woodley Park | $696,250 | 14.1% | 12 | -42.9% | 13 | -27.8% |
| Woodridge | $575,000 | 57.5% | 13 | -43.5% | 19 | -17.4% |
| Washington, DC | $499,486 | 2.1% | 691 | -12.0% | 1,701 | -0.7% |
NOTE: Not all neighborhoods are listed, but totals for Washington, D.C., encompass entire city. Data is based on listing information and might not reflect all real estate activity in the market. Neighborhood-specific data is measured over the three months ended Oct. 31. Inventory measures listings active as of Oct. 31.
For more information, contact Redfin journalist services:
Phone: 206-588-6863
Email: press@redfin.com
Want to receive information like this every month? Click here join our media email list.


