
Homebuyers are seeking out less expensive locales like Tampa and San Antonio, partly because the surging cost of housing and other goods is limiting their ability to buy homes in many U.S. cities.
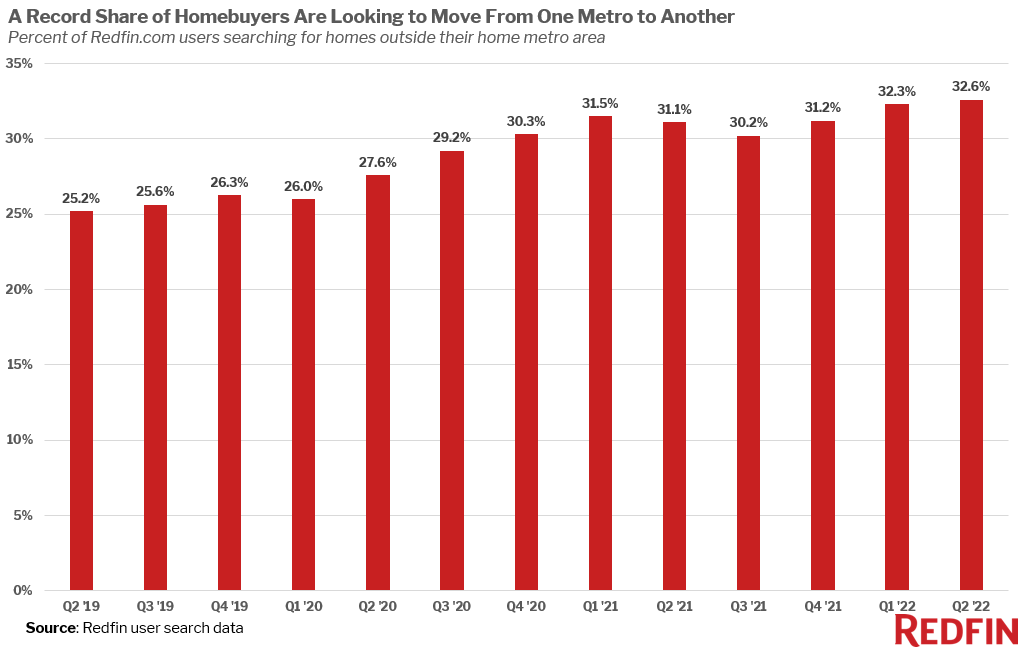
A record 32.6% of Redfin.com users nationwide looked to move from one metro to another in the second quarter, up slightly from 32.3% in the first quarter and roughly 26% before the pandemic.
The housing market has slowed following a pandemic-driven buying frenzy, with home sales falling and supply starting to rise due to rising mortgage rates, high home prices, inflation and a faltering economy. But the people who can still afford to buy continue to relocate at unprecedented levels, largely because surging housing costs are putting expensive metros further out of reach. That makes relatively affordable places like Tampa and San Antonio more attractive.
“The typical home in San Francisco or San Jose now costs more than $1.5 million. Add in today’s 5%-plus mortgage rates and you have a sky-high monthly payment,” said Redfin Deputy Chief Economist Taylor Marr. “Those factors, along with more companies giving employees the permanent flexibility to work remotely, are driving a larger portion of buyers to consider homes in other parts of the country. Someone who would have to stretch beyond their budget in Los Angeles may be able to comfortably afford a home in Phoenix or San Antonio.”
Florida is seeing more homebuyers move in than a year ago
Miami was the most popular migration destination in the second quarter, unchanged from the first quarter. Popularity is measured by net inflow, or how many more Redfin.com users looked to move into an area than leave.
Another Florida metro, Tampa, came in second, followed by Phoenix, Sacramento and Las Vegas. Cape Coral, FL, San Diego, North Port, FL, San Antonio, TX and Dallas round out the top 10. Warm, Sun Belt metros are perennial favorites for relocators.
Migration into Florida continues to pick up, with net inflow into Miami, Tampa, Cape Coral and North Port higher than it was a year earlier. New York and Chicago are the most common origins of homebuyers looking to move into those metros.
“Tampa is still attracting a lot of out-of-state homebuyers, coming from places like New York, who can get more for their money in Florida,” said Eric Auciello, a Redfin manager in Tampa. “The spike in mortgage rates has priced some buyers out of the market, but it has also helped ease competition and curb bidding wars between locals and out of towners. A lot of buyers who kept getting outbid at the peak of the market are now getting their offers accepted, and in some cases they’re even able to use FHA loans, make smaller down payments and keep the appraisal contingency.”
That marks a shift from the height of the pandemic buying frenzy, when sellers were often more likely to accept offers that used conventional loans and waived contingencies.
Movement into San Diego and San Antonio is also on the upswing, with higher net inflow in the second quarter than a year earlier. Los Angeles is a common origin for people relocating to both of those places.
Meanwhile, net inflow into Phoenix, Sacramento, Las Vegas and Dallas has started to slow down from last year. That’s partly because home prices have risen so much in those areas, taking them from relatively affordable to not-so-affordable. Prices in Phoenix, for instance, rose 20% year over year to $485,000 in June, and in Las Vegas they rose 23% to $450,000. Still, these places are significantly more affordable than coastal hubs like San Francisco and New York.
Top 10 Metros by Net Inflow of Users and Their Top Origins
| Rank | Metro* | Net Inflow, Q2 2022† | Net Inflow, Q2 2021 | Portion of Searches from Users Outside the Metro, Q2 2022 | Portion of Searches from Users Outside the Metro, Q2 2021 | Top Origin | Top Out-of-State Origin |
|---|---|---|---|---|---|---|---|
| 1 | Miami, FL | 12,614 | 9,830 | 33.3% | 31.5% | New York, NY | New York, NY |
| 2 | Tampa, FL | 9,841 | 7,939 | 49.3% | 55.3% | Orlando, FL | New York, NY |
| 3 | Phoenix, AZ | 9,730 | 11,464 | 36.3% | 37.5% | Los Angeles, CA | Los Angeles, CA |
| 4 | Sacramento, CA | 9,640 | 9,742 | 42.5% | 47.3% | San Francisco, CA | Seattle, WA |
| 5 | Las Vegas, NV | 8,597 | 10,984 | 46.2% | 50.0% | Los Angeles, CA | Los Angeles, CA |
| 6 | Cape Coral, FL | 7,015 | 6,464 | 67.1% | 74.9% | Chicago, IL | Chicago, IL |
| 7 | San Diego, CA | 6,804 | 3,100 | 31.9% | 28.8% | Los Angeles, CA | Seattle, WA |
| 8 | North Port, FL | 6,626 | 5,167 | 66.8% | 75.8% | Chicago, IL | Chicago, IL |
| 9 | San Antonio, TX | 5,335 | 4,356 | 41.8% | 44.7% | Austin, TX | Los Angeles, CA |
| 10 | Dallas, TX | 4,964 | 7,458 | 24.8% | 28.4% | Los Angeles, CA | Los Angeles, CA |
*Combined statistical areas with at least 500 users in Q2 2022
†Among the two million users sampled for this analysis only
Migration out of San Francisco is increasing, while migration out of New York is declining
San Francisco had the highest net outflow of any major U.S. metro in the second quarter, unchanged from the first quarter. Net outflow is a measure of how many more Redfin.com users looked to leave a metro area than move in.
Los Angeles, New York, Washington, D.C. and Seattle round out the top five; it’s typical that homebuyers look to move out of expensive job centers.
As permanent remote work becomes the norm for many workers, even more homebuyers are moving out of most of those expensive cities than a year ago. Net outflow increased year over year in four of the five top places people are leaving. One exception is New York, where outflow is slowing.
Top 10 Metros by Net Outflow of Users and Their Top Destinations
| Rank | Metro* | Net Outflow, Q2 2022† | Net Outflow. Q2 2021 | Portion of Local Users Searching Elsewhere, Q2 2022 | Portion of Local Users Searching Elsewhere, Q2 2021 | Top Destination | Top Out-of-State Destination |
|---|---|---|---|---|---|---|---|
| 1 | San Francisco, CA | 48,718 | 45,703 | 23.2% | 23.9% | Sacramento, CA | Seattle, WA |
| 2 | Los Angeles, CA | 40,632 | 33,712 | 19.4% | 18.6% | San Diego, CA | Phoenix, AZ |
| 3 | New York, NY | 35,165 | 48,731 | 28.4% | 34.3% | Philadelphia, PA | Philadelphia, PA |
| 4 | Washington, DC | 24,492 | 18,179 | 16.7% | 15.0% | Salisbury, MD | Salisbury, MD |
| 5 | Seattle, WA | 18,594 | 6,177 | 17.6% | 15.4% | Phoenix, AZ | Phoenix, AZ |
| 6 | Boston, MA | 12,493 | 5,023 | 18.1% | 15.3% | Portland, ME | Portland, ME |
| 7 | Detroit, MI | 7,334 | 3,192 | 34.2% | 26.8% | Cleveland, OH | Cleveland, OH |
| 8 | Denver, CO | 5,635 | 9,065 | 29.4% | 30.4% | Chicago, IL | Chicago, IL |
| 9 | Chicago, IL | 4,769 | 7,115 | 13.6% | 12.8% | Cape Coral, FL | Cape Coral, FL |
| 10 | Minneapolis, MN | 2,795 | 10 | 24.5% | 20.9% | Chicago, IL | Chicago, IL |
*Combined statistical areas with at least 500 users in Q2 2022
†Among the two million users sampled for this analysis only
Methodology
The latest migration analysis is based on a sample of about two million Redfin.com users who searched for homes across more than 100 metro areas in the second quarter, excluding searches unlikely to precede an actual relocation or home purchase. To be included in this dataset, a Redfin.com user must have viewed at least 10 homes in a particular metro area, and homes in that area must have made up at least 80% of the user’s searches. Redfin’s migration data goes back to 2017. We published April and May homebuyer migration data last month; the data in this report covers the entire second quarter.


