
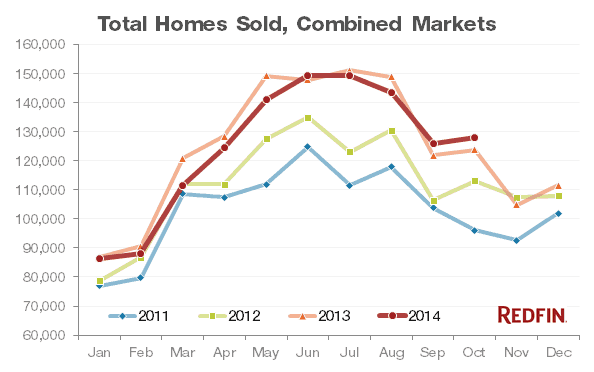
The number of homes sold was up 2.2 percent year over year in October, making it the first month of 2014 during which home sales clearly outpaced 2013. September’s growth was essentially flat at 0.3 percent, and every other month this year has seen a year-over-year decline in homes sales. So why the uptick now?
The housing market overall benefited in October from a dip in mortgage rates to under 4 percent, a drop in unemployment to 5.8 percent and a continuing slowdown in home price appreciation to 3.8 percent year over year. But when we look deeper at the markets with the strongest sales growth year over year, two other factors played a key role: income growth and, even more important, September’s much-awaited increase in the number of homes for sale, which gave buyers a reason to act in October.
![]()
Higher Wages, More Home Sales
In the five metro areas that saw the strongest year-over-year sales growth in October, median incomes have increased from last year, with the exception of Orlando, which has strong investor home-buying activity. Income growth was not the only factor affecting home sales (urban economies are too complex to boil housing activity down to a single criterion), nor did wage growth have to be dramatic. For example, home sales in Raleigh-Durham were up 13 percent from last year, as a relatively flat income increase still outpaced mild house price appreciation.

In the five places with the strongest declines in year-over-year sales growth, median incomes dropped or were essentially flat when compared with last year. In these markets, home prices also rose significantly since last year.
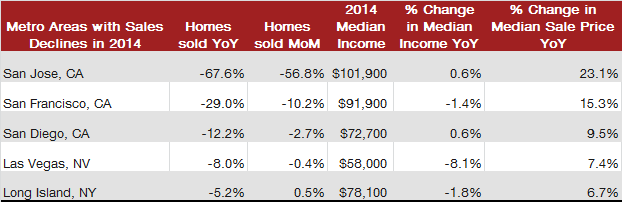
An increase in home sales is a positive sign, but for a housing market to be healthy and sustainable over the long term, incomes must increase as home prices rise. But wages nationally have barely kept up with inflation, let alone house prices, especially in high-cost areas like San Francisco and Long Island where prices have risen by 15 percent and 6.4 percent respectively since last year, while median incomes dropped by 1.4 percent and 1.8 percent.
Buyers Welcome Increase in Supply
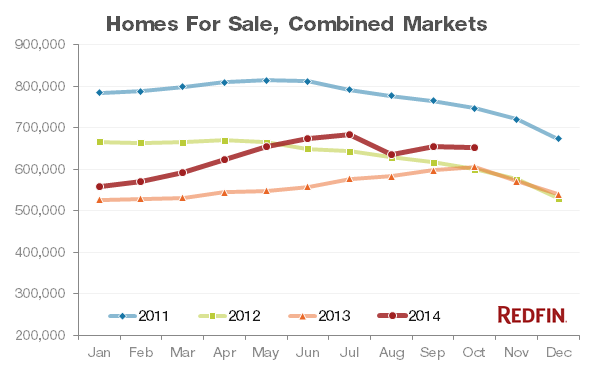
Two months ago, when demand was strong but supply was lacking, we predicted that an increase in homes for sale would translate into more sales this fall. In the past two months the number of homes for sale was up 9 percent over last year.
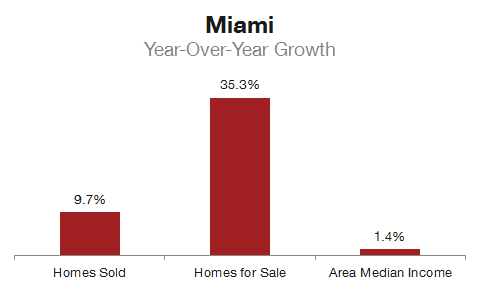
The three metros with the biggest increases in homes sold in October also had strong increases in fall inventory over last year. In Miami, sales were up 21.2 percent in October, while the number of homes for sale was 42 percent higher than last year. In Ventura County, October sales were up 9.3 percent from September, and fall inventory was up 26 percent. Finally, in Los Angeles, the number of homes sold increased by 8.8 percent last month, while fall supply had increased by 29 percent year over year.
The number of new listings in September and October outpaced 2013’s level by 12.9 percent. In Tampa and Orlando, which had the strongest sales growth, new listings were up 3.7 percent and 12 percent, respectively, over last year. By comparison, San Francisco and San Jose, which saw huge declines in homes sold, saw new listings also drop by 2.8 percent and 3.4 percent, respectively, over the same time period.

In Miami, sales, inventory and income growth all came together in October and buyers showed up. “This fall we’ve had several homebuyers, particularly those searching for luxury homes, return to the market after taking a break earlier this year,” said Aaron Drucker, Redfin agent in Miami.
… And Shun Outsized Prices
As we’ve pointed out before, affordable homes have been hard to come by this year, but the continuing moderation in price growth is helping, albeit slowly. Year-over-year median home price growth was 3.8 percent in October, the lowest rate of appreciation since January 2012. In most areas where prices slowed in October, buyers took notice and we saw a pickup in sales. Inversely, where prices remained stubbornly high, buyers stepped back. And the number of homes that sold above list was 16.5 percent in October, the lowest level since February 2012 and an indication that prices are cresting to a rate more consistent with inflation and income growth as we approach the end of the year.

Median Sale Price
| Metro name | Median sale price | Month-over Month Change |
Year-Over- Year Change |
|---|---|---|---|
| Atlanta, GA | $ 170,400 | +0.2% |
+13.6%
|
| Austin, TX | $ 241,250 | +0.5% |
+10.4%
|
| Baltimore, MD | $ 237,700 | -3.0% |
-1.0%
|
| Boston, MA | $ 332,000 | -1.6% |
+2.2%
|
| Boulder, CO | $ 340,900 | -5.0% |
-1.7%
|
| Charlotte, NC | $ 180,000 | -3.0% |
+1.1%
|
| Chicago, IL | $ 186,000 | -4.6% |
+6.3%
|
| Dallas-Fort Worth, TX | $ 215,000 | +4.9% |
+13.9%
|
| Denver, CO | $ 272,500 | +0.2% |
+9.9%
|
| Fort Lauderdale, FL | $ 175,000 | -5.4% |
+6.1%
|
| Fresno, CA | $ 206,500 | -4.0% |
+11.6%
|
| Hampton Roads, VA | $ 205,000 | -2.1% |
+5.1%
|
| Houston, TX | $ 230,850 | +4.9% |
+19.0%
|
| Hudson Valley, NY | $ 389,450 | -5.5% |
+1.2%
|
| Las Vegas, NV | $ 184,700 | -0.3% |
+7.4%
|
| Long Island, NY | $ 365,000 | -3.9% |
-1.4%
|
| Los Angeles, CA | $ 480,000 | +0.2% |
+6.7%
|
| Miami, FL | $ 219,000 | -0.5% |
+14.1%
|
| Minneapolis-St. Paul, MN | $ 207,250 | +1.1% |
+6.3%
|
| Oakland, CA | $ 530,000 | -0.9% |
+8.9%
|
| Orange County, CA | $ 566,650 | +1.2% |
+8.0%
|
| Orlando, FL | $ 163,500 | -3.5% |
+4.1%
|
| Philadelphia, PA | $ 222,500 | -1.1% |
-1.1%
|
| Phoenix, AZ | $ 195,500 | +0.3% |
+3.7%
|
| Portland, OR | $ 280,000 | 0.0% |
+6.7%
|
| Providence, RI | $ 257,500 | +1.0% |
+5.1%
|
| Raleigh-Durham, NC | $ 215,000 | +0.5% |
+0.3%
|
| Riverside-San Bernardino, CA | $ 280,000 | +1.6% |
+6.3%
|
| Sacramento, CA | $ 295,000 | 0.0% |
+5.8%
|
| San Diego, CA | $ 449,000 | -0.2% |
+9.5%
|
| San Francisco, CA | $ 940,000 | +1.4% |
+15.3%
|
| San Jose, CA | $ 800,000 | +5.1% |
+23.1%
|
| Seattle, WA | $ 369,000 | -2.9% |
+5.4%
|
| Tacoma, WA | $ 232,000 | +1.8% |
+3.1%
|
| Tampa, FL | $ 157,000 | +4.0% |
+8.3%
|
| Tucson, AZ | $ 170,000 | +0.0% |
+6.7%
|
| Ventura County, CA | $ 495,450 | +1.1% |
+7.7%
|
| Washington, DC | $ 358,000 | +1.7% |
+2.3%
|
| West Palm Beach, FL | $ 200,000 | 0.0% |
+11.3%
|
| Combined Markets | $ 273,000 | -1.2% |
+3.8%
|
Homes Sold
| Metro name | Homes sold | Month-over Month Change |
Year-Over- Year Change |
|---|---|---|---|
| Atlanta, GA | 4,950 | +0.6% |
+9.4%
|
| Austin, TX | 2,350 | -4.4% |
+6.4%
|
| Baltimore, MD | 2,650 | -0.9% |
+11.5%
|
| Boston, MA | 4,800 | -0.5% |
+1.9%
|
| Boulder, CO | 400 | +2.8% |
+12.9%
|
| Charlotte, NC | 2,350 | -4.6% |
+9.6%
|
| Chicago, IL | 8,450 | +1.1% |
-3.5%
|
| Dallas-Fort Worth, TX | 6,900 | -4.5% |
+3.0%
|
| Denver, CO | 4,550 | -4.0% |
+10.0%
|
| Fort Lauderdale, FL | 2,650 | +5.5% |
+6.6%
|
| Fresno, CA | 650 | -2.2% |
-1.6%
|
| Hampton Roads, VA | 1,550 | +1.9% |
+2.3%
|
| Houston, TX | 6,350 | -0.1% |
+7.8%
|
| Hudson Valley, NY | 1,000 | -6.3% |
+8.5%
|
| Las Vegas, NV | 2,900 | -0.4% |
-8.0%
|
| Long Island, NY | 2,200 | +0.4% |
-4.2%
|
| Los Angeles, CA | 5,700 | +8.8% |
-2.4%
|
| Miami, FL | 2,900 | +21.2% |
+9.7%
|
| Minneapolis-St. Paul, MN | 4,550 | +0.4% |
+1.5%
|
| Oakland, CA | 2,450 | +0.4% |
+3.6%
|
| Orange County, CA | 2,400 | +5.4% |
-0.3%
|
| Orlando, FL | 3,350 | +3.2% |
+18.9%
|
| Philadelphia, PA | 3,450 | -0.2% |
+6.5%
|
| Phoenix, AZ | 6,000 | -0.4% |
+2.8%
|
| Portland, OR | 3,150 | +2.4% |
+13.7%
|
| Providence, RI | 2,800 | +3.3% |
+4.9%
|
| Raleigh-Durham, NC | 2,350 | +6.3% |
+13.3%
|
| Riverside-San Bernardino, CA | 4,300 | +6.2% |
-1.3%
|
| Sacramento, CA | 2,450 | -0.7% |
-1.8%
|
| San Diego, CA | 2,700 | -2.7% |
-12.2%
|
| San Francisco, CA | 1,100 | -10.2% |
-29.0%
|
| San Jose, CA | 450 | -56.8% |
-67.6%
|
| Seattle, WA | 3,800 | +4.4% |
+2.6%
|
| Tacoma, WA | 1,000 | -3.9% |
+4.9%
|
| Tampa, FL | 4,450 | +4.4% |
+19.7%
|
| Tucson, AZ | 1,000 | +0.5% |
-5.2%
|
| Ventura County, CA | 700 | +9.3% |
+2.9%
|
| Washington, DC | 5,900 | +1.5% |
-2.3%
|
| West Palm Beach, FL | 2,600 | +7.0% |
+2.9%
|
| Combined Markets | 128,000 | +1.7% |
+2.2%
|
Homes Newly Listed for Sale
| Metro name | Homes newly listed for sale | Month-over Month Change |
Year-Over- Year Change |
|---|---|---|---|
| Atlanta, GA | 10,600 | +2.2% |
+5.9%
|
| Austin, TX | 2,850 | +10.8% |
+10.6%
|
| Baltimore, MD | 4,500 | -4.0% |
+10.5%
|
| Boston, MA | 6,650 | -14.7% |
+2.7%
|
| Boulder, CO | 450 | -6.6% |
+1.1%
|
| Charlotte, NC | 2,850 | -4.6% |
+7.1%
|
| Chicago, IL | 13,600 | -10.9% |
+9.3%
|
| Dallas-Fort Worth, TX | 8,150 | -0.4% |
0.0%
|
| Denver, CO | 4,450 | -9.4% |
-0.3%
|
| Fort Lauderdale, FL | 4,800 | +10.7% |
+10.0%
|
| Fresno, CA | 950 | -4.9% |
+19.6%
|
| Hampton Roads, VA | 2,600 | +3.1% |
+10.5%
|
| Houston, TX | 8,050 | +3.4% |
+9.7%
|
| Hudson Valley, NY | 1,400 | -20.3% |
-4.8%
|
| Las Vegas, NV | 4,300 | +1.6% |
-7.5%
|
| Long Island, NY | 3,350 | -6.1% |
+4.1%
|
| Los Angeles, CA | 8,650 | +6.1% |
+11.2%
|
| Miami, FL | 5,450 | +15.1% |
+10.2%
|
| Minneapolis-St. Paul, MN | 6,100 | -19.5% |
+1.6%
|
| Oakland, CA | 2,650 | -10.9% |
-4.8%
|
| Orange County, CA | 3,500 | +2.8% |
+5.2%
|
| Orlando, FL | 4,800 | +4.7% |
+11.6%
|
| Philadelphia, PA | 5,550 | -10.0% |
+6.3%
|
| Phoenix, AZ | 9,400 | +11.5% |
-9.3%
|
| Portland, OR | 3,500 | -7.4% |
+11.0%
|
| Providence, RI | 4,050 | -10.8% |
+7.2%
|
| Raleigh-Durham, NC | 2,700 | +0.2% |
-3.8%
|
| Riverside-San Bernardino, CA | 8,000 | +10.1% |
+19.6%
|
| Sacramento, CA | 3,150 | -4.6% |
-1.5%
|
| San Diego, CA | 4,100 | -1.8% |
+0.7%
|
| San Francisco, CA | 1,400 | -22.6% |
-9.3%
|
| San Jose, CA | 1,450 | -12.0% |
-3.8%
|
| Seattle, WA | 4,200 | -9.7% |
+1.9%
|
| Tacoma, WA | 1,150 | -9.0% |
-1.9%
|
| Tampa, FL | 6,100 | +7.4% |
+3.2%
|
| Tucson, AZ | 1,800 | +0.9% |
-0.7%
|
| Ventura County, CA | 850 | -8.1% |
-1.6%
|
| Washington, DC | 8,900 | -9.9% |
+5.6%
|
| West Palm Beach, FL | 4,300 | +8.0% |
+6.5%
|
| Combined Markets | 198,297 | -0.3% |
+9.8%
|
All Homes for Sale
| Metro name | Homes for sale | Month-over Month Change |
Year-Over- Year Change |
|---|---|---|---|
| Atlanta, GA | 39,600 | -0.9% |
+4.6%
|
| Austin, TX | 6,400 | -4.8% |
+7.3%
|
| Baltimore, MD | 15,400 | -2.4% |
+14.7%
|
| Boston, MA | 26,200 | +5.9% |
+22.3%
|
| Boulder, CO | 950 | -14.2% |
-14.4%
|
| Charlotte, NC | 13,200 | -4.9% |
+49.9%
|
| Chicago, IL | 48,650 | +2.2% |
+23.8%
|
| Dallas-Fort Worth, TX | 17,650 | -7.2% |
-11.6%
|
| Denver, CO | 7,600 | -4.5% |
-20.4%
|
| Fort Lauderdale, FL | 14,900 | +3.0% |
+53.7%
|
| Fresno, CA | 2,350 | -4.2% |
+43.7%
|
| Hampton Roads, VA | 10,350 | -0.4% |
+10.0%
|
| Houston, TX | 16,700 | -3.7% |
-12.4%
|
| Las Vegas, NV | 16,550 | -1.7% |
-7.5%
|
| Long Island, NY | 16,950 | -4.2% |
+0.7%
|
| Los Angeles, CA | 16,900 | +0.9% |
+30.4%
|
| Miami, FL | 18,050 | +1.3% |
+35.3%
|
| Minneapolis-St. Paul, MN | 17,550 | -6.8% |
+3.9%
|
| Oakland, CA | 3,800 | -11.6% |
+4.0%
|
| Orange County, CA | 8,450 | +0.5% |
+51.6%
|
| Orlando, FL | 14,350 | +5.9% |
–
|
| Philadelphia, PA | 23,800 | -3.4% |
+3.9%
|
| Phoenix, AZ | 25,200 | +7.2% |
+6.3%
|
| Portland, OR | 9,500 | -8.0% |
-7.9%
|
| Providence, RI | 17,600 | +3.2% |
+18.0%
|
| Raleigh-Durham, NC | +0.6% |
+7.9%
|
|
| Riverside-San Bernardino, CA | 19,100 | +6.6% |
+63.0%
|
| Sacramento, CA | 7,550 | -7.4% |
+7.3%
|
| San Diego, CA | 8,550 | -7.0% |
+6.5%
|
| San Francisco, CA | 2,350 | -7.5% |
+3.2%
|
| San Jose, CA | 3,050 | -10.8% |
+47.7%
|
| Seattle, WA | 8,500 | -10.1% |
-9.3%
|
| Tacoma, WA | 3,750 | -10.6% |
-6.3%
|
| Tampa, FL | 18,600 | +6.5% | |
| Tucson, AZ | 6,050 | +9.5% |
+20.0%
|
| Ventura County, CA | 2,050 | -8.2% |
+20.9%
|
| Washington, DC | 23,150 | -4.5% |
+19.5%
|
| West Palm Beach, FL | 14,550 | +4.4% |
+7.2%
|
| Combined Markets | 652,379 | -0.2% |
+7.8%
|


