Rental price growth is slowing due to increasing supply and waning demand. There are 11 metros where rents are already falling, with Phoenix and Oklahoma City seeing declines of more than 6%.
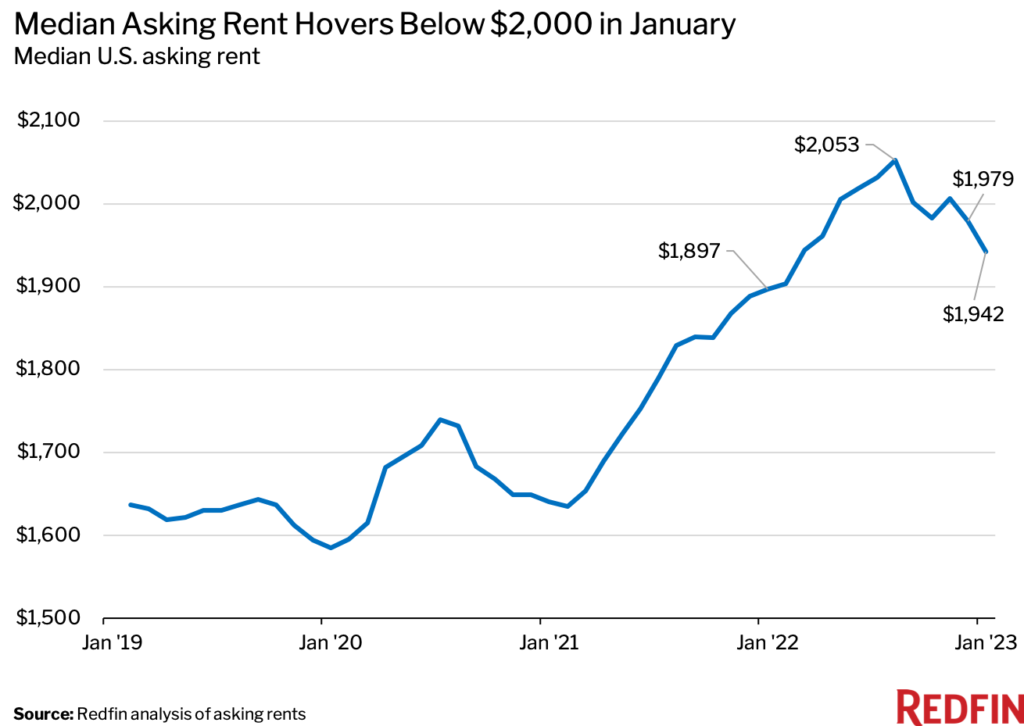
The median U.S. asking rent rose 2.4% year over year to $1,942 in January—the smallest increase since May 2021 and the lowest level in nearly a year. That’s roughly one-sixth the pace of January 2022, when rents were up 15.6% from a year earlier.
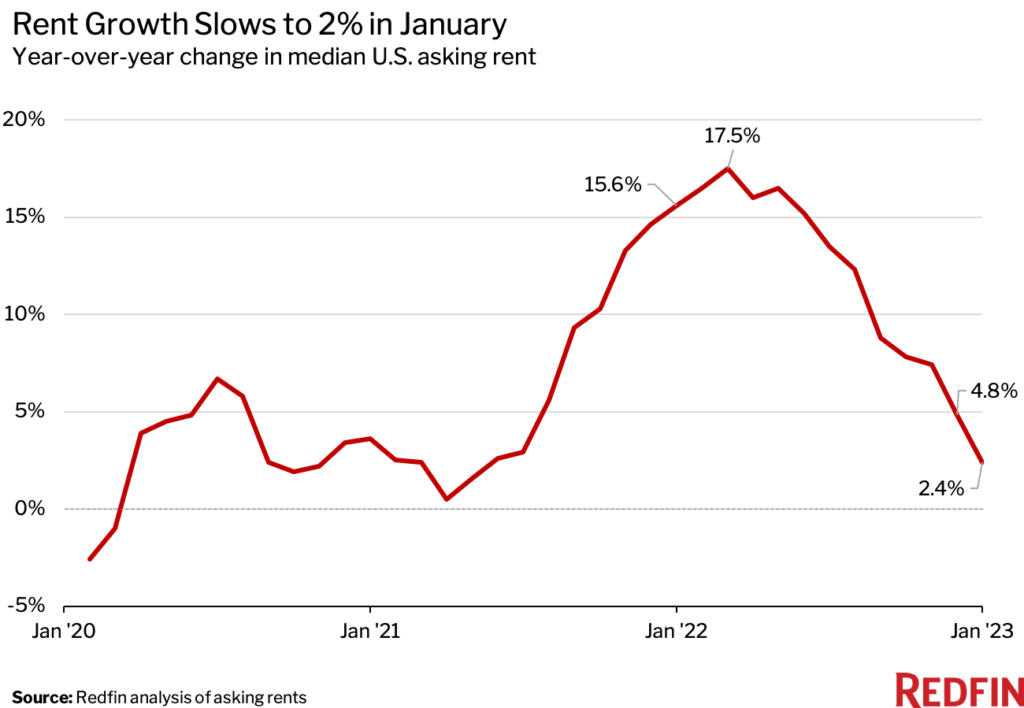
January marked the eighth straight month in which annual rent growth slowed. Rents fell 1.9% from a month earlier and were down 5.4% from the August peak of $2,053.
Rent growth is cooling because of slowing demand and growing supply. Demand has slowed due to still-high costs (rents remain 22.5% higher than they were in January 2020), inflation, widespread economic uncertainty and slowing household formation. Rental supply has grown due to an influx of construction in recent years, as well as a recent increase in the number of people opting to rent out their homes instead of sell.
“We’re watching closely to see whether rents start falling year over year. That would be a welcome relief for renters because it hasn’t happened since the onset of the pandemic,” said Redfin Chief Economist Daryl Fairweather. “If rents do start falling on a year-over-year basis, it will mean that renters have more room to negotiate. It may also prompt more landlords to sell their properties because they’re no longer getting a good return on their investment.”
The nationwide rental vacancy rate stopped falling at the end of 2022 and is expected to grow in the coming months as more rentals hit the market, an indicator that rental prices may continue to slow, Fairweather added.
Rent increases were a significant driver of last year’s high inflation, and now, slowing rent growth is expected to help cool inflation in the coming months. In fact, young adults signing new leases now have lower personal inflation rates than the overall U.S. population for the first time in two years, thanks mainly to slowing rent growth.
Rents Declined in 11 Major U.S. Metro Areas
In Phoenix, the median asking rent declined 6.7% year over year in January, the largest drop among the 50 most populous U.S. metropolitan areas. Next came Oklahoma City (-6.3%), New Orleans (-5.2%), Minneapolis (-5.1%) and Houston (-4.9%).
- Phoenix, AZ (-6.7%)
- Oklahoma City, OK (-6.3%)
- New Orleans, LA (-5.2%)
- Minneapolis, MN (-5.1%)
- Houston, TX (-4.9%)
- Baltimore, MD (-4.6%)
- Birmingham, AL (-3.4%)
- Chicago, IL (-3.0%)
- Virginia Beach, VA (-1.8%)
- Seattle, WA (-1.0%)
- Austin, TX (-0.4%)
Raleigh Saw the Largest Rent Increase
- Raleigh, NC (22.5%)
- Cleveland, OH (17.5%)
- Indianapolis, IN (14.9%)
- Charlotte, NC (14.2%)
- Nashville, TN (9.8%)
- Kansas City, MO (8.8%)
- Louisville, KY (8.2%)
- Milwaukee, WI (7.7%)
- Jacksonville, FL (7.5%)
- Providence RI (7.3%)
Median Asking Rents: January 2023
| U.S. Metro Area | Median Asking Rent | Year-Over-Year Change in Median Asking Rent |
| Atlanta, GA | $2,085 | 2.4% |
| Austin, TX | $2,247 | -0.4% |
| Baltimore, MD | $1,954 | -4.6% |
| Birmingham, AL | $1,539 | -3.4% |
| Boston, MA | $3,707 | 4.7% |
| Buffalo, NY | $1,560 | 5.7% |
| Charlotte, NC | $1,959 | 14.2% |
| Chicago, IL | $2,289 | -3.0% |
| Cincinnati, OH | $1,530 | 0.9% |
| Cleveland, OH | $1,562 | 17.5% |
| Columbus, OH | $1,580 | 6.2% |
| Dallas, TX | $2,124 | 0.9% |
| Denver, CO | $2,744 | 1.8% |
| Detroit, MI | $1,593 | 1.2% |
| Hartford, CT | $2,050 | 1.6% |
| Houston, TX | $1,775 | -4.9% |
| Indianapolis, IN | $1,504 | 14.9% |
| Jacksonville, FL | $1,653 | 7.5% |
| Kansas City, MO | $1,530 | 8.8% |
| Las Vegas, NV | $1,846 | 5.0% |
| Los Angeles, CA | $3,402 | 0.8% |
| Louisville, KY | $1,389 | 8.2% |
| Memphis, TN | $1,549 | 5.2% |
| Miami, FL | $3,094 | 3.5% |
| Milwaukee, WI | $1,685 | 7.7% |
| Minneapolis, MN | $1,736 | -5.1% |
| Nashville, TN | $2,073 | 9.8% |
| New Orleans, LA | $1,645 | -5.2% |
| New York, NY | $4,015 | 6.0% |
| Oklahoma City, OK | $1,195 | -6.3% |
| Orlando, FL | $2,109 | 3.9% |
| Philadelphia, PA | $2,308 | 0.1% |
| Phoenix, AZ | $2,016 | -6.7% |
| Pittsburgh, PA | $1,785 | 2.4% |
| Portland, OR | $2,485 | 1.0% |
| Providence, RI | $2,257 | 7.3% |
| Raleigh, NC | $2,119 | 22.5% |
| Richmond, VA | $1,741 | 0.9% |
| Riverside, CA | $2,747 | 3.5% |
| Sacramento, CA | $2,746 | 0.5% |
| Salt Lake City, UT | $1,873 | 7.2% |
| San Antonio, TX | $1,431 | 1.1% |
| San Diego, CA | $3,290 | 4.7% |
| San Francisco, CA | $3,641 | 1.2% |
| San Jose, CA | $3,525 | 3.9% |
| Seattle, WA | $2,764 | -1.0% |
| St. Louis, MO | $1,534 | 2.3% |
| Tampa, FL | $2,197 | 3.5% |
| Virginia Beach, VA | $1,638 | -1.8% |
| Washington, D.C. | $2,600 | 1.2% |
| National—U.S.A. | $1,942 | 2.4% |
Methodology
Redfin analyzed rent prices from Rent. across the 50 largest U.S. metro areas. This analysis uses data from more than 20,000 apartment buildings across the country.
It is important to note that the prices in this report reflect the current costs of new leases during each time period. In other words, the amount shown as the median rent is not the median of what all renters are paying, but the median cost of apartments that were available for new renters during the report month. Currently, Redfin’s data from Rent. includes only median rent at the metro level. Future reports will compare median rent prices at a more granular geographic level.