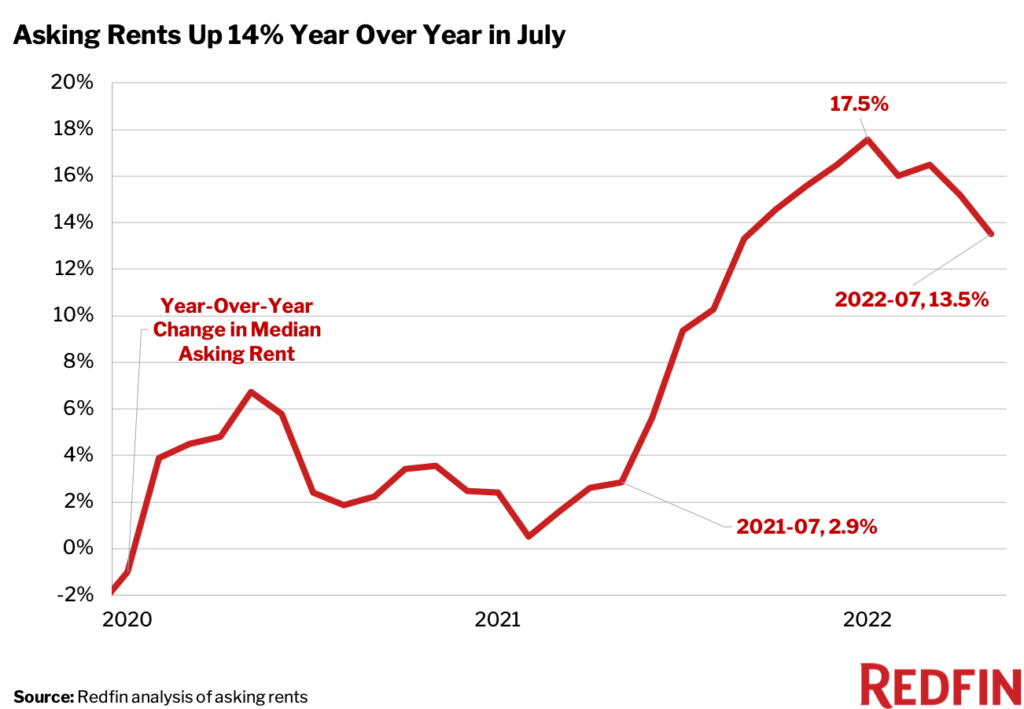
The 14% increase in July was the smallest since November as landlords reacted to shrinking tenant budgets.
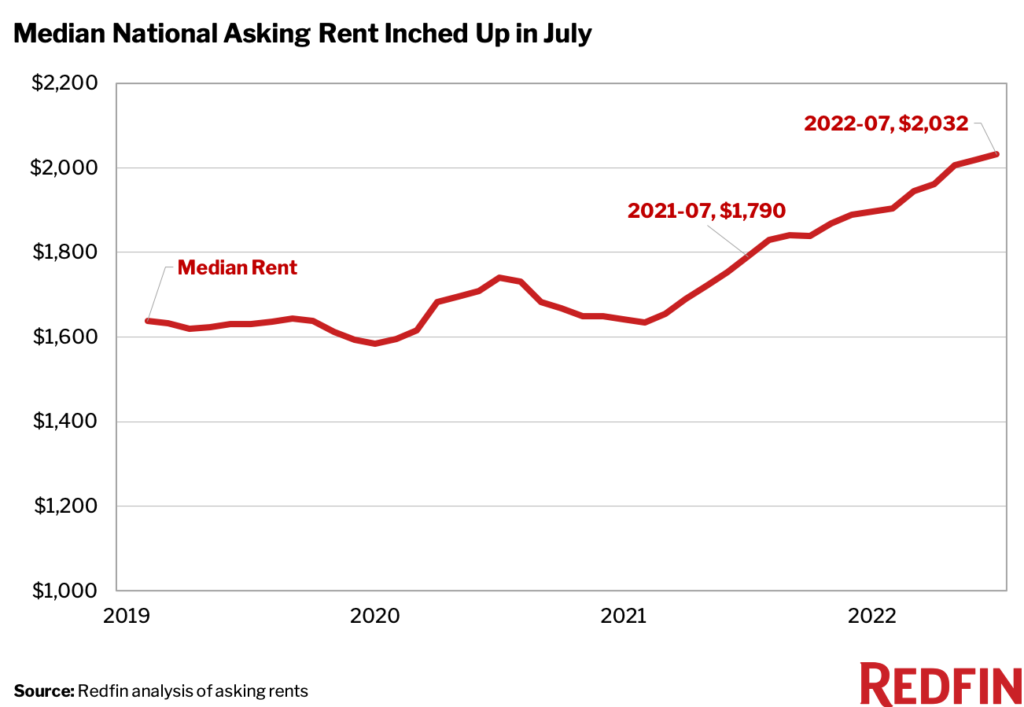
While rents in the U.S. hit another record in July, rent growth slowed for the second-straight month. The national median asking rent was up 14% year over year to $2,032. That’s the smallest annual increase since November, and compares with a revised gain of 15% in June and 16% in May. On a month-over-month basis, the median asking rent climbed 0.6%, the slowest growth since February and down from a 2.1% increase a year earlier.
“Big rent hikes may finally be coming to an end as landlords adjust to waning tenant budgets that are being strained by the rising cost of groceries, gas and other regular expenses,” said Redfin Chief Economist Daryl Fairweather. ”Still, rents are increasing faster than overall inflation, which has started to ease. We expect rental growth to continue to slow, but markets with strong job growth and limited new housing construction, like New York and Seattle, will likely continue to experience large rent increases.”
| Rental Market Summary | July 2022 | Month-Over-Month | Year-Over-Year |
| Median Monthly Rent | $2,032 | 0.6% | 13.5% |
Cincinnati Rents Rose More Than 30%
Asking rents rose 31% year over year in Cincinnati, the largest jump among the 50 most populous U.S. metropolitan areas. This was down from a 39% year-over-year increase in June, when Seattle, Austin, and Nashville also saw rents increase more than 30% from a year earlier. In July, Cincinnati was the only metro that saw asking rents climb more than 30%, but nine others had increases of over 20%. After topping the list for the first four months of the year, both Austin, TX and Portland, OR fell out of the top ten metros with the fastest-rising rents in July.
Top 10 Metro Areas With Fastest-Rising Rents Year Over Year
- Cincinnati, OH (31%)
- Nashville, TN (26%)
- Pittsburgh, PA (24%)
- New York, NY (23%)
- Newark, NJ (23%)
- Nassau County, NY (23%)
- New Brunswick, NJ (23%)
- Seattle, WA (22%)
- Indianapolis, IN (21%)
- San Antonio, TX (21%)
Just three of the 50 most populous metro areas saw rents fall in July from a year earlier. Rents declined 10% in Milwaukee, 8% in Minneapolis and less than 1% in Baltimore. Milwaukee and Minneapolis have seen declining asking rents since April, but this is the first month asking rents in Baltimore declined.
Metro Areas Where Rents Declined Year Over Year
- Milwaukee, WI (-10%)
- Minneapolis, MN (-8%)
- Baltimore, MD (-0.3%)
Median Asking Rents, July 2022
| U.S. Metro Area | Median Asking Rent | Year-Over-Year Change in Median Asking Rent |
|---|---|---|
| Anaheim, CA | $3,479 | 6.2% |
| Atlanta, GA | $2,121 | 10.1% |
| Austin, TX | $2,491 | 19.9% |
| Baltimore, MD | $2,050 | -0.3% |
| Boston, MA | $3,814 | 8.9% |
| Charlotte, NC | $1,888 | 6.8% |
| Chicago, IL | $2,545 | 4.9% |
| Cincinnati, OH | $1,750 | 31.4% |
| Cleveland, OH | $1,531 | 7.4% |
| Columbus, OH | $1,729 | 12.9% |
| Dallas, TX | $2,218 | 16.2% |
| Denver, CO | $2,716 | 8.8% |
| Detroit, MI | $1,611 | 5.8% |
| Fort Lauderdale, FL | $3,068 | 17.8% |
| Fort Worth, TX | $2,218 | 16.2% |
| Houston, TX | $1,737 | 4.8% |
| Indianapolis, IN | $1,542 | 21.4% |
| Jacksonville, FL | $1,661 | 3.6% |
| Kansas City, MO | $1,456 | 1.3% |
| Las Vegas, NV | $1,835 | 10.7% |
| Los Angeles, CA | $3,479 | 6.2% |
| Miami, FL | $3,068 | 17.8% |
| Milwaukee, WI | $1,686 | -9.8% |
| Minneapolis, MN | $1,748 | -8.1% |
| Montgomery County, PA | $2,439 | 11.3% |
| Nashville, TN | $2,223 | 26.5% |
| Nassau County, NY | $4,209 | 23.0% |
| New Brunswick, NJ | $4,209 | 23.0% |
| New York, NY | $4,209 | 23.0% |
| Newark, NJ | $4,209 | 23.0% |
| Oakland, CA | $3,957 | 11.6% |
| Orlando, FL | $2,164 | 14.1% |
| Philadelphia, PA | $2,439 | 11.3% |
| Phoenix, AZ | $2,053 | 4.8% |
| Pittsburgh, PA | $2,007 | 24.4% |
| Portland, OR | $2,596 | 17.8% |
| Providence, RI | $2,482 | 4.9% |
| Riverside, CA | $2,768 | 5.2% |
| Sacramento, CA | $2,735 | 9.8% |
| San Antonio, TX | $1,476 | 21.1% |
| San Diego, CA | $3,426 | 14.0% |
| San Francisco, CA | $3,957 | 11.6% |
| San Jose, CA | $3,685 | 13.2% |
| Seattle, WA | $3,157 | 21.9% |
| St. Louis, MO | $1,560 | 4.8% |
| Tampa, FL | $2,227 | 12.2% |
| Virginia Beach, VA | $1,728 | 10.6% |
| Warren, MI | $1,611 | 5.8% |
| Washington, D.C. | $2,735 | 9.0% |
| West Palm Beach, FL | $3,068 | 17.8% |
| National | $2,032 | 13.5% |
Methodology
Redfin analyzed rent prices from RentPath across the 50 largest U.S. metro areas. This analysis uses data from more than 20,000 apartment buildings across the country.
It is important to note that the prices in this report reflect the current costs of new leases during each time period. In other words, the amount shown as the median rent is not the median of what all renters are paying, but the median cost of apartments that were available for new renters during the report month. Currently, Redfin’s data from RentPath includes only median rent at the metro level. Future reports will compare median rent prices at a more granular geographic level.