
- Rising home prices and elevated mortgage rates have pushed the income necessary to buy the typical U.S. starter home up 13% over the last year.
- New listings of starter homes are down 23%, the biggest decline since the start of the pandemic.
- San Francisco, Austin and Phoenix are the only major U.S. metros where the income needed to buy a starter home has dropped over the last year. It has risen over 20% in Fort Lauderdale, FL and Miami, more than anywhere else in the country.
- The share of starter homes going to all-cash buyers is near a decade high.
A first-time homebuyer must earn roughly $64,500 per year to afford the typical U.S. “starter” home, up 13% ($7,200) from a year ago. That’s due to the one-two punch of higher mortgage rates and higher home prices.
The typical starter home sold for a record $243,000 in June, up 2.1% from a year earlier and up more than 45% from before the pandemic. Average mortgage rates hit 6.7% in June, up from 5.5% the year before and just under 4% before the pandemic.
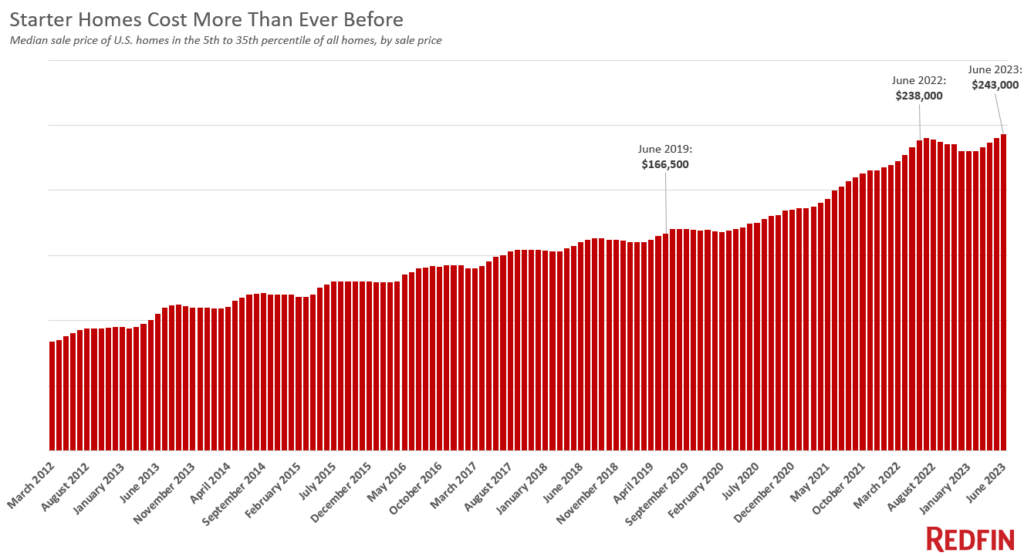
This is according to an analysis that divides all U.S. residential properties into five buckets based on Redfin Estimates of the homes’ market values as of June 2023. The data is analyzed using three-month moving periods; when we say “June,” we’re referring to April-June. There are three equal-sized tiers, as well as tiers for the bottom 5% and top 5% of the market. This report is focused on the “affordable” tier, also referred to as “starter” homes in this report, which is made up of homes estimated to be in the 5th-35th percentile by sale price. We calculated how much annual income is needed to afford a starter home by using the rule of thumb that a home is considered “affordable” if a buyer taking out a mortgage spends no more than 30% of their income on their housing payment.
Prices for starter homes continue to tick up because there are so few homes for sale, often prompting competition and pushing up prices for the ones that do hit the market. New listings of starter homes for sale dropped 23% from a year earlier in June, the biggest drop since the start of the pandemic. The total number of starter homes on the market is down 15%, also the biggest drop since the start of the pandemic. Limited listings and still-rising prices, exacerbated by high mortgage rates, have stifled sales activity. Sales of starter homes dropped 17% year over year in June.
“Buyers searching for starter homes in today’s market are on a wild goose chase because in many parts of the country, there’s no such thing as a starter home anymore,” said Redfin Senior Economist Sheharyar Bokhari. “The most affordable homes for sale are no longer affordable to people with lower budgets due to the combination of rising prices and rising rates. That’s locking many Americans out of the housing market altogether, preventing them from building equity and ultimately building lasting wealth. People who are already homeowners are sitting pretty, comparatively, because most of them have benefited from home values soaring over the last few years. That could lead to the wealth gap in this country becoming even more drastic.”
Home prices shot up during the pandemic due to record-low mortgage rates and remote work, and now rising mortgage rates are exacerbating the affordability crisis, especially for first-time buyers. A person looking to buy today’s typical starter home would have a monthly mortgage payment of $1,610, up 13% from a year ago and nearly double the typical payment just before the pandemic. Average U.S. wages have risen 4.4% from a year ago and roughly 20% from before the pandemic, not nearly enough to make up for the jump in monthly mortgage payments.
Many prospective first-time homebuyers are between a rock and a hard place because rents remain elevated, too. The typical U.S. asking rent is just $24 shy of the $2,053 peak hit in 2022.
Buyers with higher budgets have seen their monthly payments increase quite a bit, too. People buying today’s typical home in the “middle” and “expensive” tiers would have a monthly housing payment 13% higher than they would have a year ago. Sale prices are up 1.5% year over year for the “middle” tier, and 2.2% for the “high” tier–comparable to the increase for starter homes.
But the impact of rapidly rising monthly housing payments is more drastic for buyers searching for an affordable starter home. Many of those people–often first-time homebuyers–are priced out of the housing market entirely because there’s no room to lower their budget. Buyers searching for higher-priced homes can lower their price range and perhaps search for smaller homes in less expensive neighborhoods.
San Francisco, Austin and Phoenix are the only U.S. metros where starter-home buyers need less income than they did a year ago
First-timers and other lower-budget buyers in a few metros are getting some relief: San Francisco, Austin and Phoenix buyers don’t need to earn quite as much as they did a year ago to afford a starter home, as those are the only three major U.S. metros where prices have declined.
A homebuyer in San Francisco must earn $241,200 to afford the typical “starter” home, down 4.5% ($11,300) from a year earlier. Austin buyers must earn $92,000, down 3.3% year over year, and Phoenix buyers must earn $86,100, down about 1%. Those are also the metros where prices of starter homes have declined most, with median sale prices down 13.3% to $910,000 in San Francisco, down 12.2% to $347,300 in Austin, and down 9.7% to $325,000 in Phoenix.
Starter-home prices are falling in those three metros after skyrocketing in 2020 and 2021. Bay Area prices soared because buyers used record-low mortgage rates as an opportunity to jump into the expensive market, and Austin and Phoenix prices went wild because of the influx of remote workers moving into those places.
Now that mortgage rates have more than doubled, the initial surge of remote-work relocations has passed, and new listings are scarce due to homeowners locked in by low rates, the housing markets in Austin and Phoenix have fallen back down to earth. Demand in San Francisco dropped because rising rates made ultra-expensive homes even more expensive, and many tech workers aren’t as incentivized to live near city centers as they once were.
Starter-home prices are down year over year in 13 other metros, mostly expensive West Coast markets, with the next-biggest declines in San Jose, CA (-8.7% to $925,000), Sacramento, CA (-7.3% to $417,000) and Oakland, CA (-7.3% to $630,000). Starter-home prices also dropped in Las Vegas, Seattle, Denver, Los Angeles, Portland, OR, Anaheim, CA, San Diego, Riverside, CA, Pittsburgh and Minneapolis. But the income necessary to buy a starter home has still risen, because in those places lower prices don’t make up for higher mortgage rates.
Miami first-time homebuyers need 25% more income
The income necessary to buy a starter home has risen most in Florida. Fort Lauderdale buyers need to earn $58,300 per year to purchase a $220,000 home, the typical price for a starter home in that area, up 28% from a year earlier. That’s the biggest uptick of the 50 most populous U.S. metros.
Next comes Miami, where buyers need to earn $79,500 (up 24.8%) to afford the typical $300,000 starter home. Rounding out the top three is Newark, NJ, where buyers need $88,800 (up 21.1%) to afford a $335,000 home. Fort Lauderdale, Miami and Newark also had the biggest starter-home price increases, with prices up 15.8% year over year, 13.2% and 9.8%, respectively.
Even though starter-home prices have risen most in Florida, they’re still less expensive than a place like Austin or Phoenix, where home prices skyrocketed during the pandemic and have since come down some.
Prices are rising in Florida because despite increasing climate risks, out-of-town remote workers and retirees are flocking in. That’s largely due to warm weather and relative affordability; even though prices there soared during the pandemic, homes are still typically less expensive than a place like New York, Boston or Los Angeles. Five of the 10 most popular metros for relocating homebuyers are in Florida.
All-cash buyers purchase nearly 40% of starter homes in the U.S.
More than one-third (36.6%) of the country’s starter homes were purchased in cash in May, down just slightly from the previous month’s decade-high and up from 35.2% a year earlier.
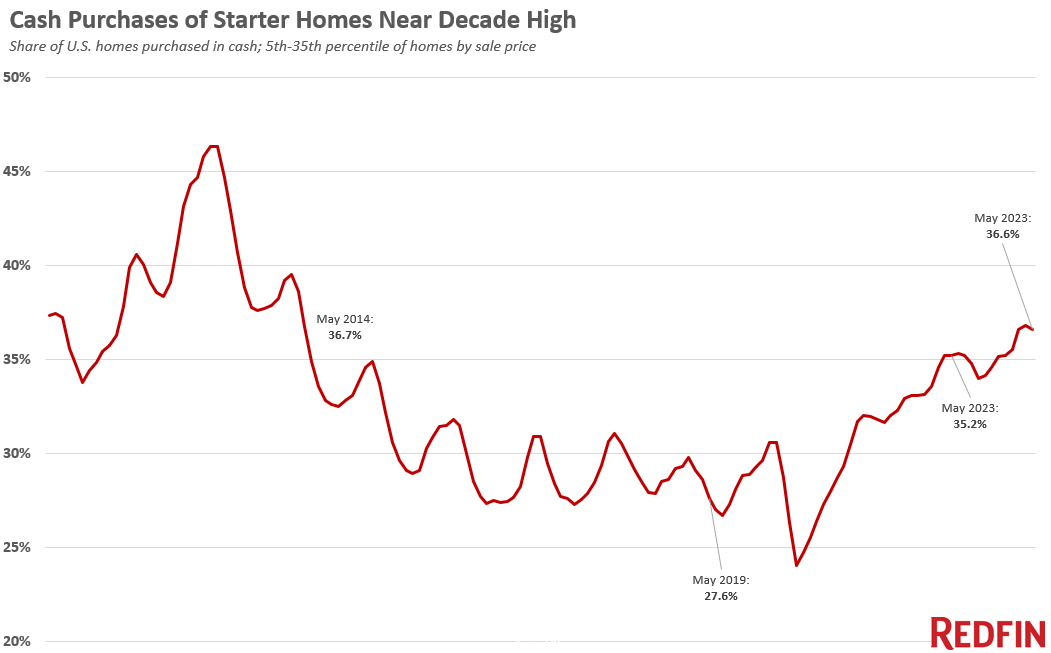
Note that this all-cash data is from May, the most recent month for which data is available, while the other data in this report is from June.
Real estate investors are buying up a sizable chunk of today’s affordable homes. A record 41% of investor purchases were small homes–those with 1,400 or fewer square feet–in the first quarter. That’s up from 37% a year earlier.
“Many house hunters searching for an affordable place to call home for themselves and/or their family are out of options, especially in more expensive parts of the country,” Bokhari said. “As prices for the most affordable homes continue to climb and rates remain elevated, it’s becoming more true that you have to be wealthy to buy a home–especially if it’s your first one. That’s why we’ve seen the share of affordable homes going to cash buyers, either individuals or investors, tick up: Because they’re the only ones who can afford them.”
Cash buyers also have another advantage. They don’t have to pay high mortgage rates, meaning it’s ultimately less expensive for them to buy homes, deepening the wealth gap in the country.
But even though monthly payments on starter homes are becoming more expensive and an increasing share are going to cash buyers, in some ways the market is easier to break into than it was during the pandemic buying boom. Some first-time homebuyers are able to buy a home without a bidding war, and in some metros prices have come down, as noted above.
Other metro-level highlights for starter homes, June 2023
The biggest price declines and increases are noted in the text above
Prices are highest in California. Starter homes have the highest median sale price in San Jose ($925,000), San Francisco ($910,000) and Anaheim ($680,000).
Prices are lowest in the Rust Belt. The typical starter home sells for $60,000 in Detroit, the lowest of the 50 most populous U.S. metros. It’s followed by Pittsburgh ($100,000) and Cleveland ($115,000).
New listings declined most in pandemic migration hotspots. New listings of starter homes dropped from a year earlier in all but one of the 50 most populous U.S metros, with the biggest declines in migration magnets. New listings fell most in Sacramento, CA (-44.8%), Phoenix (-44.3%) and Las Vegas (-43.2%). They increased 7% in Detroit.
Sales fell most on the West Coast. Sales of starter homes dropped in 45 of the 50 most populous metros. They declined most year over year in Seattle (-36.5%), Sacramento (-35.9%), San Francisco (-35.4%), San Jose, CA (-34.5%) and Portland, OR (-33.9%).
Sales rose in Texas. Sales increased from a year earlier in San Antonio, TX (11.6%), Detroit (10.1%), Philadelphia (3.4%), Dallas (2.5%), and Fort Worth, TX (0.6%).
| Metro-level summary: Income need to afford a starter home, June 2023
50 most populous U.S. metros Ranked by change in income needed to afford a starter home, YoY, with biggest decline at the top Income needed = income necessary to afford the typical monthly mortgage payment on the median-priced starter home. Starter home = 5th-35th percentile of homes sold, by sale price |
||||
| U.S. metro area | Income needed | Median sale price | Median mortgage payment | Change in income needed, YoY |
| San Francisco, CA | $241,181 | $910,000 | $6,030 | -4.5% |
| Austin, TX | $92,057 | $347,340 | $2,301 | -3.3% |
| Phoenix, AZ | $86,136 | $325,000 | $2,153 | -0.5% |
| San Jose, CA | $245,157 | $925,000 | $6,129 | 0.6% |
| Sacramento, CA | $110,519 | $417,000 | $2,763 | 2.2% |
| Oakland, CA | $166,972 | $630,000 | $4,174 | 2.2% |
| Las Vegas, NV | $76,860 | $290,000 | $1,922 | 3.1% |
| Seattle, WA | $141,794 | $535,000 | $3,545 | 4.4% |
| Denver, CO | $109,989 | $415,000 | $2,750 | 4.7% |
| Los Angeles, CA | $151,070 | $570,000 | $3,777 | 4.7% |
| Portland, OR | $109,327 | $412,500 | $2,733 | 5.8% |
| Anaheim, CA | $180,224 | $680,000 | $4,506 | 6.3% |
| San Diego, CA | $161,671 | $610,000 | $4,042 | 6.7% |
| Riverside, CA | $104,689 | $395,000 | $2,617 | 7.5% |
| Pittsburgh, PA | $26,424 | $99,700 | $661 | 8.8% |
| Minneapolis, MN | $68,909 | $260,000 | $1,723 | 9.8% |
| Detroit, MI | $15,902 | $60,000 | $398 | 10.2% |
| Dallas, TX | $72,885 | $275,000 | $1,822 | 10.6% |
| Washington, DC | $90,894 | $342,950 | $2,272 | 11.5% |
| Philadelphia, PA | $34,985 | $132,000 | $875 | 11.9% |
| Nashville, TN | $82,161 | $310,000 | $2,054 | 12.0% |
| Atlanta, GA | $68,909 | $260,000 | $1,723 | 12.4% |
| Nassau County, NY | $124,566 | $470,000 | $3,114 | 12.6% |
| Baltimore, MD | $54,332 | $205,000 | $1,358 | 12.7% |
| Boston, MA | $121,916 | $460,000 | $3,048 | 12.7% |
| Tampa, FL | $66,259 | $250,000 | $1,656 | 12.9% |
| Chicago, IL | $48,987 | $184,833 | $1,225 | 13.2% |
| Orlando, FL | $67,584 | $255,000 | $1,690 | 13.3% |
| Warren, MI | $46,381 | $175,000 | $1,160 | 13.5% |
| Kansas City, MO | $43,731 | $165,000 | $1,093 | 13.7% |
| Houston, TX | $57,513 | $217,000 | $1,438 | 13.9% |
| New York, NY | $116,615 | $440,000 | $2,915 | 14.1% |
| St. Louis, MO | $31,804 | $120,000 | $795 | 14.1% |
| Cleveland, OH | $30,479 | $115,000 | $762 | 14.2% |
| Fort Worth, TX | $64,933 | $245,000 | $1,623 | 14.4% |
| Virginia Beach, VA | $59,633 | $225,000 | $1,491 | 15.4% |
| Charlotte, NC | $62,283 | $235,000 | $1,557 | 15.4% |
| New Brunswick, NJ | $87,461 | $330,000 | $2,187 | 16.2% |
| Providence, RI | $86,666 | $327,000 | $2,167 | 17.4% |
| Cincinnati, OH | $42,406 | $160,000 | $1,060 | 17.6% |
| Indianapolis, IN | $42,406 | $160,000 | $1,060 | 17.6% |
| Columbus, OH | $48,501 | $183,000 | $1,213 | 18.7% |
| San Antonio, TX | $55,657 | $210,000 | $1,391 | 18.7% |
| West Palm Beach, FL | $64,933 | $245,000 | $1,623 | 19.0% |
| Jacksonville, FL | $63,608 | $240,000 | $1,590 | 19.2% |
| Montgomery County, PA | $82,161 | $310,000 | $2,054 | 19.9% |
| Milwaukee, WI | $46,381 | $175,000 | $1,160 | 20.6% |
| Newark, NJ | $88,787 | $335,000 | $2,220 | 21.1% |
| Miami, FL | $79,510 | $300,000 | $1,988 | 24.8% |
| Fort Lauderdale, FL | $58,308 | $220,000 | $1,458 | 27.6% |
| National – U.S.A. | $64,403 | $243,000 | $1,610 | 12.6% |
| Monthly median mortgage payments are calculated assuming the buyer made a 20% down payment, and they take that month’s median sale price and average mortgage-interest rate into account. They include principal, interest, taxes and insurance. | ||||


