
- That outpaced a 41% drop in overall home purchases. Investors retreated as rising interest rates and falling home values shrank potential profits.
- Still, investors bought up 18% of homes that sold. That’s down from a peak of 20% a year earlier but is higher than pre-pandemic levels.
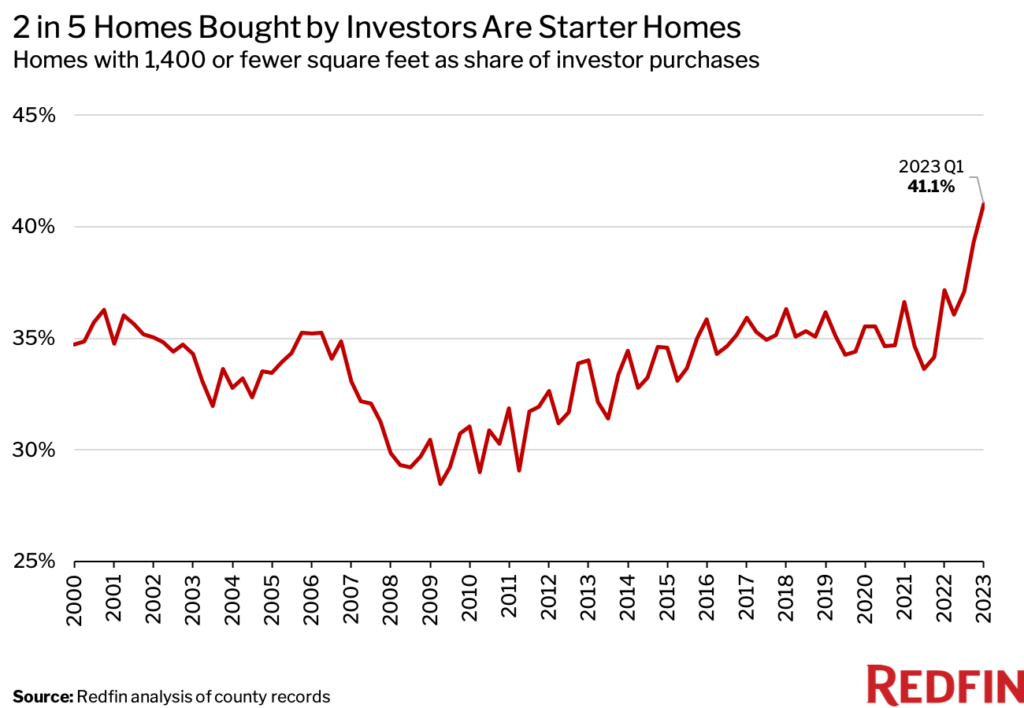
- Investors gravitated toward low-priced homes and condos; starter homes made up a record 2 in 5 investor purchases.
Real estate investors purchased 48.6% fewer homes in the first quarter of 2023 than they did a year earlier as elevated interest rates along with declining rents and housing values ate into potential profits. That’s the largest annual decline on record, and outpaced the 40.7% drop in overall home purchases in the major metros tracked by Redfin.
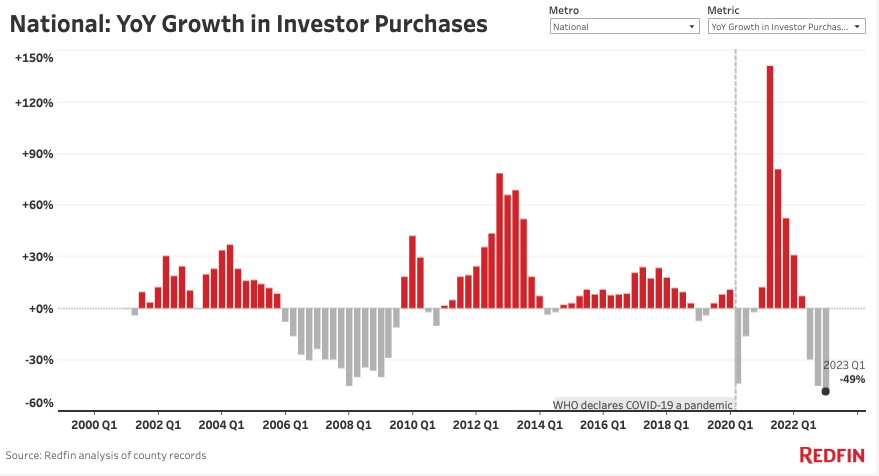
Investor purchases fell 15.9% on a quarter-over-quarter basis, comparable with the 14.7% quarterly drop in overall home purchases.
This is according to a Redfin analysis of county records across 40 of the most populous U.S. metropolitan areas. We define an investor as any institution or business that purchases residential real estate. When we refer to a “record,” the record dates back to the first quarter of 2000. This data is subject to revision.
“While investors have pumped the brakes on home purchases, they’re still scooping up a bigger share of homes than they were before the pandemic, which can create challenges for individual buyers at a time when there are so few homes for sale,” said Redfin Senior Economist Sheharyar Bokhari. “Investors have gravitated toward more affordable properties due to still-high housing costs and rising mortgage rates, which has left first-time homebuyers with fewer starter homes to choose from.”
Investors bought up scores of homes during the pandemic because record-low mortgage rates and skyrocketing housing demand created opportunities for hefty returns. Now they’re pulling back in response to the rise in interest rates, which is causing housing values to continue falling in much of the U.S. as homebuyer demand falters. While many investors buy homes with cash, they’re still impacted by high interest rates because they often take out non mortgage loans to cover renovations and other expenses.
“It’s been about eight months since one of my listings sold to an investor,” said Jacksonville, FL Redfin Premier real estate agent Heather Kruayai. “I rarely get offers from investors these days, and when I do, it’s a lowball offer on a house that’s been sitting for a while. Some smaller companies and mom-and-pop investors are still active in the market, but the big corporations aren’t buying anymore.”
Borrowing costs climbed even higher in May, meaning investors may pull back from the housing market further in the second quarter. Investor home purchases typically rise on a quarter-over-quarter basis in the spring, but we may see them fall flat or decline when second-quarter data comes in.
For investors who are landlords, slowing rent growth is also making it harder to reap profits. And investors who are in the business of flipping homes are finding it more challenging to make money because they’re increasingly likely to resell homes at a loss due to declining home prices. Roughly one of every seven homes (13.5%) sold by an investor in March sold for less than the investor bought it for, just shy of the seven-year high set in February. The share was even higher—20.8%—for home flippers.
Widespread economic uncertainty and recession fears are also prompting investors to pump the brakes. Some investors may be moving their money into other asset classes that offer better returns, such as stocks and bonds.
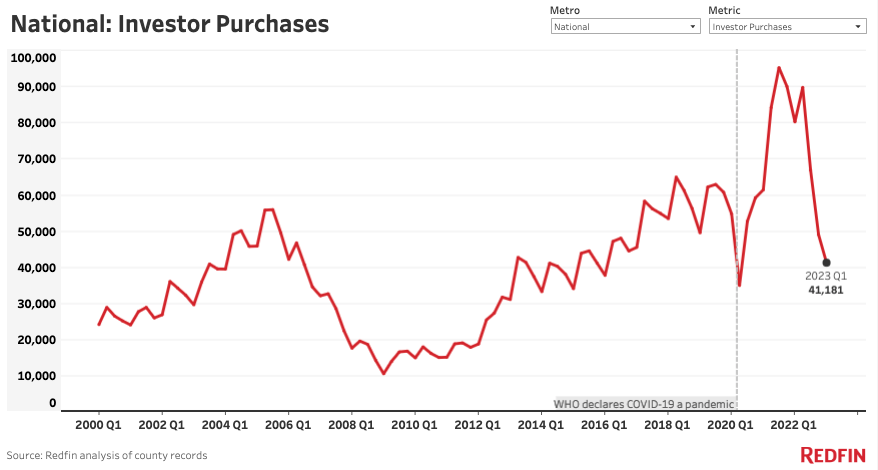
Investor home purchases in the first quarter of 2022 were near their record high, which is another reason the year-over-year decline in 2023 was so dramatic. Investors bought 41,181 homes in the metros tracked by Redfin in the first quarter of 2023, down from 80,128 a year earlier, which wasn’t far from the record high of 95,124 in the third quarter of 2021.
Overall, investors bought $27.5 billion worth of homes in the metros tracked by Redfin in the first quarter, down 46.3% from $51.2 billion one year earlier and down 12.4% from $31.4 billion one quarter earlier. The typical home investors purchased cost $427,901, little changed from the prior quarter and a year earlier.
Investors Bought 18% of Homes Purchased in the First Quarter
While investors are purchasing fewer homes than they were before the pandemic, their market share remains relatively high; they bought 17.6% of homes purchased in the metros tracked by Redfin in the first quarter. That’s down from a peak of 20.4% a year earlier but higher than any quarter on record prior to the pandemic.
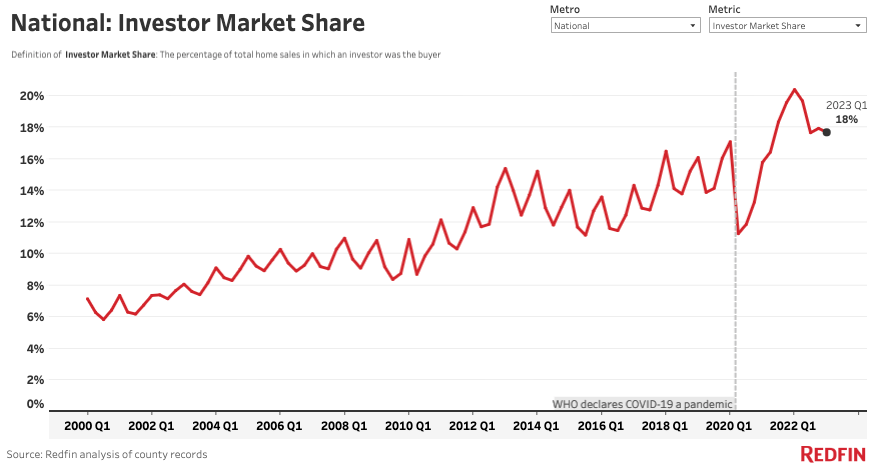
Investor market share is likely above pre-pandemic levels in part because so many individual homebuyers have been priced out of the market, Bokhari said. For it to come down substantially, investors would need to pull back much more than regular buyers; right now, both groups are retreating rapidly from the market.
Investor Home Purchases Plunged in the Sun Belt
In Nassau County, NY, investor home purchases fell 67.9% year over year in the first quarter, the largest decline among the 40 metros Redfin analyzed. Next came Atlanta (-66%) and Charlotte, NC (-66%), Phoenix (-64.2%) and Nashville, TN (-60.4%). Rounding out the top 10 are Las Vegas, Jacksonville, Philadelphia, Tampa, FL and Orlando, FL, which all saw declines of more than 50%.
All but two of the metros above (Nassau County and Philadelphia) are in Sun Belt states, which soared in popularity among homebuyers during the pandemic. Investors piled in to capitalize on surging rents and home values, and are now pulling back as Sun Belt housing markets slow relatively quickly after getting overheated in recent years.
In Phoenix, 30.7% of homes sold by investors in March sold at a loss—the highest share of the 40 metros Redfin analyzed and more than double the national rate, a separate Redfin analysis found. Next came Las Vegas (28%), Jacksonville (20.9%), Sacramento, CA (20.2%) and Charlotte (17.4%).
Investor purchases may also be declining in Atlanta, Charlotte, Las Vegas and Phoenix because those markets were popular among iBuyer investors. Many iBuying companies, including RedfinNow, ceased or slowed operations in recent years.
Baltimore saw the smallest decline in investor purchases, which fell 8.8% year over year in the first quarter. It was followed by Providence, RI (-9.6%), Seattle (-15.5%), Milwaukee (-21.6%) and Cleveland, OH (-23.2%).
While the decline in investor purchases was relatively small in Seattle, it has still been noticeable, according to local Redfin Premier real estate agent Forrest Moody.
“There aren’t many investors buying homes in Seattle, but some are selling,” Moody said. “I’m seeing more landlords sell rental properties as leases expire. That’s primarily because Seattle has a lot of laws protecting tenants, so many landlords have decided it’s no longer worth the hassle. If it wasn’t for investors selling off properties, our housing shortage would be even more dire than it already is. Hardly any individual homeowners are selling because they don’t want to trade their 3% mortgage rate for a 7% one.”
Investors Lost Most Market Share in Charlotte, Atlanta and Phoenix
Investors lost market share in 17 of the 40 metros Redfin analyzed. Many of those are places where investor purchases dropped significantly. In Charlotte, investors bought 18.4% of homes purchased in the first quarter, down 14.1 percentage points from 32.5% a year earlier. That’s the largest percentage-point drop among the metros in this analysis. Next came Atlanta (-14 ppts), Phoenix (-11.1 ppts), Jacksonville (-10.7 ppts) and Nashville (-9.3 ppts).
Investors gained the most market share in Baltimore, where they bought 21.6% of homes purchased, up from 17% a year earlier (4.6 ppts). Next came Nassau County (4.3 ppts), New York (4 ppts), Providence (3.4 ppts) and Seattle (2.8 ppts).
Overall, investors had the highest market share in Miami, where they bought 30% of homes purchased in the first quarter. Rounding out the top five are Cleveland (24%), Anaheim, CA (22.6%) Detroit (22%) and Jacksonville (22%).
Investors had the lowest market share in Warren, MI (10.6%), Montgomery County, PA (10.6%), Washington, D.C. (10.6%), Minneapolis (11.1%) and Portland, OR (11.5%).
Low-Priced Homes Made Up Increasing Share of Investor Purchases
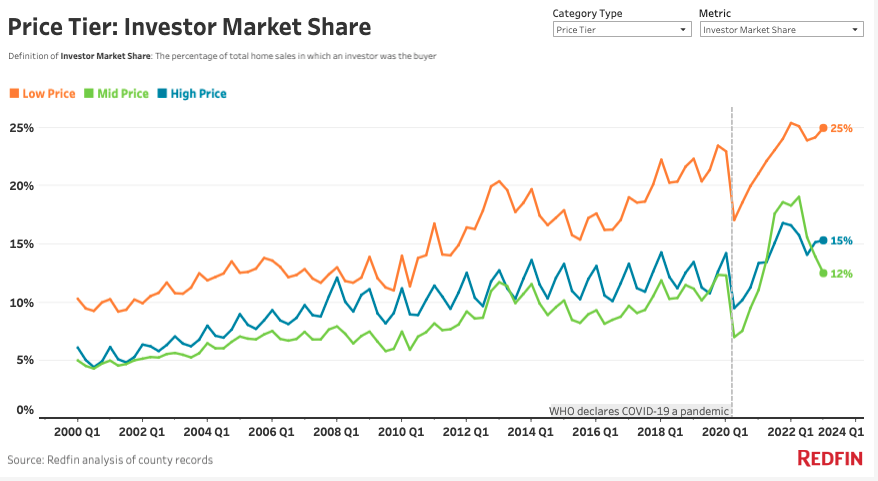
Low-priced homes made up nearly half (48.7%) of investor purchases in the first quarter, the highest share in two years. Meanwhile, mid-priced homes represented about one-quarter (23.6%) of investor purchases, the lowest share in two years. High-priced homes made up 27.7%, little changed from the prior several quarters.
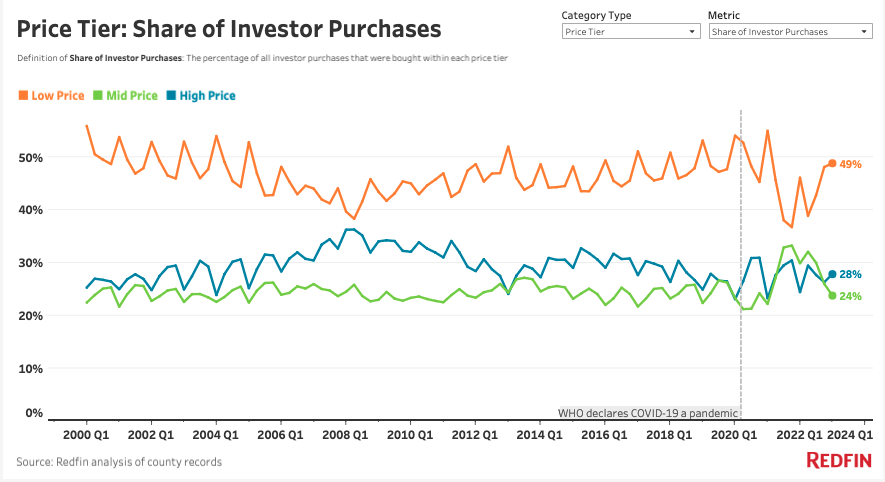
Investors bought 24.9% of all low-priced homes that were purchased in the metros tracked by Redfin in the first quarter, comparable with the 25.3% record high set a year earlier. Meanwhile, they bought 12.5% of mid-priced homes that were purchased, the lowest share in two years, and 15.3% of high-priced homes.
The investors who are still in the market have gravitated toward more affordable properties due to still-high home prices and elevated interest rates. A record 41.1% of investor purchases in the first quarter were starter homes— homes with 1,400 or fewer square feet—up from 37.2% a year earlier.
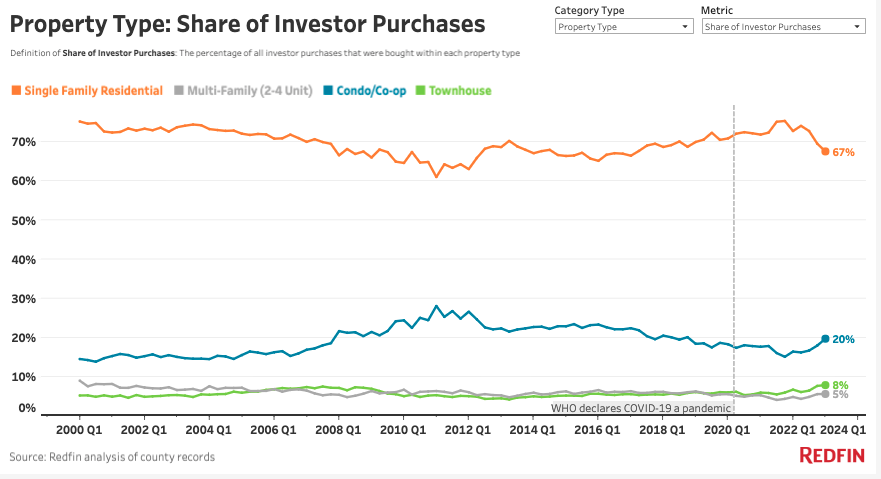
This helps explain why condos are making up an increasingly large share of investor purchases. Condos represented one of every five (19.5%) investor purchases in the first quarter, the highest share since 2018. Meanwhile, single-family homes made up 67.3% of investor purchases, the lowest share since 2017. Single-family homes may also be taking up a shrinking share because there are so few available for sale.
Metro-Level Summary: Investor Home Purchases, Q1 2023
The table below includes the 40 most populous metros for which data was available.
| Metro area | Investor purchases, YoY change | Total value of homes bought by investors | Median sale price of homes bought by investors | Share of purchased homes bought by investors | Share of purchased homes bought by investors, YoY change (percentage points) |
| Anaheim, CA | -32.0% | $1,448,672,500 | $1,100,000 | 22.6% | 1.7 ppts |
| Atlanta, GA | -66.0% | $944,178,182 | $251,500 | 19.6% | -14.0 ppts |
| Baltimore, MD | -8.8% | $320,849,103 | $140,000 | 21.6% | 4.6 ppts |
| Charlotte, NC | -66.0% | $367,286,342 | $257,000 | 18.4% | -14.1 ppts |
| Chicago, IL | -36.2% | $620,873,163 | $190,000 | 14.8% | 1.4 ppts |
| Cincinnati, OH | -25.0% | $178,024,012 | $151,600 | 20.4% | 0.7 ppts |
| Cleveland, OH | -23.2% | $136,200,225 | $87,100 | 24.0% | 2.1 ppts |
| Columbus, OH | -48.1% | $169,537,598 | $182,500 | 16.9% | -6.8 ppts |
| Denver, CO | -50.0% | $598,946,228 | $474,428 | 13.4% | -3.8 ppts |
| Detroit, MI | -30.5% | $87,218,698 | $78,500 | 22.0% | -0.8 ppts |
| Fort Lauderdale, FL | -46.9% | $709,579,678 | $340,000 | 18.4% | -3.1 ppts |
| Jacksonville, FL | -56.6% | $327,601,255 | $225,000 | 22.0% | -10.7 ppts |
| Las Vegas, NV | -60.2% | $662,175,991 | $370,000 | 19.4% | -7.8 ppts |
| Los Angeles, CA | -39.5% | $4,115,555,181 | $1,045,000 | 19.9% | 0.0 ppts |
| Miami, FL | -44.9% | $1,611,854,434 | $435,000 | 30.0% | 0.3 ppts |
| Milwaukee, WI | -21.6% | $114,763,069 | $143,500 | 18.6% | 2.6 ppts |
| Minneapolis, MN | -42.1% | $248,804,155 | $270,000 | 11.1% | -1.1 ppts |
| Montgomery County, PA | -44.5% | $101,547,444 | $236,250 | 10.6% | 0.2 ppts |
| Nashville, TN | -60.4% | $327,012,236 | $340,000 | 15.4% | -9.3 ppts |
| Nassau County, NY | -67.9% | $324,495,493 | $590,000 | 17.2% | 4.3 ppts |
| New Brunswick, NJ | -29.0% | $369,293,327 | $371,500 | 13.4% | 1.5 ppts |
| New York, NY | -35.6% | $2,366,641,622 | $771,998 | 20.0% | 4.0 ppts |
| Newark, NJ | -41.4% | $204,319,156 | $374,950 | 15.5% | -0.1 ppts |
| Oakland, CA | -38.5% | $622,508,500 | $932,500 | 14.0% | 0.2 ppts |
| Orlando, FL | -54.7% | $589,909,704 | $300,000 | 20.1% | -6.7 ppts |
| Philadelphia, PA | -56.5% | $149,419,525 | $115,000 | 20.3% | 1.4 ppts |
| Phoenix, AZ | -64.2% | $1,596,113,537 | $400,000 | 18.2% | -11.1 ppts |
| Portland, OR | -45.1% | $254,677,337 | $490,000 | 11.5% | -0.4 ppts |
| Providence, RI | -9.6% | $83,535,695 | $304,000 | 11.5% | 3.4 ppts |
| Riverside, CA | -47.1% | $1,011,349,453 | $530,000 | 18.0% | 0.6 ppts |
| Sacramento, CA | -49.9% | $478,313,000 | $540,000 | 16.8% | -1.9 ppts |
| San Diego, CA | -35.9% | $1,471,604,500 | $899,000 | 21.7% | 0.5 ppts |
| San Francisco, CA | -35.6% | $1,039,162,500 | $1,662,500 | 20.9% | 1.0 ppts |
| San Jose, CA | -38.8% | $647,933,500 | $1,630,000 | 15.4% | 0.6 ppts |
| Seattle, WA | -15.5% | $675,823,193 | $794,500 | 12.9% | 2.8 ppts |
| Tampa, FL | -54.8% | $786,096,324 | $280,000 | 17.5% | -7.6 ppts |
| Virginia Beach, VA | -35.6% | $131,120,930 | $166,000 | 13.1% | 1.0 ppts |
| Warren, MI | -40.2% | $95,401,718 | $140,000 | 10.6% | 0.2 ppts |
| Washington, D.C. | -30.7% | $579,603,314 | $390,000 | 10.6% | 1.4 ppts |
| West Palm Beach, FL | -28.8% | $919,087,432 | $450,000 | 17.3% | -0.6 ppts |
| National (metros tracked by Redfin) | -48.6% | $27,487,089,254 | $427,901 | 17.6% | -2.7 ppts |
Methodology
For this analysis, we looked at county sale records for homes purchased from January 2000 through March 2023. We define an investor as any buyer whose name includes at least one of the following keywords: LLC, Inc, Trust, Corp, Homes. We also define an investor as any buyer whose ownership code on a purchasing deed includes at least one of the following keywords: association, corporate trustee, company, joint venture, corporate trust. This data may include purchases made through family trusts for personal use.
We analyzed home sales in the 50 most populous metro areas, but only included 40 metros in this report due to non-disclosure of sale prices in some counties.
For the price-tier analysis, we looked at all home sales in a given year and sorted each sale into one of three buckets: low-priced, mid-priced or high-priced. Low-priced means a home’s sale price was in the bottom tercile of local sale prices, while mid-priced means it was in the middle tercile and high-priced means it was in the top tercile.


