
Homebuyers in cities across the U.S. are saying affordability is their biggest concern as home prices rise and inventory shrinks. But there is some good news for working-class homebuyers. Across 40 large U.S. cities, 55 percent of homes for sale last month were affordable for a working-class household and still between two and four bedrooms in size. Homes of this size matter because affording a home that’s big enough to comfortably fit a family is more difficult than affording a studio or a one-bedroom condo.
Where can a working-class family find an affordable home?
In 25 major U.S. cities, more than half the listings were affordable last month. Detroit was the most affordable U.S. city for a working-class household. Almost 97 percent of Detroit’s listings were big enough and affordable on a working-class household income. More than 80 percent of homes were affordable to working-class households in Cleveland, Baltimore, Columbus, Memphis and Philadelphia. But in San Francisco, the least affordable city, just 3 percent of these homes were priced within reach of a working-class household.
| Working Class Affordability Ranking | City | % Inventory Affordable on a Working-Class Household Income and Between 2 and 4 Bedrooms, as of July 2016 | Change in Inventory Affordable for the Working Class Between Jan 2014 and July 2016 | Median Price of a 2-4 Bedroom Home | Working-Class Annual Household Income | Top Affordable Price |
|---|---|---|---|---|---|---|
| 1 | Detroit, MI | 97% | 1% | $41,500 | $52,500 | $307,908 |
| 2 | Cleveland, OH | 92% | -1% | $85,000 | $49,500 | $290,313 |
| 3 | Baltimore, MD | 90% | -4% | $170,500 | $70,500 | $413,476 |
| 4 | Columbus, OH | 84% | -9% | $176,200 | $55,500 | $325,502 |
| 5 | Memphis, TN | 83% | -5% | $136,000 | $47,500 | $278,583 |
| 6 | Philadelphia, PA | 82% | -6% | $202,000 | $62,500 | $366,557 |
| 7 | Kansas City, MO |
80% | -8% | $237,700 | $57,500 | $337,232 |
| 8 | Arlington, TX | 74% | -13% | $259,950 | $59,500 | $348,962 |
| 9 | Minneapolis, MN | 74% | -11% | $298,900 | $68,500 | $401,746 |
| 10 | Jacksonville, FL | 71% | -16% | $237,457 | $52,500 | $307,908 |
| 11 | Omaha, NE | 71% | -15% | $261,000 | $57,500 | $337,232 |
| 12 | Fort Worth, TX | 69% | -17% | $295,000 | $59,500 | $348,962 |
| 13 | Tulsa, OK | 67% | -14% | $216,950 | $49,500 | $290,313 |
| 14 | Las Vegas, NV | 65% | -17% | $298,738 | $52,500 | $307,908 |
| 15 | Tucson, AZ | 65% | -3% | $249,544 | $46,500 | $272,718 |
| 16 | San Antonio, TX | 65% | -12% | $278,450 | $53,500 | $313,772 |
| 17 | Chicago, IL | 64% | -11% | $329,894 | $61,500 | $360,692 |
| 18 | Sacramento, CA | 63% | -18% | $320,000 | $59,500 | $348,962 |
| 19 | Virginia Beach, VA | 62% | -5% | $322,000 | $59,500 | $348,962 |
| 20 | Raleigh, NC | 60% | -13% | $329,800 | $62,500 | $366,557 |
| 21 | Charlotte, NC | 58% | -16% | $293,000 | $52,500 | $307,908 |
| 22 | Fresno, CA | 55% | -16% | $264,950 | $45,500 | $266,853 |
| 23 | Phoenix, AZ | 54% | -18% | $324,500 | $53,500 | $313,772 |
| 24 | Atlanta, GA | 52% | -16% | $327,900 | $57,500 | $337,232 |
| 25 | Houston, TX | 52% | -20% | $359,952 | $58,500 | $343,097 |
| 26 | New Orleans, LA | 50% | -22% | $314,000 | $47,500 | $278,583 |
| 27 | Washington, DC | 48% | -13% | $582,450 | $92,500 | $542,504 |
| 28 | Denver, CO | 33% | -24% | $549,500 | $64,500 | $378,287 |
| 29 | Oakland, CA | 32% | -35% | $648,888 | $80,500 | $472,125 |
| 30 | Austin, TX | 32% | -15% | $479,000 | $62,500 | $366,557 |
| 31 | Dallas, TX | 32% | -32% | $539,950 | $59,500 | $348,962 |
| 32 | Miami, FL | 26% | -25% | $454,900 | $48,500 | $284,448 |
| 33 | Portland, OR | 26% | -30% | $529,700 | $58,500 | $343,097 |
| 34 | Seattle, WA | 23% | -34% | $631,400 | $69,500 | $407,611 |
| 35 | Long Beach, CA | 20% | -10% | $584,950 | $60,500 | $354,827 |
| 36 | Boston, MA | 20% | -22% | $837,000 | $74,500 | $436,936 |
| 37 | San Jose, CA | 15% | -21% | $841,259 | $93,500 | $548,369 |
| 38 | San Diego, CA | 14% | -18% | $832,900 | $64,500 | $378,287 |
| 39 | Los Angeles, CA | 9% | -13% | $915,018 | $60,500 | $354,827 |
| 40 | San Francisco, CA | 3% | -5% | $1,213,500 | $80,500 | $472,125 |
| Affordable two- to four-bedroom housing inventory for working-class households in 40 of the largest U.S. cities; data from Redfin and the U.S. Census | ||||||
How has affordable housing inventory changed since 2014 for working-class households?
It’s up in Detroit and down everywhere else. In some cities, inventory for working-class households is disappearing fast. The next chart shows the 10 cities that lost the most affordable housing supply in the last two-and-a-half years, measured by the percentage of listings a working class household could afford that were also two to four bedrooms in size. Affordable inventory disappeared the fastest in Oakland, Seattle and Dallas.
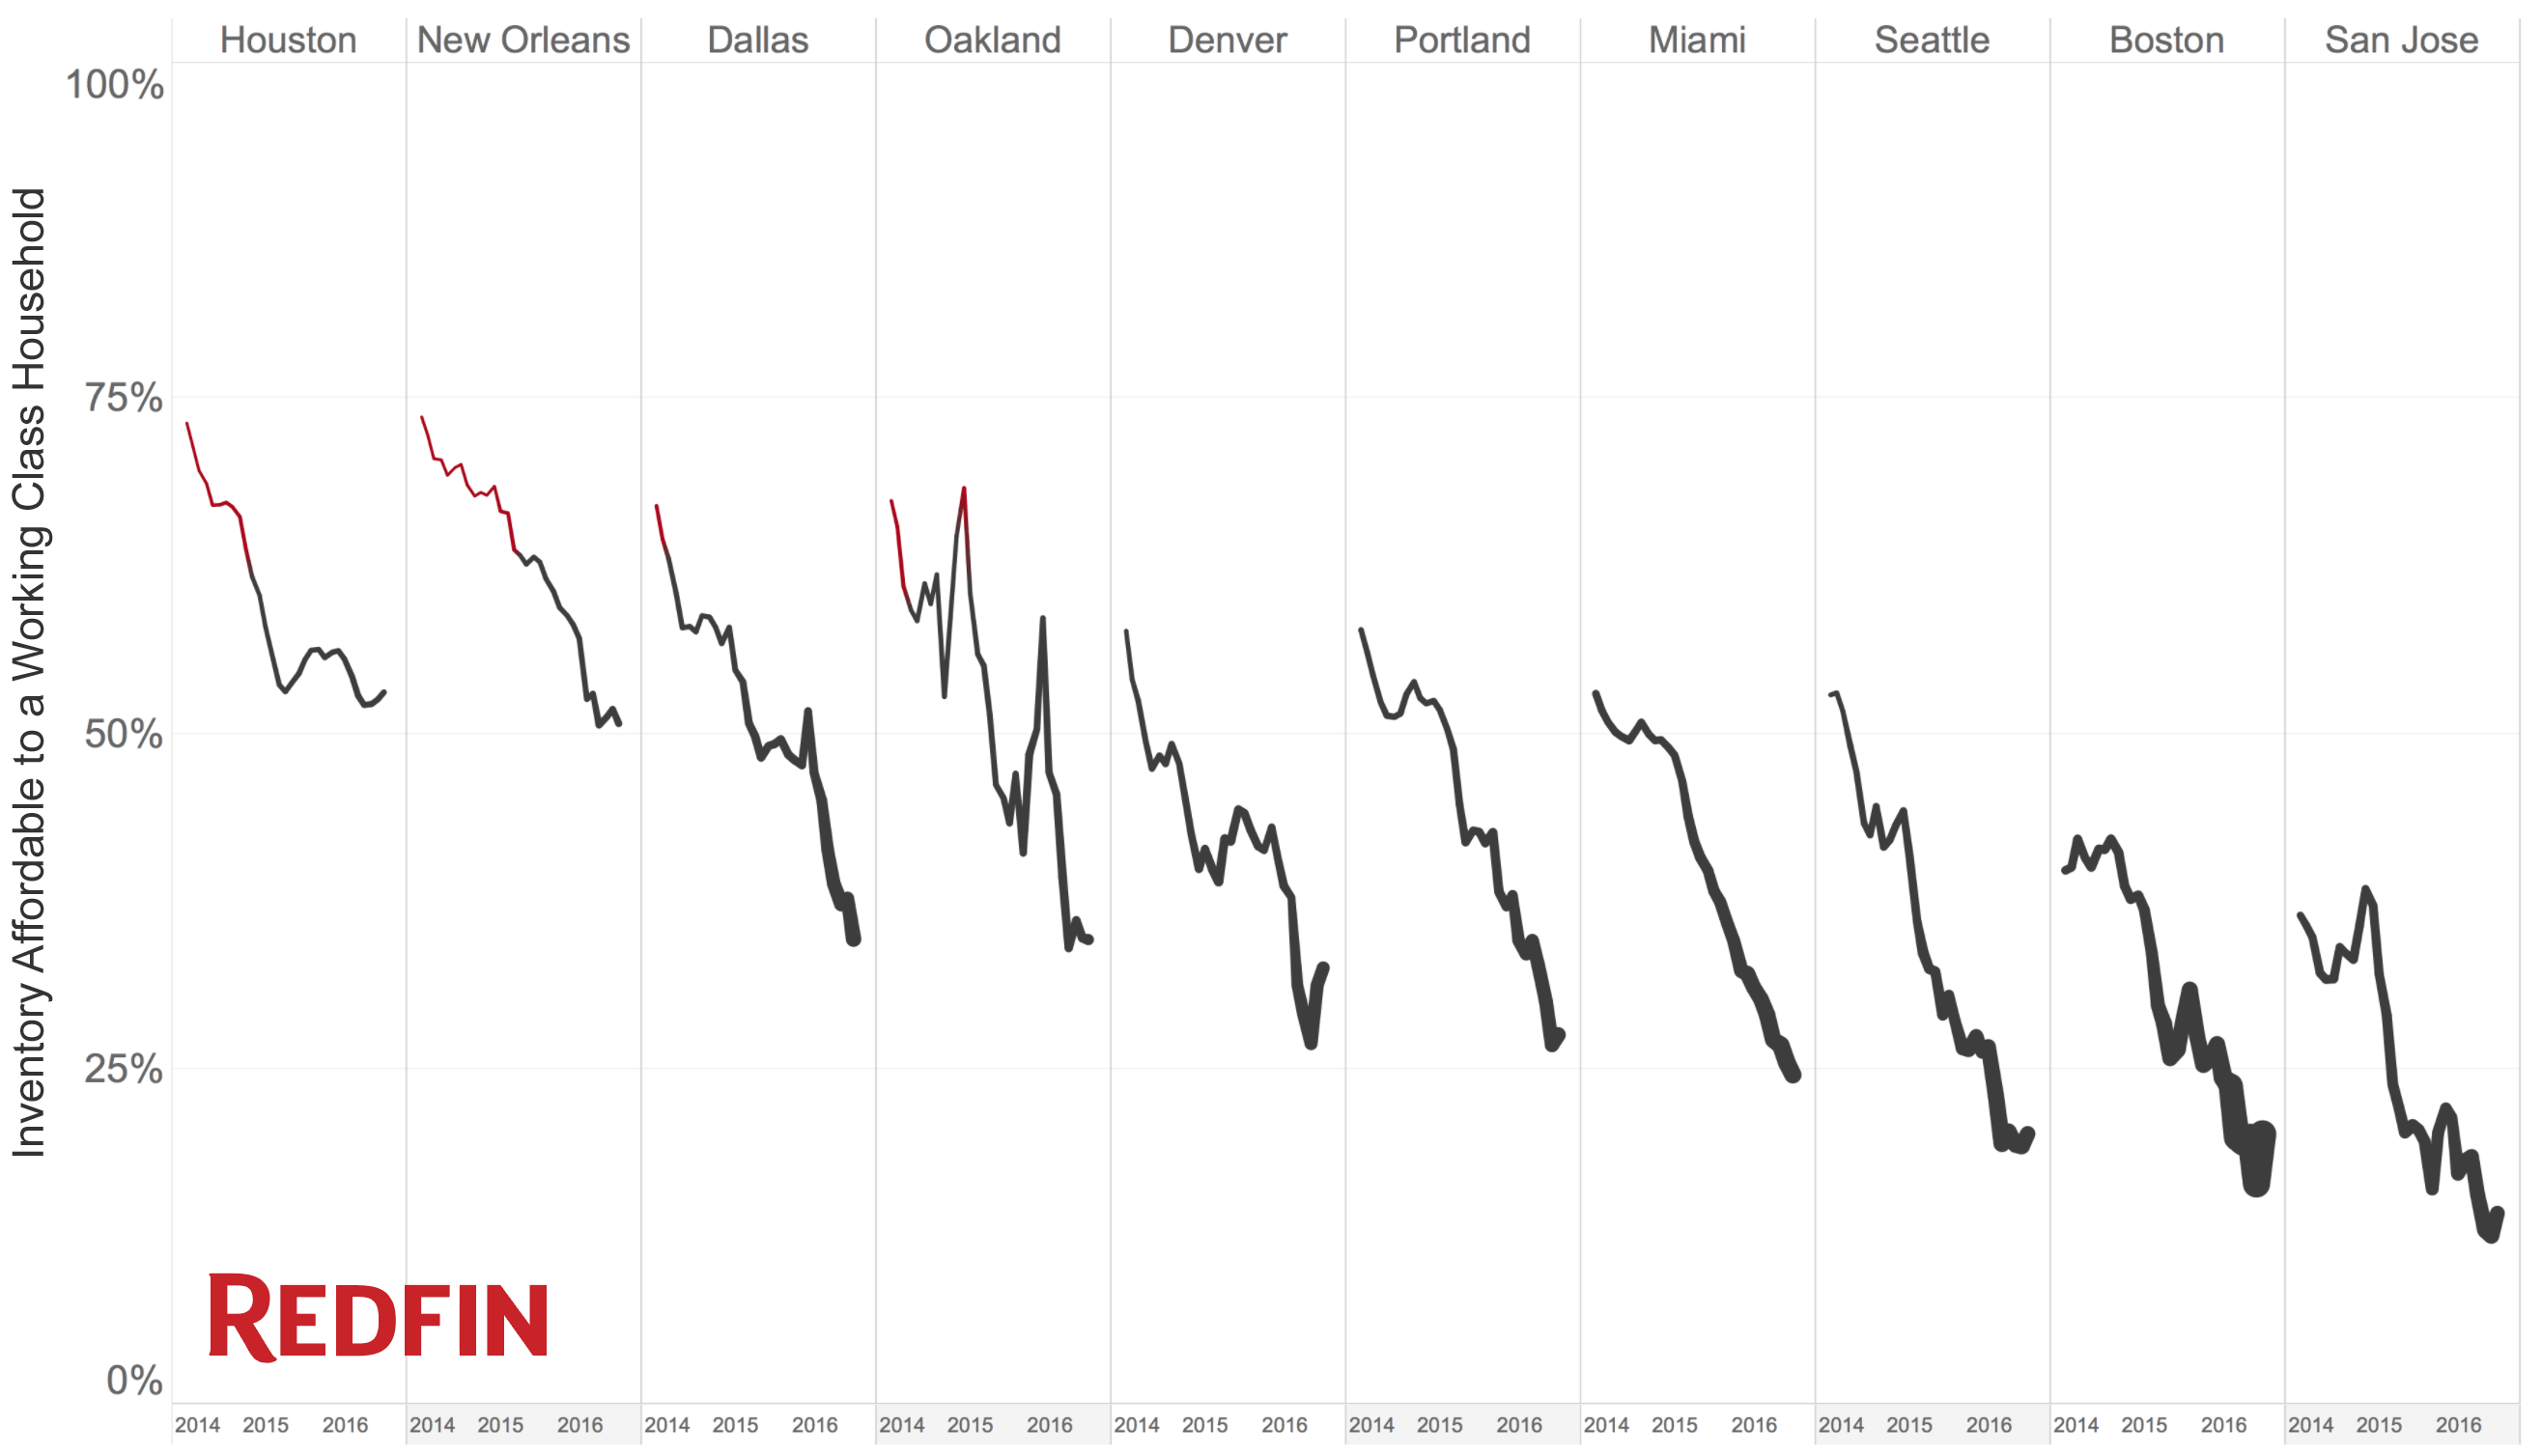
In the chart above, the red lines indicate when the median price of a two- to four-bedroom home was within reach for a working class household. The lines turn black when it would take more than one household to afford home. Thicker lines mean the median price of one of these homes is further out of reach. The thickest line means it would take two or more working class households to afford a home.
The outlook
While it’s not surprising that affordable inventory is disappearing fast, it is surprising that 55 percent of homes are big enough and still affordable while homeownership is at its lowest rate in over 50 years.
The problem, and the surprise, has something to do with affordable homes clustering together. Neighborhoods with a mix of home prices cover just 13 percent of U.S. cities. This makes it difficult to find affordable homes for sale in the neighborhoods where people with higher incomes tend to live.
The solution? More housing inventory made of a healthy mixture of home types for people of all incomes. A mixed-housing inventory is good for more than just affordability. In these areas, households with different incomes are neighbors, a living arrangement that gives lower income families a better shot at getting ahead.
Method and Data
Housing data came from Redfin. Incomes came from the U.S. Census.
To get a single working-class household income value for each city, Redfin took the 50th percentile household income for a city’s parent metro region in 2014. Redfin then defined the affordable price break for each city by taking the working-class household income and applying 28 percent of monthly income to the mortgage and principal on a 30-year loan at 4 percent, assuming a 20 percent down payment, and not factoring in property taxes or insurance. Note that this definition uses 28 percent of monthly income instead of 30 percent to make up for the taxes and insurance not being factored in. Also, defining “the working class” is a messy business. To account for local variations in the cost of living, incomes were defined using the greater metro area of each city. Still, the affordable price is optimistic–the working-class household income gets pegged near the upper limit of the working-class population, then the affordable price assumes each household has saved enough for a down payment.
The share of affordable working-class inventory came from comparing the total number of listings in a city to the number of two- to four-bedroom listings with an affordable price.


