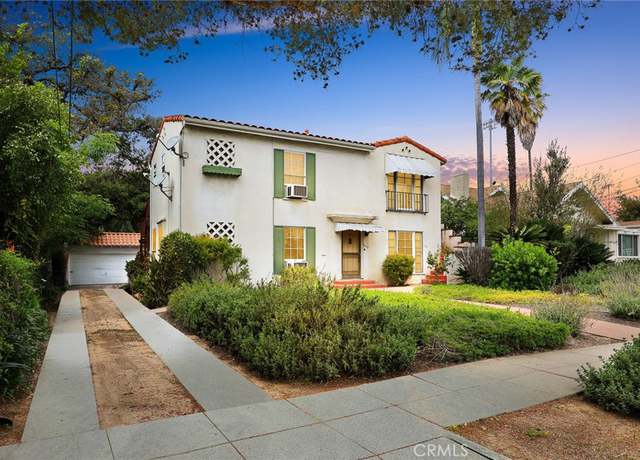
Nestled within the picturesque Rose Villa Oakdale Landmark District, this 1937 Spanish-style architecture presents an enticing investment opportunity. The property features two living quarters, each comprising 2 bedrooms and 1 full bathroom. Spacious living rooms with wood beamed ceilings and arches allow for abundant natural light. The galley kitchens boast granite countertops and matching cabinets, while interior laundry facilities add convenience. Outside, the lush lot is adorned with green plant life and fruit trees, creating a serene and parklike setting. Residents can enjoy community events at Pasadena City College or take leisurely strolls through nearby Grant Park. Additionally, the
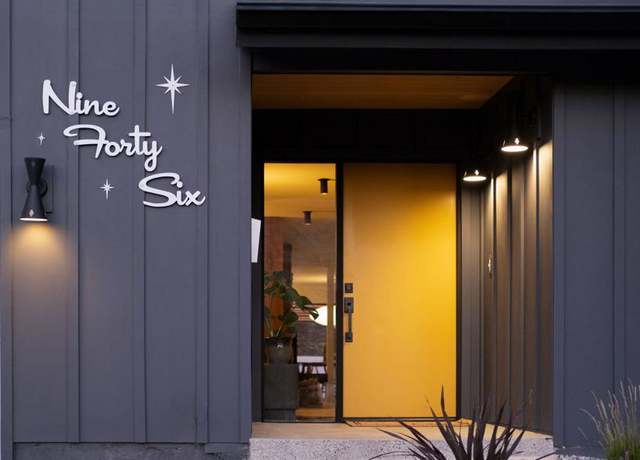
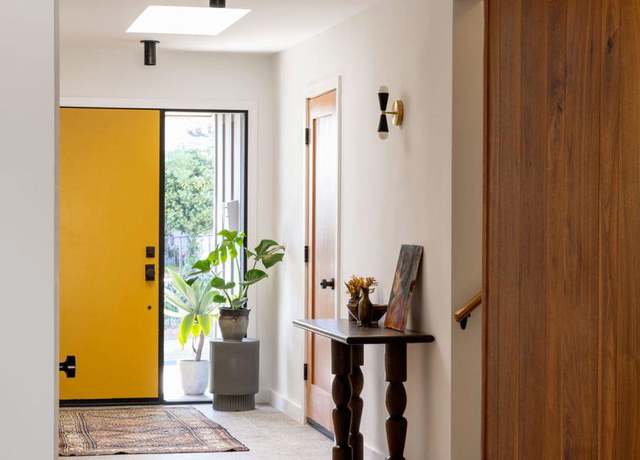
If you're looking for a slice of that Palm Springs vibe in the city, come take a drive down Easy Street to Arroyo View Estates. Tucked between South Pasadena and San Rafael Hills and known originally as home of players from the Dodgers and the Rams this modern Highland Park neighborhood has been attracting residents interested in mid-century architecture and design for decades. Restored practically from top to bottom the residence has been taken care of with exquisite craftsmanship and thoughtful finishes. The bright and spacious entryway is finished with Spanish terrazzo tile which transitions seamlessly to white oak flooring. The kitchen comes equipped with high end Italian appliances fro
This 2-bedroom with convertible loft townhome style PUD is located in the beautiful California Rose Court community and has recently been refreshed for sale. This flexible floor plan allows the seller to decide how to best use the space. The property is currently virtually staged with the living room and dining area sharing a fireplace and views to the backyard. The remodeled modern kitchen is adjacent to an area that could be used as an eating area or relaxing spot. There is also a remodeled powder room downstairs and direct access to the 2-car garage. Upstairs, the primary suite features a walk-in closet, private balcony, and dual sinks in the bathroom. The laundry area is upstairs for co
Introducing 484 N Daisy Ave, Pasadena - a captivating residence nestled on a beautiful tree-lined street in the highly sought-after Daisy-Villa area. This home exudes charm and sophistication, offering an array of desirable features for modern living. Upon arrival, you're greeted by the inviting curb appeal of this meticulously maintained property. Step inside to discover a spacious living area adorned with a fireplace and a picturesque window, creating an inviting ambiance for gatherings and relaxation. Wood flooring graces the living room, dining room, hall, and two of the bedrooms, adding warmth and character to the interior. The recently remodeled kitchen is a chef's dream, boasting gr
A Modern home in the charming Pasadena neighborhood of Normandie Heights. Set amidst an array of Craftsman Bungalows and English-style Cottage Homes, this new offering on Howard St presents a reimagined residence boasting 4 bedrooms and 3 bathrooms, including 2 en-suites. Additionally, this property features a separate permitted dwelling (ADU) comprising 2 bedrooms, 2 bathrooms, and its own private backyard space, a versatile opportunity ideal for accommodating a large or extended family, establishing a separate home office, or generating rental income. Recently stripped down to its framework and refurbished throughout, the home features contemporary fixtures and an updated interior.
Welcome to this Prime Location Single Story home in Pasadena. This home is located in a desired neighborhood on a coveted lot over 7700 sq ft. It is ready to move in with 2 bedrooms and 1 bathroom with plenty of room to ad on, a detached garage with gated parking. The backyard is private and ready to make it your own! Do not miss your chance to see this home!
Welcome to this beautifully maintained townhouse nestled in the serene neighborhood of Lamanda Park in Southeast Pasadena. Ideal for first-time homebuyers, this delightful residence features an updated kitchen with modern appliances and sleek finishes, perfect for culinary enthusiasts. The unit also boasts an oversized patio that provides a private, spacious outdoor retreat for relaxation or entertaining. This townhouse boasts a strategic location that combines suburban tranquility with the convenience of urban living. Situated just minutes away from vibrant local restaurants, you’ll enjoy a variety of dining options right at your doorstep. Whether you're in the mood for a cozy cafe o
Nestled on a private, gated lane on the grounds of the spectacular Langham Huntington Hotel lies a treasured enclave of thirteen historic bungalows designed in the 1920s by famous architects. Rarely on the market, these Huntington Cottages represent a unique & prized opportunity for a discerning buyer looking for a special retreat to call home! Clovelly Cottage, by famed architects Marston & Van Pelt is an exemplary two-story Monterey Colonial treasure that sits on a prominent view knoll. Beloved by its long-time owners, this exceptional residence boasts grand-scale rooms with numerous windows, French doors, balconies & abundant light. Taken down-to-the-studs in 1999, this
A HIGH CAP Rate and almost turnkey 12-unit + 3 ADUs garden style apartment investment opportunity located in the highly desirable City of Pasadena, CA. With CAP Rate Close to 5% in a Class-A Location, Single-story duplexes layout, and Arcadia adjacent location, this offering provides an extremely rare opportunity for investors to acquire a beautifully upgraded apartment in an excellent location in Pasadena. Six out of 12 units (50%) have been completely upgraded and provides new owners with immediate market rent without having to deal with tenant relocation and units upgrade process. The property is a beautiful asset with attractive four single-story duplexes and one two-story fourplex in t
Welcome to 1530 Lancashire Place! This fabulous Pasadena mid-century is located at the end of a peaceful cul-de-sac, in the heart of the prestigious Linda Vista neighborhood. Built in 1964, this home was thoughtfully reimagined and remodeled in 2008 to create the most efficient use of space within the existing footprint, while highlighting original features. Note the stunning exterior stone accent wall that seamlessly continues inside the entryway. The communal areas favor an open floor plan with a spacious kitchen, breakfast nook, formal dining room, and living room. There are four bedrooms, one currently used as den/guest room and three more located off a privacy wing. Two spacious bedroo
Beautiful house with a panoramic priceless view of the city and Los Angeles. Single story house with high ceilings throughout. This house is one of a kind, too many features to list. Also, property includes a 3 bedroom and 1.5 bath guest house which has its own gated privacy. Main house has a finished basement with over 3000 square feet additional space.
Stunning 1930's brick Traditional located in coveted Northeast Pasadena just minutes from East Washington Village, Eaton Canyon Nature Reserve, hiking trails, Hastings Ranch shopping, and Old Pasadena. This picture-perfect charmer is just the home you have been waiting for - from the beautiful neighborhood location with sidewalks, old fashioned lamp posts, and stunning mountain views, to the pride of ownership and professionally designed landscaped gardens. This lush and peaceful property features multiple areas for entertaining and relaxing, including two pergola covered patios, a separate outdoor dining area, a spa, a plethora of established fruit trees, and a separate 254 sq. ft. (taped)
Welcome to this beautiful three bedroom, two bath 2,047 square foot, 1926 English on one of the area'smost sought-after streets. The gracious residence, nestled in the historic Rose Villa-Oakdale LandmarkDistrict, is filled with the unparalleled artistry and quality of the period. The home welcomes you in via awide front porch that steps up into a gorgeous living room with a magnificent Palladian window as wellas a coved ceiling that leads your eye to the impressive Batchelder style fireplace. In addition, there is astately formal dining room, a light and bright kitchen, a lovely breakfast room, as well as a separatelaundry or mud room. The three spacious bedrooms include a primary bedroom,
This top floor, end unit property is in a fantastic location in the popular Cordova Park Villas complex! This property features 2 BR/2.5 BA plus a loft space and is very light and bright with many south facing windows. There are sunrise & sunset views from 4 balconies/patios on three sides. There is handsome laminate flooring throughout the living area. As you enter the property there is a nice entry that leads to the spacious living room with cathedral ceilings, a gas fireplace, and is open to the dining area which has direct access to a balcony. There is plenty of room here to dine al fresco or enjoy the sunsets with your favorite beverage! Off the dining room is access to the updat
Located in the San Rafael Hills neighborhood, this two-story home seamlessly blends original mid-century with tasteful modern upgrades. Recently remodeled, this three-bed, three-bath spans 2,310 square feet on an 8,568 square foot lot. This home also includes a newer roof equipped with fully financed solar panels along with an indoors/outdoor built-in speaker system. The main level features an open-concept design, complete with wet bar and floor-to-ceiling windows offering stunning city views! On a clear day even capture a glimpse of the Griffith Observatory! This amazing view can also be seen in the primary bedroom and bathroom which features a large closet, soaking tub, double vanity sink
Welcome to an exquisite 1-story English Manor-style home, meticulously renovated to blend timeless elegance with modern sophistication. Bathed in natural light, this captivating residence boasts a seamless fusion of classic charm and contemporary luxury. Upon entry, you are greeted by the warmth of wide-plank hardwood flooring that guides you through the spacious floor plan. The heart of the home is the expansive living area, where the extensive use of stone accents and a raised ceiling adds a sense of grandeur and character. This redesigned great room marries the informal dining area, family/media room, living room, and kitchen and allows for cozy evenings by the fireplace or large-scale g
In the heart of Central Pasadena, this refreshed end unit townhouse with light streaming in on 3 sides, is tucked back into a quiet, off-street location in the complex and includes in-unit laundry plus a large private 2 car garage with extra storage. With its 1,066 SQ FT, it has only 1 common wall and nobody above or below, providing privacy not commonly found in many townhouses. The open plan living/dining area is light and bright with views of the San Gabriel Mountains, wood-like floors, and flows directly out to the dining sized deck. The comfortable and naturally lit kitchen has generous counter space, 4-burner gas stove/oven, stainless refrigerator, generous cabinets space including a
Investors, looking for your next fix and flip project? This fixer upper awaits. This contractor special property is being sold in as-is condition and in need of TLC. Major repairs and upgrades needed but high ARV potential. Convert garage to ADU to dramatically increase the value on this Pasadena property situated in a perfect neighborhood to maximize your next investment. Cash or hard money only.
Located within Pasadena's picturesque Brigden Ranch neighborhood, this duplex epitomizes the perfect fusion of suburban serenity and urban accessibility. Tucked away amidst tree-lined streets, the property boasts an ideal location just moments away from Pasadena's vibrant shopping, fine dining establishments, cultural landmarks, schools, PCC , CAL Tech and more. As you step inside, natural light floods the interior, creating a sense of freshness and brightness throughout. The front house features three bedrooms and two bathrooms, with the lower level comprising a welcoming living room, formal dining room, two cozy bedrooms, and a dream kitchen complete with a charming breakfast nook—i
Welcome to this spacious and luxurious condo on Millionaire's Row boasting 2 generously sized bedrooms, 2 bathrooms, an office/den, and a beautifully designed open floor plan with gorgeous vinyl plank flooring throughout. The spacious living room features a cozy fireplace, wet bar, recessed lighting, and a sliding glass door leading to a private balcony overlooking Orange Grove, flooding the space with natural light. The kitchen is a chef's dream with granite countertops, a convenient sit-in bar area, a pantry, stylish tile backsplash, stainless steel appliances, and a charming breakfast nook. For added convenience, there's a laundry closet equipped with a washer and dryer. On the opposite
Originally designed by Architect Charles E. Post and nestled in the highly desirable and historic Prospect Park neighborhood, this tastefully updated 1924 Mediterranean Revival home offers a blend of classic charm and modern convenience. The main house boasts impressive architectural details, including a striking barrel ceiling and arched windows in the formal living room, complemented by a cozy fireplace. The kitchen has been renovated, and the main floor includes a formal dining room, a bedroom and bathroom. Upstairs, the primary suite features a walk-in closet, bathroom, and private balcony. Two additional bedrooms and a bathroom complete the second floor. An expansive secondary structur
This exceptionally rare, three-bedroom, top-floor 2006 condo is ideally located in the heart of Old Town Pasadena. Step into a spacious, open-concept living space that brims with potential. The first floor shines with modern wood flooring and dramatic floor-to-ceiling glass walls that frame stunning views of Old Town, the San Gabriel Mountains, and the iconic City Hall. The large living room includes French doors that open to a spacious balcony, perfect for enjoying panoramic urban vistas and outdoor dining in the warmer months. The kitchen is equipped with stainless steel appliances, European-style cabinetry, and a separate breakfast area, seamlessly blending into the living space for effo
$1,399,000
3 beds2.5 baths1,890 sq ft
35 N Raymond Ave #414, Pasadena, CA 91103
Berkshire Hathaway HomeServices California Properties
Spectacular custom built and designed, luxurious home, located in Pasadena’s desirable historical district is now available. This privately completely fenced estate boasts 3 large bedrooms each with its own bath and an additional guest powder room downstairs. The minute you enter you can see the exquisite detail design of modern work on the floor along with the staircase and just feel the cozy living room with fireplace on your left. As you continue you have a first floor family room and then an entertainment room(can be used as an office, 1 bedroom with private bath, powder room, formal dining room open to the grand kitchen with top-of-the-line appliances including a built in refrige
Nestled along the banks of the Arroyo Seco, 'The Villetta', crafted by architect Paul Loveland in 1924 as his personal abode and workspace, stands as a splendidly adorned Italian countryside retreat. Enveloped by a sun-drenched central courtyard, this residence exudes an aura of hospitality, boasting numerous architectural marvels: ornate wrought iron gates and balconies, solid oak doors adorned with studs, a meticulously carved stone fireplace, rich walnut beams, lofty cathedral ceilings, polished hardwood floors, and a modernized gourmet kitchen. The luminous master suite on the main level opens gracefully onto the secluded courtyard, while a welcoming guest suite also resides on this flo
Discover a new standard in modern living with this one-of-a-kind trilevel house. This home offers a stunning fusion of style, innovation, and functionality that is sure to captivate you. With a thoughtful design that incorporates three levels of sleek, modern elegance, this home boasts expansive living spaces that are both luxurious and practical. On the main level, a gourmet kitchen complete with top-of-the-line VIKING stainless steel appliances caters to every culinary desire. An open and spacious living and dining area promises the perfect setting for entertaining or relaxation. It is also seamlessly connected to a private balcony if you’d like to enjoy sounds of nature from Poppy
This is your starter home! Excellent East Pasadena Location. Lovely, quiet unit facing inner court yard with spacious patio opening to lounge and BBQ area. Fireplace in living room, updated kitchen, sunny bedroom with large walk-in closet, newer flooring. The Secured building features an updated Lobby, Elevator, Gym, Sauna, Billiards Room, Club Room, Community Courtyard, Laundry rooms on every level, Secured Bike Storage & New Roof (2022)!! Easy access to Old Town Pasadena, Huntington Library, Metro Gold Line, 210 FWY, PCC, Cal-Tech & conveniently located near Colorado Blvd, at the end of the Rose Parade route…this is a must see! Dog friendly.
This beautiful 2 bed, 2 bath condominium is located in the upscale Terra Bella in the heart of Pasadena. Situated on the second floor, this elegant unit provides the feel and privacy of a single-family home, while the Terra Bella boasts the amenities of a luxury hotel with gym, spa and pool on the rooftop. The inside of the unit is lined with crown molding, recessed lights granite counter tops, and maple engineered hardwood floors. The picturesque great room features a lovely electric fireplaces, the exquisite kitchen features granite countertops, Italian cabinets, and Viking Professional appliances. The large master bedroom includes a walk-in closet and a charming fireplace along with a fu
Welcome to 425 Vineyard Place in Pasadena! This charming 2-bedroom, 2-bathroom home sits on a corner lot and has been beautifully updated throughout, offering modern comforts and stylish finishes. As you come inside, you'll be greeted by the inviting living room featuring wood-look tiled flooring, dual-paned windows allowing ample natural light, and recessed lighting creating a warm ambiance. The living area seamlessly flows into the open kitchen, which boasts stone countertops, an eat-in bar perfect for casual dining, and a sleek 5-burner gas range for culinary enthusiasts. Adjacent to the kitchen, a convenient door leads to a patio area, ideal for relaxing outdoors or enjoying al fresco m
Experience the epitome of comfort and convenience in this meticulously updated traditional home, ideally situated in Pasadena's coveted Villa Parke neighborhood. Adorned with a charming fence, this 2-bed, 2-bath residence exudes warmth at every turn. Step inside the heart of the home that boasts a gourmet kitchen, complete with quartz countertops, self-closing cabinet hinges, and an abundance of outlets. Discover a seamlessly integrated living space with contemporary LED Lutron light fixtures & recessed lighting, dual pane windows, and copper plumbing ensuring both style and efficiency throughout. Enjoy the convenience of the attached two-car garage that also houses a Samsung washer a
Location, Location, Helloooocation! Discover the best of Pasadena luxury and tranquility at 221 S Oak Knoll. Impeccably situated, this spacious 2 bed 2 bath apartment in this peaceful complex offers modern elegance with new hardwood floors and lofty high ceilings, a cozy fireplace, all with a well-designed layout enveloping you as you gaze out at the oaks. Head into your gourmet pivot-style kitchen with bar top, equipped with new quartz countertops, SS appliances and feat. high end touches like JennAir, Hansgrohe, Farrow & Ball paint, perfect for entertaining and daring culinary adventures. Enjoy the serenity of oversized bedrooms, including a primary suite with en-suite bath, walk-in
Perched atop a serene hillside in the sought-after enclave of Hastings Ranch, this remarkable residence presents a harmonious blend of luxurious living and breathtaking vistas. Behold panoramic views spanning the entirety of Pasadena and the majestic neighboring mountains, offering a tranquil and picturesque backdrop to your everyday life. This expansive abode boasts 4 bedrooms plus an office, and an array of inviting living spaces thoughtfully designed for both relaxation and entertainment. Step into the inviting living room, where a cozy fireplace beckons on chilly evenings, offering serene views of the meticulously landscaped backyard. Adjacent, the dining room and wet bar seamlessly flo
In the heart of Pasadena's coveted Bungalow Heaven area is this warm and inviting Craftsman circa 1913. Surrounded by native landscaping and a sweet picket fence, this very special home maintains much of its original charm with updates for easy modern living, including solar panels for energy efficiency. Just beyond the covered front porch, the living room boasts sought-after details such as hardwood floors, original woodwork, classic built-ins, and stained glass windows. Both the den and dining areas are spacious and open to the artistically remodeled kitchen with a breakfast nook. Generous in size, there is plenty of room for cooking and entertaining in this gathering space. A laundry roo
Welcome to this charming abode nestled in the heart of Pasadena. This inviting residence boasts 2 bedrooms and 2 bathrooms, providing ample space for comfortable living. Step inside to discover a bright and welcoming living room, adorned with beautiful laminate flooring and recessed lighting, creating a cozy ambiance for relaxation and entertainment. The updated kitchen is a chef's delight, featuring sleek cabinets and stylish backsplash tiles, offering both functionality and modern aesthetics (stove, rangehood and dishwasher included). Adjacent to the kitchen, the open dining area is a delightful retreat, enhanced by elegant wallpaper, a modern minimalistic light pendant, and tasteful wall
Step into your new home in the vibrant Pasadena Playhouse District! This spacious corner one-bedroom, one-bath condominium, built in 2003, enjoys approximately 870 square feet of living space, offering the ultimate in relaxation and rejuvenation. Prepare great meals in the tastefully updated kitchen, boasting new quartz counters, sinks, and faucets, along with sleek stainless-steel appliances. Entertain with ease in the spacious living and dining areas, providing ample room for gatherings. The sliding door in the dining area opens to a quaint patio. The open layout amplifies the sense of spaciousness, while large windows fill the interior with an abundance of natural light. Retreat to the
RELOCATION FEES PAID The Tenancy Has Been Completed Turned Over With Excellent MARKET RENTS | The hard work has been done for YOU - TURNKEY investment opportunity | Truly One of A Kind Investment Property - Superb Location nearby PCC, Cal Tech, VONS, and In & Out. Extensive "Pride of Ownership" remodeling was done in 2023. The Complex features 6 two-bedroom units and one 3-bedroom unit. These are highly desirable Townhouse-Styled Units with 7 onsite Parking Spaces. Remodeled interiors with newer interior paint, waterproof flooring, lighting and crown moldings throughout, custom cabinetry, quartz countertops, stainless steel appliances, new sub-panels, and technically upgrade
Luxury, elegance & quality craftsmanship blend seamlessly in this rare, new estate in the most prestigious Oak Knoll neighborhood, just a block from the historic Langham Huntington Hotel. Custom-designed & meticulously appointed with no expense spared, this exquisite residence sits prominently on a prime, quiet corner & features every conceivable amenity. The exceptional floorplan showcases grand rooms with tall ceilings, hardwood floors, Ralph Lauren light fixtures, Waterworks faucets, Marvin windows & doors, and a private elevator. This impressive South-facing home welcomes guests into a dramatic foyer with two-story ceiling & a picturesque circular staircase
Welcome to 625 E Del Mar Blvd #201, a recently renovated haven nestled near the vibrant streets of Lake Ave and Old Town Pasadena. This impeccably crafted condominium offers a harmonious blend of contemporary elegance and urban convenience, providing a refined retreat in one of Pasadena's most sought-after locations. Step inside this thoughtfully updated residence and be greeted by an expansive open-concept layout illuminated by an abundance of natural light, creating an inviting atmosphere for both relaxation and entertainment. The living area exudes modern sophistication with its chic finishes and stylish accents, offering a welcoming space to unwind or host gatherings with loved ones. Th
The Luxurious contemporary Cinema Lofts Building is located in the heart of Pasadena. This upscale 1 bed/ 1 bath loft style condo was built in 2008. Exclusive gated community offers all the convenience, carefree lifestyle, and comfort. This unit is located on the first floor featuring 10-foot ceiling and an abundance of natural light with beautiful modern tile, wood flooring with new interior paint. The open floor plan offers a sleek European style kitchen where you will find Caesar Stone counter tops, custom built cabinets, newer Samsung appliances, and a new stackable washer and dryer, tankless water heater and a newer A/C. The gorgeous bathroom offers a modern style finish. This unit al
Nestled in the foothills of Pasadena sits this secluded modern pool home in a park-like setting on half an acre. Meticulously maintained/enjoyed by the same family for over 50 years and ready for its next chapter to be written. Walls of glass throughout bring the outdoors in to bathe the home in beautiful natural light. A thoughtful single level floor plan offers ample public and private spaces, ideally designed for comfortable living and generous entertaining. Many original details in the spacious living area include: beadboard paneling, unique hidden breeze screen windows, operable clerestory windows and a dramatic stone fireplace and hearth. A charming kitchen overlooks the backyard and
Welcome to this elegant 3-bedroom, 3-bathroom Monterey Colonial located in coveted South Pasadena. Built in 1931, this timeless residence offers traditional charm with modern amenities. The main house features 2628 sf on two levels plus there is an additional 432 sf in the newly completed, detached ADU. There is also a separate 3 car garage! The generous 10,889 sf ft lot, features a quiet, fenced backyard with multiple patios and a lovely covered porch. The formal entry opens onto a beautiful staircase featuring Napolean baluster with barley twist carving. This center-hall colonial features a spacious living room with fireplace and elegant bookcases flanking French doors that open onto a co
This area's enrollment policy is not based solely on geography. Please check the school district website for more information.
Elementary schools
Middle schools
High schools
GreatSchools Summary Rating
9/10
Paradise Canyon Elementary School
Public, K-6
8/10
Rockdale Visual & Performing Arts Magnet
Public, K-6
8/10
Carver Elementary School
Public, K-5
7/10
San Pascual Elementary Science Technology Engineering Arts And Mathematics (steam) Magnet
Public, K-5
7/10
Norma Coombs Elementary
Public, K-5
Only showing 5 of
26 elementary schools.
School data is provided by GreatSchools, a nonprofit organization. Redfin recommends buyers and renters use GreatSchools information and ratings as a first step, and conduct their own investigation to determine their desired schools or school districts, including by contacting and visiting the schools themselves.Redfin does not endorse or guarantee this information. School service boundaries are intended to be used as a reference only; they may change and are not guaranteed to be accurate. To verify school enrollment eligibility, contact the school district directly.
Homes for sale in Pasadena have a median listing price of $1.19M. Some of these homes are Hot Homes, meaning they're likely to sell quickly.
What are some of the most popular neighborhoods in Pasadena?
Popular neighborhoods include Eagle Rock, Linda Vista, Oak Knoll, Northeast LA, North Arroyo, Casa Grande, West Pasadena, Glenoaks Canyon, Chevy Chase, and Hastings Ranch.
Pasadena, California, is well-served by a network of highways and freeways, including the prominent I-210 and SR-134, making car travel convenient. However, it's worth noting that the city often experiences high levels of traffic, particularly during peak commuting hours. In addition to car travel, Pasadena also offers an extensive public transportation system, with options like the Metro Gold Line light rail and numerous bus routes. These public transit options provide an alternative to driving, helping to alleviate some of the city's traffic congestion. Learn more on our Pasadena city guide.
What types of properties are available in Pasadena?
Pasadena, California offers a variety of single-family home types, including ranch-style, contemporary, and modern architectural designs, each with their own unique features and characteristics. These homes can be found throughout Pasadena, with many located in established neighborhoods and newer developments. Most properties in Pasadena offer a range of two to five bedrooms and were built in various years, providing a diverse selection for homebuyers. To explore different property types for sale in Pasadena, California, use the 'Home type' filter located above the active listings. Customize your search by selecting options like single-family homes, condos, townhomes, and more.
What is life like in Pasadena?
Living in Pasadena, California offers a vibrant and dynamic lifestyle. The city boasts a picturesque landscape with stunning mountain views and a mix of urban and suburban areas. The weather is characterized by mild winters and hot summers, perfect for outdoor enthusiasts. Pasadena provides a range of job opportunities across various industries, including technology, healthcare, and education. Residents can engage in a plethora of activities, such as exploring local parks, attending cultural events, and enjoying a diverse culinary scene.
What are the schools and amenities like in Pasadena?
Pasadena, California offers a variety of public amenities to its residents. The city is home to numerous restaurants, providing a wide range of culinary experiences. For those who enjoy the outdoors, there are several parks available for leisure and recreation. Grocery stores are conveniently located throughout the city, making daily shopping easy and accessible. Additionally, Pasadena offers other amenities such as libraries, fitness centers, and community centers, catering to a variety of interests and needs.
In the past month, 66 homes have been sold in Pasadena. In addition to houses in Pasadena, there were also 95 condos, 26 townhouses, and 24 multi-family units for sale in Pasadena last month. Pasadena is a moderately walkable city in Los Angeles County with a Walk Score of 69. Pasadena is home to approximately 137,867 people and 102,805 jobs. Find your dream home in Pasadena using the tools above. Use filters to narrow your search by price, square feet, beds, and baths to find homes that fit your criteria. Our top-rated real estate agents in Pasadena are local experts and are ready to answer your questions about properties, neighborhoods, schools, and the newest listings for sale in Pasadena. Our Pasadena real estate stats and trends will give you more information about home buying and selling trends in Pasadena. If you're looking to sell your home in the Pasadena area, our listing agents can help you get the best price. Redfin is redefining real estate and the home buying process in Pasadena with industry-leading technology, full-service agents, and lower fees that provide a better value for Redfin buyers and sellers.


 REDFIN IS COMMITTED TO AND ABIDES BY THE FAIR HOUSING ACT AND EQUAL OPPORTUNITY ACT. READ REDFIN'S FAIR HOUSING POLICY AND THE NEW YORK STATE FAIR HOUSING NOTICE.
 United States
 Canada