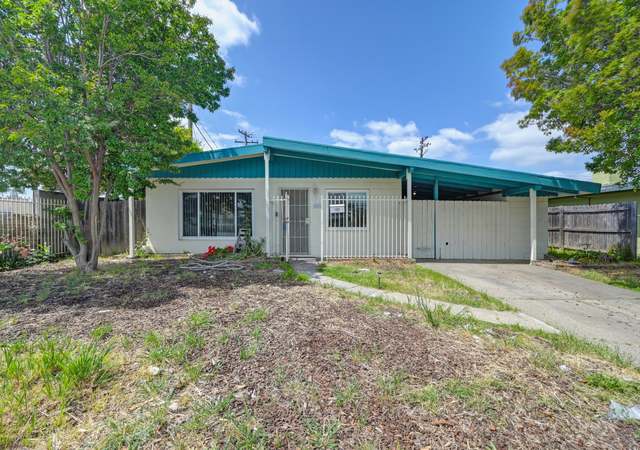
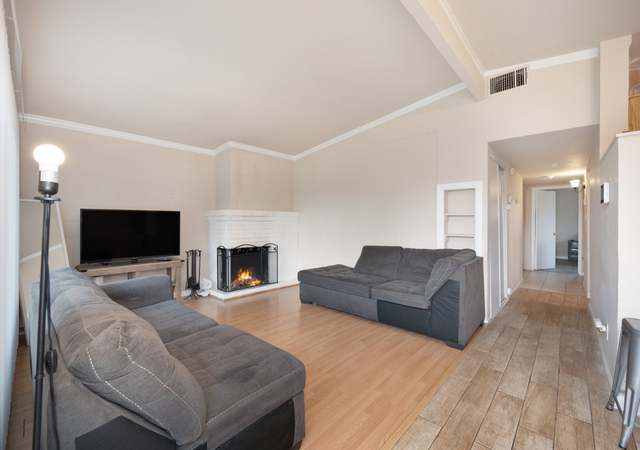
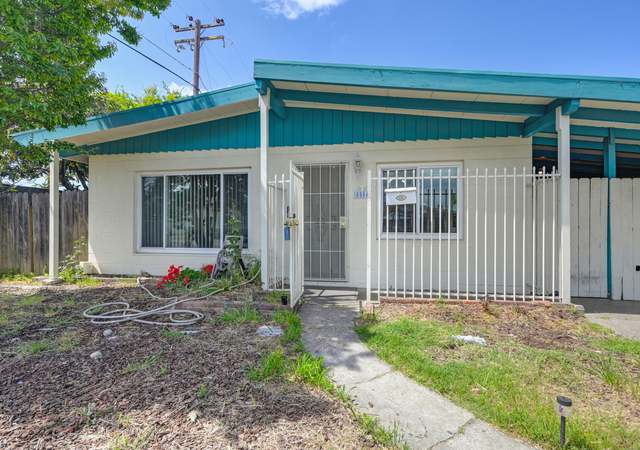
Gorgeous, move-in ready home in Tallac Village! This updated 3-bedroom, 2-bathroom residence offers a bright, open ambiance. The spacious family room boasts a charming wood-burning fireplace and vaulted ceilings. A stylish, open kitchen showcases stunning granite countertops, a dining area, and ample storage space. The primary suite includes a modernized bathroom and generous closet space. Additional highlights of this home include dual pane windows, solar panels, a covered carport, and extra storage. Conveniently situated just minutes away from shopping centers, schools, parks, and freeway access.
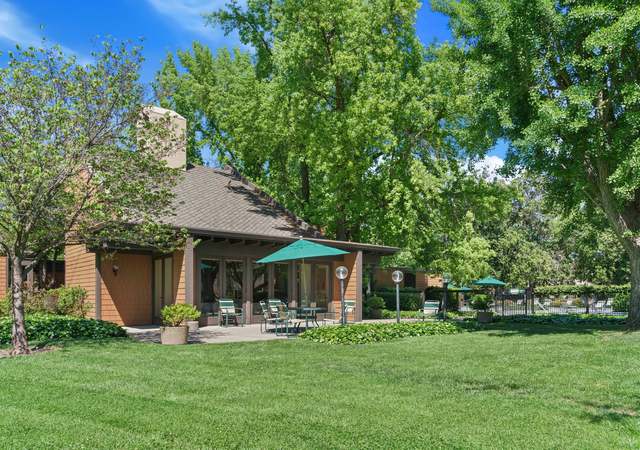
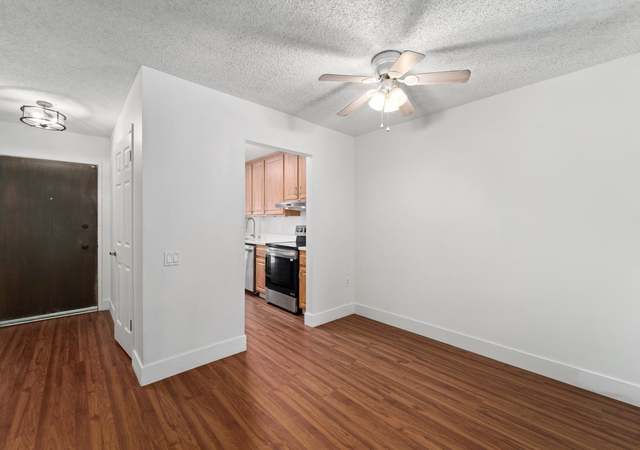
Welcome to Woodside Lane East, where convenience and comfort meet in this gated 2-bedroom, 1-bathroom gem. Step into a beautifully updated space boasting a modern kitchen, complete with sleek countertops and contemporary appliances. The bathroom has been recently updated and new laminated flooring throughout. Enjoy seamless indoor-outdoor living with a new slider that leads to your private patio, ideal for morning coffee or evening relaxation. Beyond your doorstep, discover a wealth of amenities including pools, spas, a clubhouse, tennis courts, and workout facilities everything you need for a vibrant lifestyle. Located in close proximity to CSUS, shopping centers, and a variety of dining o
Sunlight pours in through large windows, illuminating the engineered hardwood flooring that graces the entirety of the home. You'll find comfort in the thoughtful additions like ceiling fans, ensuring a pleasant ambiance year-round. Prepare culinary delights in the charming kitchen equipped with stainless steel appliances, formica countertops, and maple cabinets. The spacious primary bedroom beckons with its en-suite bathroom featuring a tub over shower configuration, providing a private oasis for relaxation. Step outside to your expansive . 26 acre backyard, a blank canvas awaiting your personal touch. Whether you envision lush gardens, a play area for children, or a serene retreat for out
Excellent investment opportunity. CASH producing property $60k+ a year!!! 2 bedroom 1 bath ea. Unit. Very clean duplex updated in 2017 with granite kitchen and newer cabinets, new roof, new siding, new heat and air, new hot water heaters and more. All done with permits. Each unit has a One-Car garage, private fenced backyard plus space to park on driveway. Separate utilities. Located on a large corner lot near desirable Curtis Park. Walk a block to trendy restaurants, Gunther's, Pangea, Hop Gardens Taproom, Caf Dantorels Convivences and transportation nearby. EZ access to freeway, parks and downtown.
1/41
$985,000
4 beds10 baths2,100 sq ft3,920 sq ft (lot)
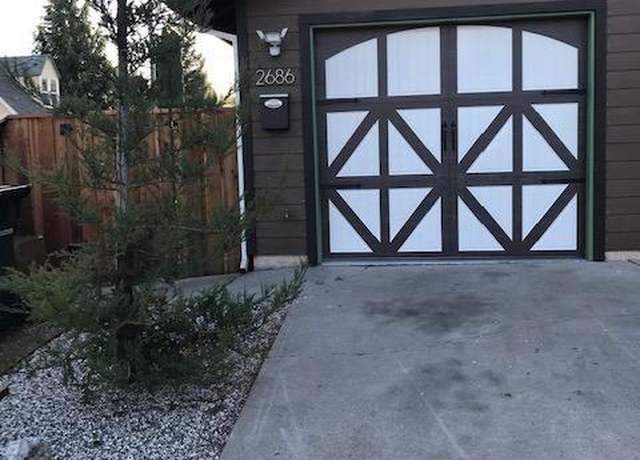
2680 - 2686 Franklin Blvd, Sacramento, CA 95818
Hall & Associates Real Estate, Hall & Associates Real Estate
High in demand, completely remodeled, open floor plan duplex. This is the nicest duplex on the market in Sacramento. Remodeled in 2016 with all new flooring, cabinets, ceiling fans, and much more - tenants have kept it in turn key condition. Long term tenants in place that would like to stay. Close to Hwy 80, shopping, restaurants and public transportation. This is a rare opportunity to own a beautiful investment property (one of a kind).
Location! Location! Location! Nestled in "The Cove". Close to Downtown, the river & easy commuting to the airport for frequent fliers. Better than new with Owned Solar, upgrades & amazing entertainers side yard. No neighbors on left means way more elbow room plus privacy! Neutral color scheme inside is perfect for all tastes. Open main floor, multiple stylish fixtures, & an abundance of natural light through designer window treatments. Gourmet kitchen boasts tons of storage + counterspace - a large island gives you room to spread out & a spot for guests to gather. Room for a dining table by the back slider makes for effortless entertaining inside & out
Amazing Duplex Located in the Highly Sought-After Mansion Flats in Midtown Sacramento! LOCATION, LOCATION!! Nestled in the Heart of Midtown Sacramento, & located in one of the city's Most Coveted Neighborhoods! This Charming Victorian Duplex offers a Unique Opportunity to own a piece of Historic Charm while in a Location which epitomizes the Modern Vibrancy of Urban Living! The Prime Location of this Duplex offers Unparalleled Access to Everything Midtown Has to Offer!! From Restaurants, to Boutique Shops & Cultural Hotspots, to Parks, & all of Your Favorite Clubs & Restaurants, all Located within Short Walking Distance! With its Classic Architecture & Spacious L
Great Home with Recent updates. Newer Roof, HVAC, Interior & Exterior Paint and Doors. Dual Pane Windows except for the Slider to the Backyard. Nice sized Backyard with Apricot tree, Fig tree, Lemon tree, Quincy tree, and 2 Nut trees. Located near Schools & Shopping.
Well maintained and private single story home in a central location. Upgrades include, deck, shed (extra living space), fencing, and landscaping. Get it all at a great value and be close to schools, parks, shopping and freeway access.
Welcome To Your Dream Home! This beautifully renovated 3 bed/2 bath home is Move-In-Ready and conveniently located near Consumes River College, Wood park/Valley Hi Park, light rail stations, Kaiser hospital and easy access to Hwy 99! Nestled in a charming neighborhood, this home is the perfect blend of comfort, style, and outdoor entertainment. It offers A Fabulous Open Layout with soaring ceilings, abundant natural light, spacious living dining room combo, good size bedrooms, large size kitchen with peninsula. This newly remodeled home features fresh smooth finish stucco, brand new laminate flooring, new kitchen cabinets with quartz countertops and stainless steel appliances, fresh inter
20 Minutes to Sacramento. Once in a lifetime opportunity to own one of the largest estates in Sacramento ideal for discerning buyer! 4 acres of private grounds landscaped with beautiful palm trees and a pond offer expansive valley views! This property is truly a playground for all activities, parties or for just your pleasure. A grand swimming pool and a lake within walking distance ideal for entertaining and relaxing. Majestic home boasts 7,500 square feet of luxurious living including expansive marble entry way, game room, two kitchens, mirrored workout room, spiral staircase and two chair salon ideal for a spa day at home, amenities that will not disappoint your guests, Horse lovers this
$4,999,999
8 beds7 baths7,200 sq ft4.00 acres (lot)
10501 - 10501 Birch Ranch Dr, Sacramento, CA 95830
Check out this stunning 3 bedroom 1 bathroom home located in a highly desirable neighborhood. The kitchen is equipped with updated granite countertops, tile backsplash, stainless steel smart appliances and ample cabinets with a cute breakfast bar. Flow into the living room featuring a cozy fireplace, perfect for entertaining your guests. The primary bedroom features a spacious closet and the bathroom features a luxurious Bio-Bidet Bliss 2000. Not to mention the other two bedrooms are also equipped with extra storage space. Lush green landscape surrounds this beautiful home and there is ample space in the backyard for you to create your perfect oasis.
Diamond in the rough! Two parcels being sold together for a total of . 30 lot. 2 Rental units-1 home with 2 bed 1 full bath and 1 garage ADU conversion detached. Ample parking in front makes this an idea location for a rental.
This fully remodeled 3 bedroom, 2 bath oasis is a testament to modern luxury and functionality. Nestled in a sought-after neighborhood, this residence combines timeless charm with contemporary convenience. Step inside to discover a spacious living area adorned with hardwood floors and abundant natural light, creating a warm and inviting atmosphere for gatherings or relaxation. The gourmet kitchen is a chef's delight, featuring Quartz countertops, stainless steel appliances, and ample cabinet space, perfect for culinary adventures. Adjacent to the main room, a versatile home office provides a quiet retreat for productivity or creative pursuits, offering the perfect balance between work and l
Beautiful Updated Home! This home Features New Exterior Piant, New Interior Two Tone Paint, New Roof, some New Fencing, New Luxury Flooring Throughout, New Panel Doors, New Fixtures and More! Kitchen has New Upgraded Cabinets, New Granite Countertops and New Sink & Faucet. Bathrooms have New Vanities, New Lighting and Tile Showers. This Beautiful home is gated and ready for you to make it your home. A Must see!
Duplex opportunity for the investor in search of income producing property at a very reasonable purchase price. This duplex building offers two (two bedroom / two bathroom) units each having approximately 990 Sq. Feet and attached garages with individual yards. Situated on a huge 9,100 sq foot lot allows possibility of addition/expansion and generous backyard space for tenants. California home hacking opportunity. .. live in one unit and rent out the other. Seller has home and pest inspection available for your review. Currently both units are rented. Duplex next door is also available for purchase!
Duplex opportunity for the investor in search of income producing property at a very reasonable purchase price. This duplex building offers two (two bedroom / two bathroom) units each having approximately 990 Sq. Feet and attached garages with individual yards. Situated on a huge 9,100 sq foot lot allows possibility of addition/expansion and generous backyard space for tenants. California home hacking opportunity. .. live in one unit and rent out the other. Seller has home and pest inspection available for your review. Currently both units are rented. Duplex next door is also available for purchase!
Perfect Live-in Investment with 3,300+ sf of total living space, 4 bedrooms upper unit + 3 bedrooms lower unit. Both with spacious living/family areas and a separate dining room. Both units feature open floor plan, kitchen with granite counter, and newer appliances. Washers, Dryers, and Refrigerators for both units, lower unit grand media console electric fireplace, upper unit king bed, glass media stand, 3 dining buffet/wine accent cabinets, & 3 additional marble/stands/cabinets are all included. This property is an example of where the old world charm meets the updated convenience, conveniently located close to everything in the heart and the most desirable location Downtown Sacramen
Beautifully Remodeled Campus Commons Gem! 3 spacious bedrooms, 2 and a half bathrooms, 2 car attached garage and a fabulous private, screened-in patio perfect for entertaining, enjoying a cup of coffee in the morning and relaxing in the evening with a good book. The living area is open and bright with natural light and a brick fireplace for coziness on cool evenings. Smart home features include the Ring video doorbell and The Nest smart thermostat. The Clubhouse is just steps away with a sparkling pool, hot tub & tennis courts. It will feel like vacation everyday. Welcome Home!
Welcome to 4476 Corse Walk, a meticulously crafted home offering a harmonious blend of comfort, style, and convenience in N Natomas. This exceptional property boasts an array of luxurious features and a thoughtful floorplan designed for modern living. Step inside to discover a light-filled living space adorned with luxury vinyl plank flooring, elegant quartz counters, and modern tile backsplash. The gourmet kitchen is a chef's delight, featuring stainless steel appliances, ample cabinet space, and a spacious island perfect for meal preparation and casual dining. This home's versatile floorplan is designed to accommodate every lifestyle need. With a full bedroom and bathroom located on the b
Uncover the potential in this hidden gem nestled in the coveted McKinley Park neighborhood! This is a fantastic opportunity to make your mark with this charming two-bedroom, one-bathroom home featuring a cozy living and dining area and original hardwood floors. Situated in an ideal location just houses away from McKinley Park, this property offers easy access to the best of East Sacramento living, and it's blocks away from restaurants such as Roxie Deli & BBQ and Orphan. Bring your vision and creativity to breathe new life into this property and create your perfect haven.
This charming single-story Plan 1 at brand new community, Riverhaven in the vineyard area is currently under construction and estimated to be complete in October! There is still time to customize the interior design options on this one just to your liking. Located on a nice sized south-facing lot, this energy-efficient all-electric home boasts an open-concept kitchen, dining room, and great room that makes prepping meals and entertaining easy. You'll appreciate the secluded primary bedroom in the back of the home to unwind at the end of the day. Enjoy a DOE Zero Energy Ready Home at Riverhaven! Certified by the U. S. Department of Energy, these high-performance homes are so energy efficient
Welcome to this charming gem in the heart of south Natomas, minutes from downtown Sacramento! Nestled on a quiet cul-de-sac, this beautifully remodeled 2-bedroom, 1.5-bath condo is a true delight. These are the features that make this property a must-see: Comfortability from the moment you arrive. Step inside and be greeted by a functional layout that blends style and functionality. The tasteful upgrades are evident throughout. The heart of this condo is the thoughtfully updated kitchen. Imagine preparing meals on gleaming granite countertops, surrounded by stainless steel appliances that elevate your cooking experience. This kitchen will inspire your inner foodie. Both bedrooms offer a p
Welcome to 8359 Brooklyn Road. This beautiful home has a spacious 4-bedroom, 3-bathroom layout, exuding comfort and style from the moment you step inside. The open-concept floorplan seamlessly connects the living, dining, and kitchen areas, creating an inviting space for both everyday living and entertaining guests. The chef-inspired kitchen is a culinary delight, featuring sleek granite countertops, stainless steel appliances, ample cabinet space, and a convenient center island perfect for meal prep. Adjacent to the kitchen, the sunlit dining area offers the ideal setting for enjoying delicious meals with loved ones. Retreat to the luxurious primary suite, complete with a large walk-in clo
DOUBLE WIDE MOBILE HOME IN CAPITAL ESTATES - ALL AGED GATED COMMUNITY. .. THIS HOME HAS BEEN WELL MAINTAINED WITH LOTS OF LITTLE EXTRAS. 2-BEDROOM, 2-BATH, LARGE LIVINGROOM, FORMAL DINING AREA WITH BUILT IN HUTCH. RECENT UPGRADES INCLUDE NEW DECKING AND STAIRS, NEWER DUAL PANE WINDOWS, NEW PAINT THROUGHOUT THE HOME, REMODELED GUEST BATHROOM, ROOF WAS RECENTLY RECOATED. KITCHEN W/ LOTS OF CABINETS AND COUNTERSPACE, GAS COOKTOP. INCLUDES REFRIGERATOR, WASHER & DRYER AND MICROWAVE. ENJOY THE OUTDOORS ON THE LARGE SIDE PORCH WITH PRIVACY OR ENJOY THE BACKYARD SPACE. CLUBHOUSE W/ POOL, SPA, EXERCISE ROOM, SAUNA ROOM, GAME ROOM, BBQ PITS, DOG PARK, AND SO MUCH MORE. COME CHECK IT OUT BEFORE
Charming two bedroom, one bathroom home on tree lined street in Land Park. This home exudes character and warmth, offering a perfect blend of it's original elegance and modern comfort! An overflow of natural light pours into this home, featuring hardwood floors and custom tile work that adds a touch of Mediterranean flair. Pool sized back yard with large deck and detached garage, possibilities to add on, convert or more! Fully landscaped with raised garden beds and fruit trees. Don't miss the opportunity to make this enchanting residence your own and experience the best of Sacramento living!
$730,000
2 beds1 bath1,158 sq ft7,405 sq ft (lot)
885 Robertson Way, Sacramento, CA 95818
eXp Realty of California, Inc., eXp Realty of California, Inc.
Take a look at this 3 bedroom 2 bath Mobile home manufactured in 2007. This mobile home is in GREAT condition and is ready for new owners! There is enough yard space for pets along with a covered patio for shade in the summer!
Explore the perfect blend of luxury and comfort with this stunning home in the Pocket/Greenhaven area, showcasing a move-in ready open floor plan, a spacious lot with RV access and a pool, and exquisite upgrades. Act Swiftly to Secure this Once-in-a-Lifetime Chance!
Brand new QUICK MOVE-IN home offered by renowned builder, Signature Homes, located in the robust Sacramento community of Catalina at Delta Shores. Complete with options and upgrades valued over $25k, this home offers open stair railing, LVP flooring, ceiling fan/light prewire in all bedrooms, and quartz kitchen countertops. The gourmet kitchen also includes stainless steel appliances, Sienna-stained cabinets with shaker doors, large kitchen island, and a walk-in pantry for everyone’s favorites. The Great Room and loft provide generous space to entertain or enjoy well-earned relaxation. Allow yourself the luxury of a secluded primary suite with a separate tub and shower, dual E-Stone v
Brand new home offered by award-winning builder, Signature Homes. Located in the family-friendly community of Catalina at Delta Shores, this neighborhood offers easy access to I-5 and Highway 99 and is located across the street from the Delta Shores shopping center with a multitude of retail and dining options. This home offers open plan living with a generous Great Room perfect for entertaining and a loft that provides extra space for studying or enjoying your favorite movie. Enjoy a gourmet kitchen with stainless steel appliances, shaker-style beech cabinetry, and a large kitchen island that seamlessly blends your dining and entertainment space. The luxurious primary suite offers a separa
Meticulously maintained piece of history nestled in the desirable Curtis Park neighborhood. The timeless charm with original glass adorning most windows, lovingly preserved casement windows with new sashes and coved high ceilings. Discover refinished original heart of oak floors, seamlessly blending with new oak flooring in kitchen. Owned by a contractor, this home has been thoughtfully updated with period-appropriate touches. Granite counters, all-American kitchen finishes, high-end appliances grace the kitchen, farmhouse sink, pantry, built-in office, custom real wood cabinetry, custom maple block appliance shelf and tankless water heater. Relax in the original claw foot tub, surrounded b
This home has undergone a complete transformation with upgrades galore! A new HVAC system ensures comfort year-round, while the fully remodeled kitchen boasts new appliances and a fresh look. Both bathrooms have been fully renovated, and new vinyl plank flooring has been installed throughout. The large primary features a spacious walk-in bathroom and closet for your oasis. Additionally, new baseboards, doors, and trim have been installed. All lighting has been upgraded to energy-efficient LED fixtures. Step outside onto the covered back porch and enjoy the expansive backyard, perfect for outdoor entertaining. The interior and exterior have been freshly painted, landscaping has been tidied u
This charming renovated home offers an open living and kitchen space with new appliances. Two newly remodeled bathrooms. Master bedroom and second bedroom have fresh carpet. Enjoy your cozy fireplace and 3 minisplits. Inside stackable laundry hookup. Nicely landscaped front yard with an apple tree. Step out to your private backyard with detached garage. Don't miss out on this opportunity to make this home your own.
Beautiful U. S. Homes Roosevelt model on . 19ac. lot. Fabulous park like rear yard landscaping w/ multiple stamped concrete patios, waterfall, firepit and custom Durawood trellis patio cover. Lots of trees & greenery & raised planter areas. Inside tastefully decorated interior w/ plantation shutters, wood flooring in living areas and bedrooms, upgraded tile flooring in hallways, bathrooms and laundry room. multiple ceiling fans and dual zone HVAC. Recently updated kitchen, with breakfast bar island, breakfast nook, pantry, quartz counters, raised panel painted cabinetry, updated pendant lighting, brushed brass hardware, stainless appliances including 5 burner gas cooktop, double
Welcome to your new home! Don't miss out on this wonderful opportunity to own a delightful 2-bedroom, 1-bathroom bungalow perfectly situated for both convenience and comfort. Nestled close to shopping centers, freeway access, and within a short stroll to Sacramento State University, this location offers the best of both worlds. Step inside to discover a spacious floor plan designed to cater to your lifestyle needs. The heart of this home boasts a generously sized kitchen, complete with ample counter space and storage, making meal prep and entertaining a breeze. Adjacent, you'll find a convenient inside laundry area, adding to the home's practicality. The open living room is bathed in natura
Step into your own personal masterpiece! This stunning 3-bedroom, 1.5-bathroom townhouse is a true work of art that simply must be experienced in person. Every corner of this home exudes charm and sophistication, offering a tranquil oasis from the hustle and bustle of the outside world. With large, sun-drenched Anderson windows framed in elegant solid wood, natural light floods every room, creating an inviting atmosphere throughout. Updated cabinets, custom walnut countertops, a stylish backsplash, and top-of-the-line stainless steel appliances in the kitchen. No detail has been overlooked, with even the bathrooms showcasing custom tile and meticulously painted and coated doors. And with al
Opportunity abounds with this charming 2-bedroom, 1-bathroom cottage, perfectly poised for a first-time homebuyer or savvy investor seeking a prime location. Nestled within walking distance to Sac State University, as well as shopping destinations and freeway access, convenience is at your doorstep, with downtown just minutes away. Step inside to discover the updated kitchen, boasting modern amenities that enhance both style and functionality, while the upgraded bathroom adds a touch of luxury to everyday living. Laminate flooring throughout lends a sense of warmth and durability, while the expansive lot offers endless possibilities for outdoor enjoyment and expansion. Outside, the 1 car ga
This area's enrollment policy is not based solely on geography. Please check the school district website for more information.
Elementary schools
Middle schools
High schools
GreatSchools Summary Rating
10/10
Phoebe A. Hearst Elementary School
Public, K-6 • Choice school
9/10
Crocker/riverside Elementary School
Public, K-6
8/10
Sutterville Elementary School
Public, K-6
8/10
Caleb Greenwood Elementary School
Public, K-6
8/10
William Land Elementary School
Public, K-6
Only showing 5 of
100+ elementary schools.
School data is provided by GreatSchools, a nonprofit organization. Redfin recommends buyers and renters use GreatSchools information and ratings as a first step, and conduct their own investigation to determine their desired schools or school districts, including by contacting and visiting the schools themselves.Redfin does not endorse or guarantee this information. School service boundaries are intended to be used as a reference only; they may change and are not guaranteed to be accurate. To verify school enrollment eligibility, contact the school district directly.
Homes for sale in Sacramento have a median listing price of $500K. Some of these homes are Hot Homes, meaning they're likely to sell quickly.
What are some of the most popular neighborhoods in Sacramento?
Popular neighborhoods include Natomas Park, Curtis Park, East Sacramento, South Land Park, Midtown, Pocket, South Natomas, Tahoe Park, Greenhaven, and Land Park.
Sacramento, California boasts a robust transportation network with a variety of options for commuting. The city experiences moderate to high levels of traffic, especially during peak hours, making car travel somewhat time-consuming. Public transportation is readily available, with services such as buses and light rail provided by the Sacramento Regional Transit District. Additionally, Sacramento is well-connected to other regions via several major highways and freeways, including Interstates 5 and 80. Learn more on our Sacramento city guide.
What types of properties are available in Sacramento?
Sacramento, California offers a variety of single-family home types, including ranch-style, contemporary, and modern designs, with options ranging from one to five bedrooms and varying year built. These homes can be found throughout the city, including neighborhoods such as Midtown, Land Park, and East Sacramento. To explore different property types for sale in Sacramento, California, use the 'Home type' filter located above the active listings. Customize your search by selecting options like single-family homes, condos, townhomes, and more.
What is life like in Sacramento?
Living in Sacramento, California offers a unique blend of urban and natural environments. The landscape features a mix of rivers, parks, and tree-lined streets, creating a picturesque setting. The weather in Sacramento is characterized by hot summers and mild winters, providing residents with a diverse climate. The city offers a variety of job opportunities across industries such as technology, healthcare, and government, fostering a dynamic economy. With a range of cultural events, festivals, and recreational activities, Sacramento provides residents with a vibrant and engaging lifestyle.
What are the schools and amenities like in Sacramento?
Sacramento, California is a vibrant city offering a wide range of public amenities to its residents. The city boasts a multitude of restaurants, offering diverse culinary experiences, from local to international cuisines. For those who enjoy outdoor leisure, numerous parks are scattered throughout the city, providing serene spaces for relaxation and recreation. Grocery stores are conveniently located across Sacramento, ensuring easy access to daily necessities. Additionally, the city is home to various other amenities such as fitness centers, libraries, and shopping centers, catering to the diverse needs and interests of its residents.
In the past month, 288 homes have been sold in Sacramento. In addition to houses in Sacramento, there were also 76 condos, 22 townhouses, and 77 multi-family units for sale in Sacramento last month. Sacramento is a minimally walkable city in Sacramento County with a Walk Score of 49. Sacramento is home to approximately 466,259 people and 304,773 jobs. Find your dream home in Sacramento using the tools above. Use filters to narrow your search by price, square feet, beds, and baths to find homes that fit your criteria. Our top-rated real estate agents in Sacramento are local experts and are ready to answer your questions about properties, neighborhoods, schools, and the newest listings for sale in Sacramento. Our Sacramento real estate stats and trends will give you more information about home buying and selling trends in Sacramento. If you're looking to sell your home in the Sacramento area, our listing agents can help you get the best price. Redfin is redefining real estate and the home buying process in Sacramento with industry-leading technology, full-service agents, and lower fees that provide a better value for Redfin buyers and sellers.


 REDFIN IS COMMITTED TO AND ABIDES BY THE FAIR HOUSING ACT AND EQUAL OPPORTUNITY ACT. READ REDFIN'S FAIR HOUSING POLICY AND THE NEW YORK STATE FAIR HOUSING NOTICE.
 United States
 Canada