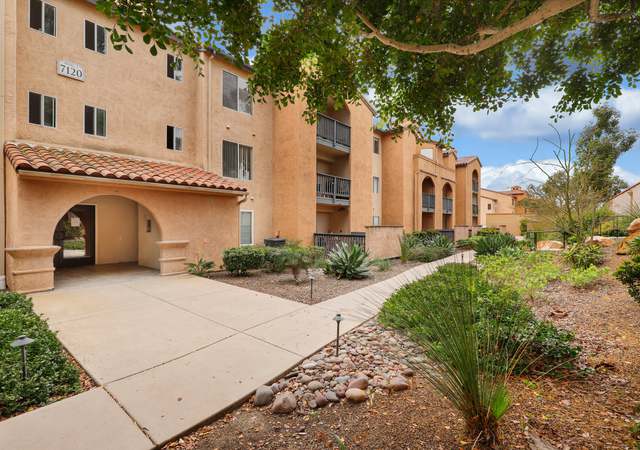
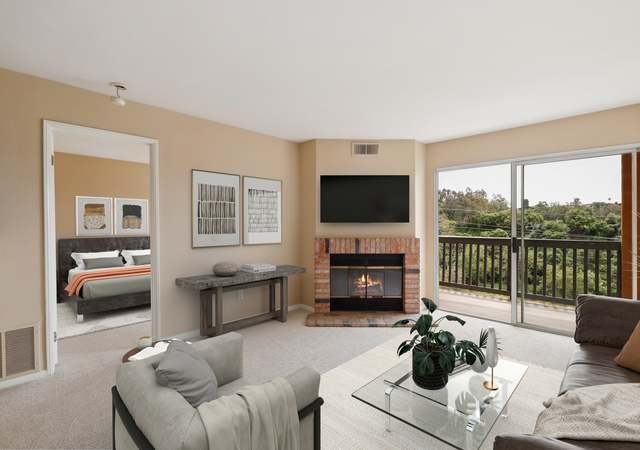
Welcome to the exclusive Lucera gated community! This south-facing unit offers unparalleled privacy, backing onto a serene canyon with no rear neighbors. Step inside to discover an inviting open floor plan, highlighted by a living room balcony boasting breathtaking treetop views of the canyon and a cozy fireplace to unwind by. The kitchen features sleek cabinetry some adorned with glass paneled doors, granite counters, and stainless steel appliances. Stay comfortable year-round with the brand new central AC and heat. Two primary suites on opposite sides of the living room ensure privacy, with one featuring a step-in shower. Convenience meets efficiency with in-unit laundry including a stack
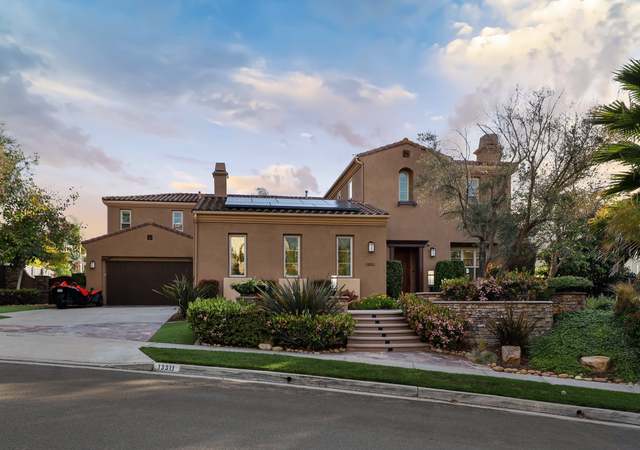
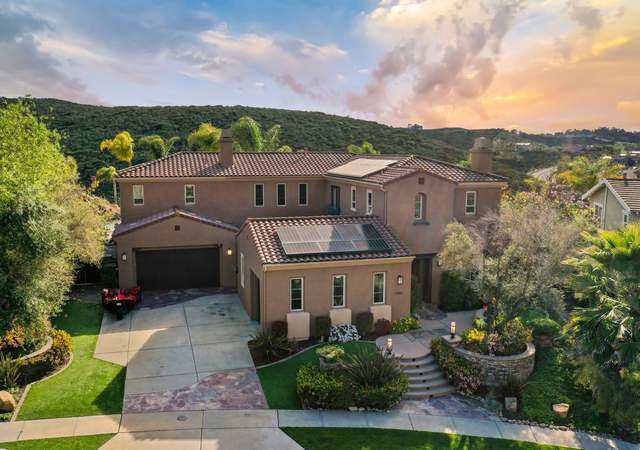
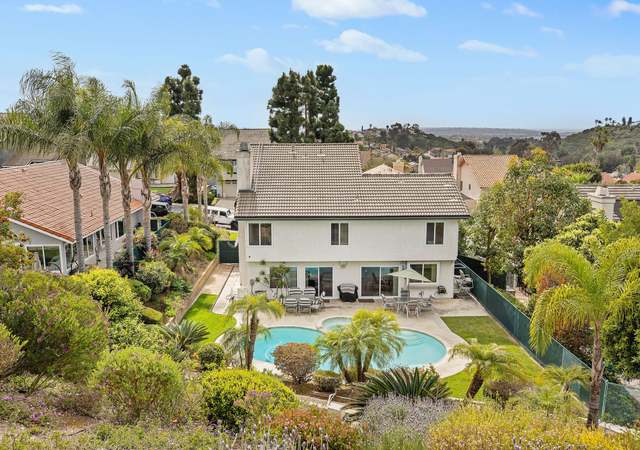
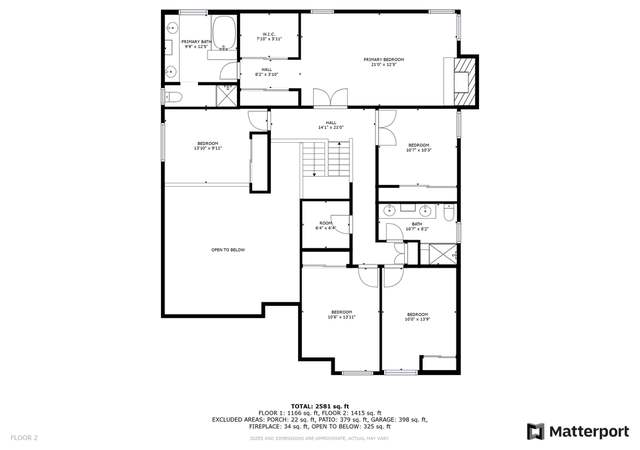
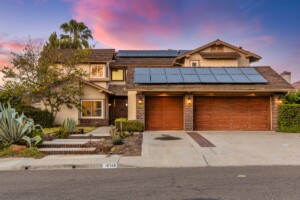
Welcome to the epitome of luxury living, just a mile from the entrance to the highly coveted Stonebridge Estates of Scripps Ranch. This remarkable residence sits on nearly half an acre, with west facing sunset views. Enjoy the spacious floor plan, featuring 5 bedrooms (one bedroom with ensuite bath downstair), separate office, and loft. Experience seamless indoor/outdoor living as Fleetwood doors invite you to explore the resort-style backyard oasis; featuring a huge pool with waterfall and slide, a putting green, fireplace, and built-in BBQ. This house is an entertainer's dream! Step into the heart of culinary excellence within the chef's kitchen, adorned with top-of-the-line stainless ste
Prepare to be impressed with this stunning single-story townhome located in a premium location with park-like views in the highly sought-after Westwood Townhomes community of Rancho Bernardo! Recently added all new: designer finishes throughout including gorgeous hand-scraped bamboo hardwood flooring, white shaker kitchen cabinetry with soft close drawers, quartz countertops, stainless steel appliances, interior paint, bathroom vanities, fixtures fans and lights. Indoor outdoor living, entertain, relax or dine al fresco on the fully fenced private and quiet patio. Additional features include a grand primary bedroom with walk-in closet, separate laundry room by the kitchen, and an attached 1
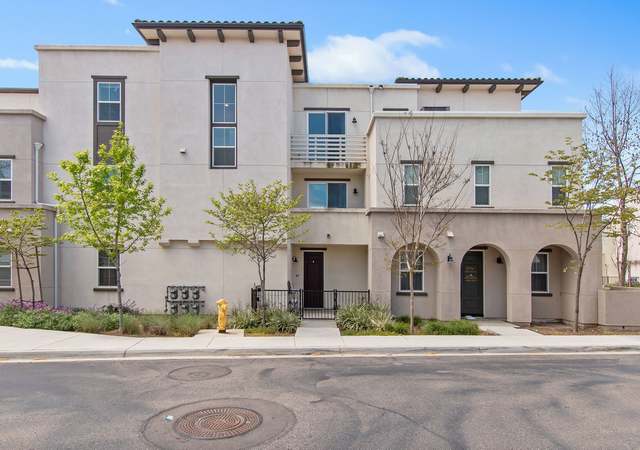
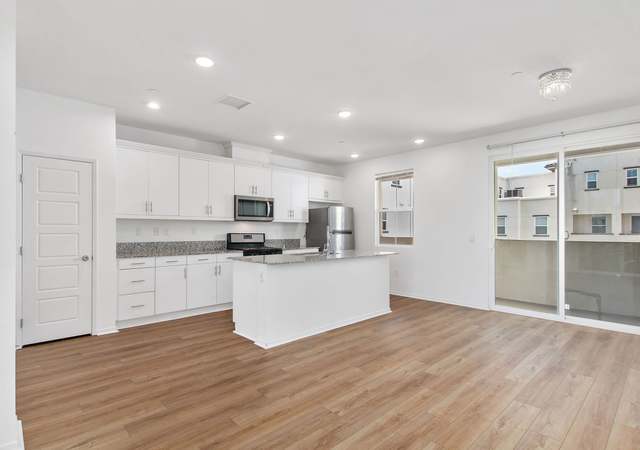
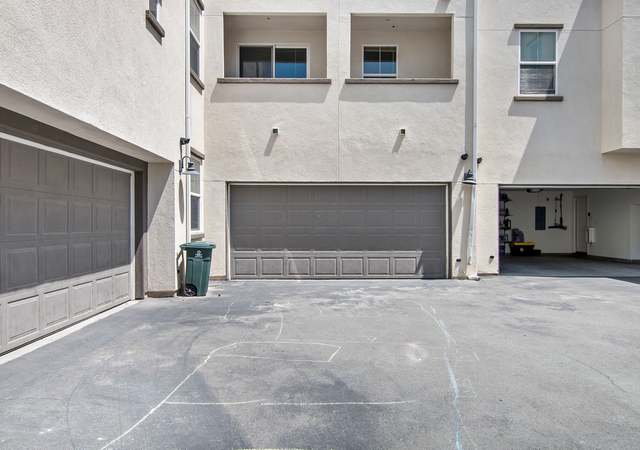
Welcome to this stylish tri-level townhome nestled within the gated community of Playa del Sol, built in 2017. Boasting modern amenities and convenience, this residence offers a seamless blend of comfort and functionality. This move-in-ready home has been freshly painted with new LVP flooring and new carpet. Enjoy the convenience of an attached 2-car garage and a bedroom and bathroom on each of the first two floors, with the remaining bedrooms located upstairs. Retreat to the spacious primary suite featuring a balcony, walk-in closet, and en-suite bathroom. There is an additional junior suite located on this floor as well. The kitchen is a chef's delight, featuring granite countertops, rece
Welcome to this impeccably maintained home nestled in the highly desirable neighborhood of Rancho Peñasquitos. Boasting new windows and sliding doors, this residence exudes both charm and functionality. Step into the backyard oasis where a sparkling pool awaits, complete with a new pump and solar heating for year-round enjoyment. Inside, the seller's meticulous care is evident, with an updated kitchen featuring granite countertops, recessed lighting, and crisp white cabinetry. Updated bathrooms featuring granite countertops, white cabinets, new sinks, fixtures, and toilets. With a new heating and cooling system complemented by updated air ducts, comfort and efficiency are assured. Wa
Welcome to your dream home in the wonderful Casablanca community of Rancho Penasquitos! This updated ground floor unit offers the perfect blend of convenience and luxury, featuring a remodeled kitchen and a cozy fireplace in the inviting living room. Say goodbye to laundromat visits with in-unit laundry facilities, and enjoy your morning coffee or unwind on your private patio. The primary bedroom features dual vanities for added comfort and a separate private patio, perfect for quiet moments of relaxation. Located in an area renowned for its excellent schools, this residence offers not just a home, but a lifestyle tailored to families seeking quality education and a thriving community. Don'
Discover a haven of modern comfort and design in the heart of University City with this exquisitely remodeled single-level home nestled on a quiet cul-de-sac. Mere blocks from San Clemente Canyon providing you with miles of trails to explore. Bathed in natural light, its open floor plan sets the stage for effortless entertaining and everyday living. Enter into a culinary dream with a reimagined kitchen boasting white shaker cabinets, stunning quartz countertops, and top-of-the-line stainless steel appliances. And with less than 6-month-old smart Wi-Fi connected appliances throughout—including the fridge, gas stove/oven, dishwasher, clothes washer, and dryer—efficiency and conven
Welcome to your new home in Mission Village! This charming condo features an open living area that invites relaxation and entertainment. The kitchen, complete with butcher block countertops, seamlessly flows into the living space, making meal prep a breeze while enjoying company. Sliding glass doors lead to your private balcony, perfect for enjoying morning coffee or evening sunsets. Ample closet space provides practical storage solutions, ensuring clutter-free living. Additional upgrades include a brand new heater and fresh paint Priced to sell, this condo presents a fantastic opportunity to add your own flair and create a personalized oasis. Community amenities abound with a sparkling po
Welcome to your dream home! This stunning property embodies the essence of modern living with a touch of elegance. As you enter, you'll be greeted by the warmth of wood floors and natural light flooding through dual-paned windows. The heart of the house is the upgraded kitchen, boasting brand new quartz countertops accented by handmade Moroccan Zellige tile. A massive island serves as the focal point, perfect for both culinary creations and casual dining. Stainless steel appliances ensure both style and functionality. The kitchen opens graciously to the living room, creating an inviting space for gatherings and entertainment. Enjoy the luxury of ample space in the oversized primary suite, a
Perched on the 37th floor of San Diego's illustrious Electra tower, unit 3702 offers an unparalleled blend of luxury, comfort, and breathtaking views. As you step inside, you're greeted by a seamless fusion of modern elegance and timeless charm. The spacious layout encompasses a master bedroom plus an optional room, perfect for a study or guest quarters. Hardwood flooring spans the living spaces, complemented by sumptuous granite countertops with a full backsplash in the kitchen. Top-of-the-line appliances make culinary endeavors a delight, whether you're hosting grand gatherings or enjoying quiet evenings for two. Neutral color tones throughout the residence create a tranquil ambiance, all
Rarely available END UNIT townhome with OVERSIZED - 3 CAR GARAGE! This beautiful townhome is located in a quiet residential neighborhood. The unit location is at the back of the complex away from traffic. This 3 story unit has been beautifully updated throughout with new carpeting, new paint, refinished kitchen counters and updated bathrooms. The kitchen features a sit-and-eat bar area. The unit has a wood deck which extends the living area. The master bedroom faces east. Garage with interior access and space for 3 cars or 2 cars and storage. Washer and dryer are included. The complex features a common area that is great for entertaining with patio tables/chairs and a calming fountain. This
Welcome to upgraded condo in the Harbor Vista Complex. Newly remodeled interior featuring custom paint, luxury laminate flooring and recessed lighting throughout, creating inviting atmosphere. All new upgraded kitchen features stainless steel appliances, new custom cabinets and quart counter tops. The newly upgraded vanity and lighting in the bathroom add a touch of luxury and sophistication to the space. Additionally, the convenience of a stackable washer and dryer in a closet adds modern practicality to the home. Natural light floods the interior, creating a bright and airy ambiance throughout. The oversized bedroom offers a tranquil retreat with large closet space. This condo is located
Presenting a Magnificent Luxury Estate located in the Guard Gated community, The Crosby Club at Rancho Santa Fe. This stunning Single Level, Five Bedroom, Five & One-Half Bath, Spanish Style Custom Residence was designed by Mark Radford and spans 8295 Sq Feet, set on approx 1.1 Acres of professionally landscaped grounds with an Infinity Edge Pool & Spa. Located at the end of a cul-de-sac, there is a semi circular driveway with a castle-like turret Entrance through wrought iron doors, entering a Spanish Courtyard. The Courtyard is a quintessential Architectural feature of the home outlined with the terracotta roof and creates a tranquil welcoming. It serves as a Central Open Comm
Masterful custom contemporary home steps to the Pacific Ocean at Little Point, in the renown Beach-Barber Tract of La Jolla, CA. Walls of glass with stainless steel accents, poured in place concrete walls, french oak floors, soaring ceilings and water views provide drama and sanctuary. Individual terraces off the bedrooms offer private living spaces, while the common areas open to patios, outdoor living, spa, fire-pit, outdoor shower and BBQ area for fun and entertainment. Remodeled and updated in 2019 the home includes solar, whole house water filtration, remote access security system, custom window coverings and interior and exterior lighting. Property adjacent at 321 Fern Glen also for s
Spanish, modern bungalow steps to the Pacific Ocean in the Beach Barber Tract in La Jolla, CA. The 1927 built home was completely remodeled and reimagined in 2017, and lives like a new build, while retaining the original fireplace, stairs and wrought iron railings. The 3 bedroom / 2 bath home sits on a large lot and hosts 3 outdoor patios, an outdoor kitchen, outdoor shower, separate garage, and large flat grass lawn. Light, airy, bright and breezy - the classic Southern California bungalow. Property adjacent at 305 Fern Glen also for sale - rare opportunity to own two side-by-side properties in the Beach Barber Tract, steps to the Pacific Ocean, Little Point and famed Wind 'n Sea.
BEAUTIFULLY REMODELED 5 BREDOOM 2 BATH HOME. NEW KITCHEN, NEW BATHROOMS, NEW FLOORING, NEW APPLIANCES, NEW EXTERIOR PAINT, NEW INTERIOR PAINT, NEW PLUMBING, NEW GARAGE DOOR, NEW BALCONY DECK INSTALLED ON THE 2ND FLOOR WITH FRENCH DOORS, NEW DUAL PANE WINDOWS TO BE INSTALLED IN THE NEXT 4 DAYS, CORNER LOT WITH PLENTY OF ROOM FOR AN ADU AND RV CONNECTIONS ALREADY INSTALLED. NEW UPDATED PICTURES COMING SOON.
Tastefully renovated, mid-century home plus rental space in desirable College West. 1,680 sqft, 2-car garage. Comes with City-approved plans for an additional full bath and feasibility study to convert the garage to an ADU for additional income. High-end updates with original hardwood floors & built-ins help to maintain the home’s original mid-century character while letting you enjoy the conveniences of modern living. Upgrades include 200 amp electrical panel, new a/c, furnace, new windows & Tesla solar panels which all add to the home’s energy efficiency. The home is set high above the street for additional solitude and features 3 large bedrooms, a spa-like bathroo
Desirable North Pacific Beach condo located in a charming 16-unit complex. With some creativity and vision, this home has the potential to be transformed into a personalized haven. This spacious unit boasts a large kitchen, bright living spaces with ample natural light from sunrise to sunset, and a prime poolside location. Enjoy a good-sized balcony overlooking a tropical garden and the pool. The complex offers convenient amenities including a bike room, laundry facilities, and one off-street parking spot in the carport. Desirable North Pacific Beach condo located in a charming 16-unit complex. Located in the far back of the property, this is the jewel in terms of unit location… morn
Welcome home to your lovingly and well cared for retreat. Located in The Mesa Del Sol neighborhood of Mira Mesa, this home is at the end of a cul-de-sac with a 15,000 square foot lot that creates a peaceful atmosphere. You can relax in your own private hot tub room or listen to the birds while sipping on your favorite drink. This generous sized lot also gives you the space and privacy you need as well. Oh and don't worry about walking up and down the stairs, this beautiful home is ONE story! You are also close to all that Mira Mesa has to offer, shops, restaurants, the post office and more. The curb appeal is second to none as you pull up to the sight of a striking Palm Tree and luscious gr
Charming home in the heart of City Heights! This renovated home features a fresh, modern feel with a beautifully updated kitchen and bathroom, new stainless steel appliances, LVP flooring, and quartz countertops. The cozy and flexible layout offers versatility, allowing you to use the additional space as an optional bedroom or home office to suit your needs. Conveniently located near shopping, restaurants, and quick and easy freeway access.
Looking to invest or live in a move-in ready home and have help pay the mortgage? This is the perfect triplex for you! It consists of a 2 Bed/1Bath unit, attached Studio unit, and detached 1 Bed/1bath unit. Centrally located near freeways, schools, shopping and downtown. Every unit has vinyl flooring, quartz countertops, shaker cabinets, mini splits, ceiling fans, recessed lighting, dusk to dawn exterior lighting, washer/dryer in each unit, and so much more, including alley access. .. Great personal or investment opportunity!
Welcome to Del Sur! Your highly upgraded home awaits you. Includes travertine flooring, plantation shutters, arched doorways, 2 grand fireplaces, gourmet kitchen with granite counter tops, full bed down, 2 level AC, and OWNED SOLAR! Enjoy the yard with fruit trees and drip irrigation. This home is perfect for family gatherings and entertaining with a surround sound system. Del Sur awaits you with top rated schools, pools, playgrounds, shopping centers and restaurants all within walking distance. See sup Walk into this home feeling welcomed by a Del Sur room with a fireplace, a perfect space for connecting with your guests. This extra large spacious kitchen has plenty of preparing and servi
Discover the allure of Triana at Scripps Ranch Villages. As you climb the stairs, natural light fills the open living room and kitchen, featuring a convenient breakfast bar adjoining the dining area. With bedrooms on separate levels for added privacy and no neighbors above or below, this two-level residence offers tranquility. Step onto the balcony from both the living room and master bedroom, extending your living space outdoors. Enjoy the convenience of an attached one-car garage and storage, along with an additional assigned parking space. The community boasts two pool and spa areas for relaxation, all with a low HOA fee. Conveniently located within walking distance of schools, shopping,
$769,999
2 beds2 baths974 sq ft
11892 Scripps Creek Dr Unit A, San Diego, CA 92131
Spacious corner unit condo in the beautiful community of Village Square. This unit offers a combined dining and living space combo that opens into the balcony. New countertops in kitchen and bathroom and updated flooring. Conveniently located near restaurants, market and department stores. The property has a front and a back entrance from your parking area. The community offers 2 pools, spa, barbeque area and a recreation room. This is a must see.
Welcome to Lucent II, where you will find one of the few homes available in Civita that offers single-level living. Lucent II was built by Shea Homes in 2017. Situated on the southwest corner of the building, this home boasts great views of Mission Valley. From the moment you walk in, you are greeted by sophisticated upgrades including lighting, quartz countertops, high ceilings, oversized windows, and an abundance of natural light. Step into the primary bedroom, where you will find a spacious room, a walk-in closet with barn doors, designer mirrors, and jack and jill vanities. The second or third bedrooms are perfect for a guest room, office, or art studio. Don’t miss your opportunit
Escape to your Private Oasis—a Secluded 1.39AC Estate nestled amidst it's own vineyard that produces 2- 250 bottles a year. Expansive grounds offer unparalleled Privacy and Luxury. This magnificent home boast impeccable design, and the serene ambiance of peaceful living. With its expansive grounds this property offers ultimate privacy and tranquility. Take a dip or soak in your custom pool/spa and let your worries melt away. The meticulously crafted home features an Updated Kitchen and Bathrooms. Exquisite architectural details include a mid-century inspired pass through fireplace, spacious living areas, and state-of-the-art amenities such as whole house solar w/ home battery and car
Experience the epitome of everyday elegance with this remarkable home, where every detail has been thoughtfully curated. The living space boasts a cozy fireplace, certain to keep you warm during the cold months and provide ambiance year-round. The tasteful design is emphasized by a neutral color paint scheme, giving you the freedom to add your personality to the space. The heart of the home; the kitchen, is equipped with a centerpiece island, providing ample area for meal preparation or casual dining. Step into your tranquil haven in the primary bedroom, complete with a generously sized walk-in closet. The luxurious primary bathroom features double sinks, a separate tub, and a shower &mdash
Prepare to be swept off your feet by the epitome of luxury living. This magnificent two-story masterpiece with an attached casita, in Pacific Highlands Ranch's coveted Sendero Collection, is a work of art that seamlessly blends contemporary elegance with uncompromising comfort. From the moment you step through the grand entryway, you'll be captivated by the soaring ceilings, natural light pouring in through oversized windows, and a breathtaking open floor plan that invites you to indulge in the finer things in life. At the heart of this architectural marvel lies the awe-inspiring chef's kitchen, a culinary enthusiast's dream come true. Meticulously designed with two custom islands, marble c
GREAT OPPORTUNITY in Kensington Park Villas overlooking ponds, streams, and trees in the beautiful, quiet, Upper Ponds area, this "F" model is the larges size home as originally built in Kensington Park and is the only model with a separate Formal Dining Room. The park view living room has high Cathedral Ceilings and double pane windows looking out to beautiful backyard. Two balcony decks. Large Primary bedroom with two closets and balcony. Kensington Park Villas is a quiet gated community on a 35 acre resort like setting featuring lush landscaping, Koi Pond, and meandering creek. Two pools and spas, walking paths, and private gate into Kensington Village to enjoy trendy restauran
Welcome to your 2 bed/2.5 bath dream home in the heart of Mission Hills! This 2 story townhome is nestled in a gated, quiet community with only 6 units, offering privacy and tranquility. Step inside and be captivated by the stunning remodel. The luxe vinyl plank floors, high ceilings and cozy fireplace create a warm inviting atmosphere. The kitchen boasts quartzite countertops, LED lighting and spacious dining area. The ultimate convenience of having your own private, attached 2 car garage with built in cabinetry is priceless and rare! Location is everything, and this townhome as it all including LOW HOA!! Explore the vibrant neighborhood and discover fantastic restaurants, coffee shops, an
Beautifully remodeled single level 3 bed, 2 bath home with an open concept floor plan. The living room features a brick wood burning fireplace. The remodeled kitchen features white shaker cabinetry with quartz countertops, stainless steel appliances, gas range, pantry, & ample storage. The primary suite features a remodeled ensuite. The front yard & backyard are beautifully landscaped. The fully fenced large backyard features a concrete patio with covered pergola, grass yard, shed, & mature trees. Upgrades include remodeled bathrooms, new interior paint, recessed lights, laminate flooring, plantation shutters, dual pane vinyl windows & doors, ceiling fans, tankless wat
Welcome to the epitome of new North Park living! Nestled just moments from the newly remodeled iconic Lafayette Hotel, this immaculate 2nd-floor condo boasts two bedrooms, one bath, an in-unit washer & dryer, and a designated parking spot. Experience peace of mind with secure building access. Your ideal urban retreat awaits!
Fantastic location! Very desirable complex. Only a mile or two to Ocean Beach! The balcony is west-facing, so you can enjoy the beautiful San Diego sunsets, views of the Famosa Slough/Open Preserve, and also cool coastal breezes. Watch SeaWorld fireworks in the evenings from the front. This SINGLE LEVEL spacious condo features 2 large bedrooms and 2 full baths separated by a long hallway (ideal for a roommate situation. ) There is also additional space for desks/workstations. The complex is equipped with an elevator for easy access to your unit. It is also gated with security entry and plenty of covered guest parking. There are 2 assigned underground gated parking spaces for your conveni
Professional Photos coming this weekend. Bay Ho is one of San Diego's most desired neighborhoods. Centrally located to all that SD has to offer, easy access to freeways, shopping, fine dining, Downtown, and the Airport makes this pocket of San Diego a gem. Welcome to this beautifully RENOVATED single story, 4bed 2bath home. As you walk into the spacious open floor plan, you are greeted with a light & bright kitchen with modern designer finishes, all new stainless steel appliances, quartz countertops. all new high-end scratch resistant vinyl flooring throughout, the bathrooms have been upgraded with custom vanities. Spacious master ensuite with walk-in closet! New sliders, new dual pa
Charming end unit Bay Ho condo in Bay View Terrace! This unit has the best location in the community with assigned parking just steps from the front door and rare in-unit laundry with a space-saving combined washer/dryer. The large Primary Bedroom features tranquil views of the mature trees and peek-a-boo bay views, abundant closet space, and an en-suite bath. Additional features include designer LVP flooring throughout and granite counters in the kitchen. Fantastic location offers convenient access to beaches, downtown, and the best of San Diego living.
Welcome to the Westend of University City! Make this Spectacular remodel your next Dream Home! Home features: 4 bedrooms 2 bathrooms open concept with plenty of storage. New Kitchen, New bathrooms, New windows doors and lighting! Private front patio is perfect for coffee. Back patio is ready for entertaining! Low maintenance yard makes this a perfect home to enjoy!
Nestled amidst 5.01 acres of scenic beauty, this 2020 custom build features 5 bedrooms & 5 bathrooms. Boasting a brand new infinity pool with a swim-up bar, spa, gas fire pit, BBQ and spa lounge including a barrel sauna. This estate pairs modern luxury and rural tranquility with a beautiful unobstructed view. A dream come true for equestrian enthusiasts, this property provides an abundance of buildable land perfect for creating an equestrian haven or entertainers paradise. The ADU offers a cozy 336 SF with potential to expand and customize the space to a home office, media room or additional living quarters. This studio includes an attached half bath. The home has access to a private
Step into the elegance of this 4-bedroom, 2.5-bath, end-unit townhome with attached 2 car garage in the highly desirable Birdland neighborhood of Serra Mesa! Recently renovated with a designer's attention to detail, this residence offers contemporary living at its finest. The remodel includes updated kitchen and bathrooms with new interior paint, new vinyl plank flooring, lighting, baseboard and so much more! The kitchen has been tastefully updated with new shaker cabinets, quartz countertops, and high-efficiency appliances, creating a stylish and functional space for culinary enthusiasts. Featuring four generously sized bedrooms and two and a half baths, this townhome provides ample room
Nestled in the coveted Crown Point area of Pacific Beach, this property is just a stones throw to Mission Bay and about a mile to the beach. Offering coastal living at its finest, this 3bd/3.5ba oasis is light and bright with the perfect blend of comfort and style. You will be greeted by beautiful tropical landscaping out front and have the perfect place to unwind after a long day by the firepit out back. Built in 2021, this home offers beautiful modern finishes throughout. Gorgeous floors, white countertops, beautiful tile and backsplashes in bathrooms. Every bedroom has it's own full bathroom. Solar is owned! Bike or walk to all the near-by attractions, to catch the sunset or to one of m
Desirable 3-bedroom, 2-bathroom home with a bonus room nestled on a spacious lot, boasting privacy fencing and two storage sheds! This move-in ready gem features a luminous and airy floorplan, accentuated by a soothing neutral color scheme. Enjoy modern comforts including a brand-new HVAC system, elegant wood laminate flooring, recessed lighting and sleek granite countertops complemented by stainless steel appliances. The home offers a separate laundry/storage room, with the primary suite featuring a remodeled bathroom and a generous walk-in closet. Benefit from dual-pane windows, abundance of gated parking with room for RV/boat storage and drought-tolerant landscaping with turf. Entertain
This area's enrollment policy is not based solely on geography. Please check the school district website for more information.
Elementary schools
Middle schools
High schools
GreatSchools Summary Rating
10/10
La Jolla Elementary School
Public, K-5
10/10
Silver Strand Elementary School
Public, K-5
10/10
Silver Gate Elementary School
Public, K-4
10/10
Ocean Beach Elementary School
Public, K-4
10/10
Carmel Creek Elementary School
Public, K-3
Only showing 5 of
100+ elementary schools.
School data is provided by GreatSchools, a nonprofit organization. Redfin recommends buyers and renters use GreatSchools information and ratings as a first step, and conduct their own investigation to determine their desired schools or school districts, including by contacting and visiting the schools themselves.Redfin does not endorse or guarantee this information. School service boundaries are intended to be used as a reference only; they may change and are not guaranteed to be accurate. To verify school enrollment eligibility, contact the school district directly.
Homes for sale in San Diego have a median listing price of $1.02M. Some of these homes are Hot Homes, meaning they're likely to sell quickly.
What are some of the most popular neighborhoods in San Diego?
Popular neighborhoods include Carmel Valley, North Park, La Jolla, Rancho Bernardo, Pacific Beach, Point Loma, Tierrasanta, Kensington, Mira Mesa, and Rancho Penasquitos.
San Diego, California boasts a comprehensive transportation system, with a variety of options for residents. Traffic levels for driving can be high during peak hours, but the city's well-planned road network helps manage congestion. Public transportation is readily available, with the Metropolitan Transit System offering bus and trolley services throughout the city. Additionally, San Diego is conveniently located near several major highways and freeways, including Interstates 5, 8, 15, and 805, making car travel to neighboring regions a breeze. Learn more on our San Diego city guide.
What types of properties are available in San Diego?
San Diego, California offers a variety of single-family home types, including ranch-style, contemporary, Mediterranean, and craftsman-style homes, among others. These homes can be found throughout the city, from coastal neighborhoods like La Jolla and Pacific Beach to inland areas like Rancho Bernardo and Scripps Ranch. Most properties feature 2-5 bedrooms and were built in various years. To explore different property types for sale in San Diego, California, use the 'Home type' filter located above the active listings. Customize your search by selecting options like single-family homes, condos, townhomes, and more.
What is life like in San Diego?
Living in San Diego, California offers a unique blend of urban and natural landscapes. The city boasts a variety of neighborhoods, each with its own distinct character and charm. The weather is typically mild and pleasant, with plenty of sunshine year-round. The region is known for its thriving job market, particularly in industries such as technology, healthcare, and defense. Residents can enjoy a wide range of activities, from exploring the numerous parks and beaches to indulging in the vibrant culinary scene and participating in various cultural events.
What are the schools and amenities like in San Diego?
San Diego, California is a city rich in public amenities that cater to the diverse needs of its residents. The city boasts an abundance of restaurants offering a wide range of cuisines to satisfy all palates. Numerous parks provide serene environments for relaxation and outdoor enjoyment. Grocery stores are conveniently located throughout the city, ensuring easy access to daily necessities. Additionally, San Diego offers a range of other amenities such as libraries, fitness centers, and public transportation services, making it a comfortable and convenient place to live.
In the past month, 816 homes have been sold in San Diego. In addition to houses in San Diego, there were also 743 condos, 232 townhouses, and 155 multi-family units for sale in San Diego last month. San Diego is a moderately walkable city in San Diego County with a Walk Score of 53. San Diego is home to approximately 1,305,700 people and 715,317 jobs. Find your dream home in San Diego using the tools above. Use filters to narrow your search by price, square feet, beds, and baths to find homes that fit your criteria. Our top-rated real estate agents in San Diego are local experts and are ready to answer your questions about properties, neighborhoods, schools, and the newest listings for sale in San Diego. Our San Diego real estate stats and trends will give you more information about home buying and selling trends in San Diego. If you're looking to sell your home in the San Diego area, our listing agents can help you get the best price. Redfin is redefining real estate and the home buying process in San Diego with industry-leading technology, full-service agents, and lower fees that provide a better value for Redfin buyers and sellers.


 REDFIN IS COMMITTED TO AND ABIDES BY THE FAIR HOUSING ACT AND EQUAL OPPORTUNITY ACT. READ REDFIN'S FAIR HOUSING POLICY AND THE NEW YORK STATE FAIR HOUSING NOTICE.
 United States
 Canada