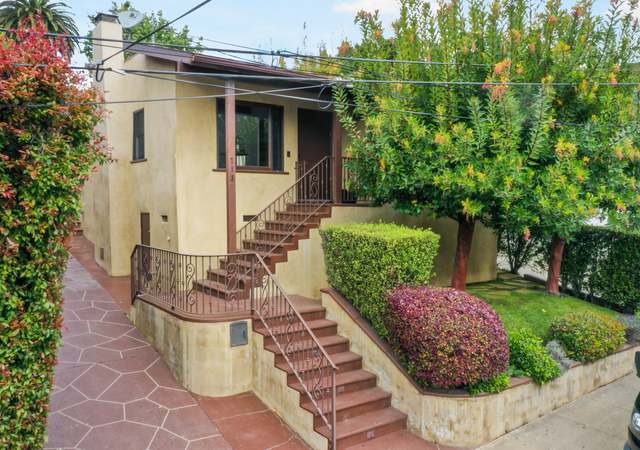
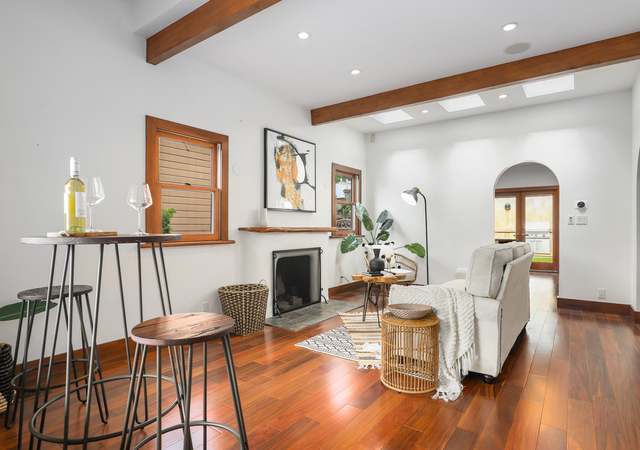
Welcome to this amazing dream home in the heart of one of the most coveted Pacific Palisades neighborhoods! This incredible single-family residence boasts 2 bedrooms, 1.5 baths, and an additional 1 bed/1 bath guest suite in the back, making it perfect for extended family or guests. As you enter, you'll be greeted by an open and airy living room featuring a cozy gas fireplace and stunning wood beam ceilings, creating the perfect ambiance for relaxation. The kitchen is a delight with its spacious layout, ample counter space, custom cabinets, and top-of-the-line stainless steel appliances including a double oven, refrigerator, and dishwasher. Plus, enjoy the convenience of a side-by-side washe
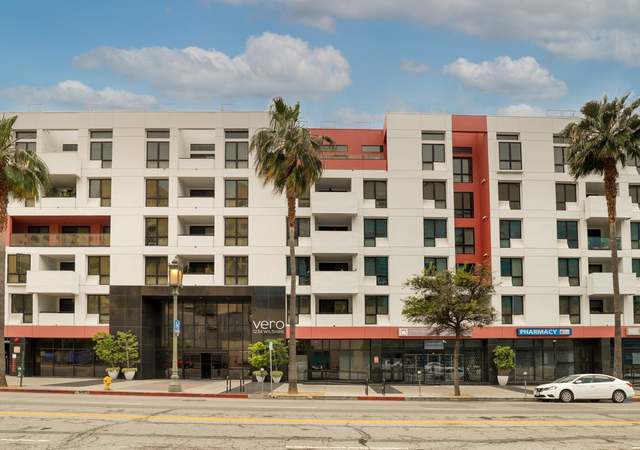
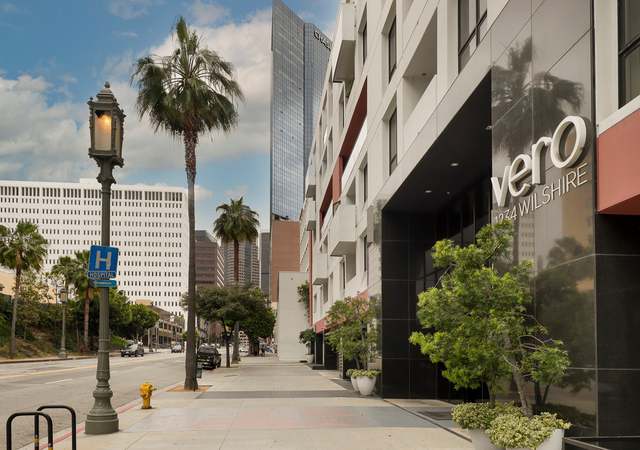
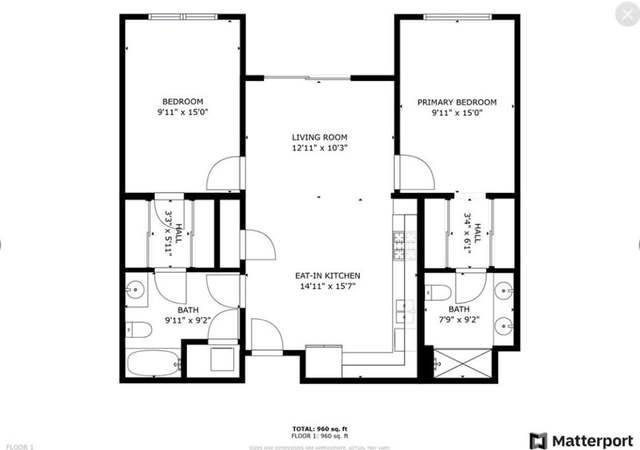
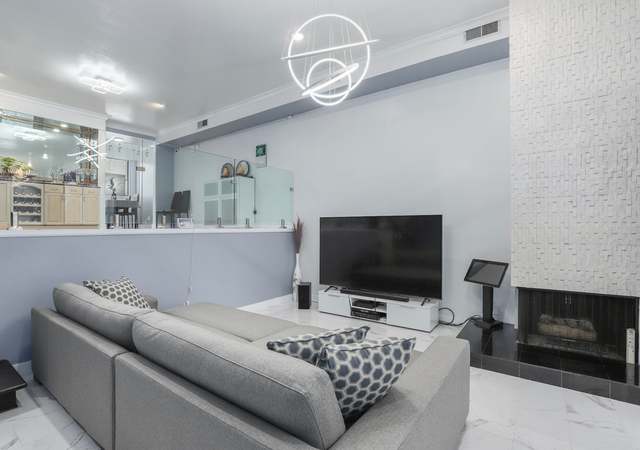
Welcome to the heart of downtown LA with this exceptional 2-bed, 2-bath apartment. Offering a prime location and modern sophistication, this sun-filled residence provides the ultimate urban lifestyle. Enjoy the luxury of two primary bedrooms, each with its own spacious bathroom and ample closet space. The open layout seamlessly connects the living area with a fully equipped kitchen, perfect for entertaining or unwinding after a busy day. Take advantage of top-notch and recently renovated amenities including a heated pool, jacuzzi, sauna, gym, and outdoor BBQ area with firepits. Plus, forget about parking hassles with two reserved tandem spots in a secure garage. Conveniently located with ea
Welcome to this beautifully remodeled townhouse in the highly sought-after Encino Spa East complex! Boasting an expansive 1740 square feet of living space, this spacious residence offers luxurious comfort and modern elegance. Two bedroom suites, plus an office area, and two and a half baths. Step inside to discover a split-level floorplan with direct access to its own private multi-car garage with separate laundry area. The main level features an open concept living room adorned with vaulted ceilings and a cozy fireplace, seamlessly flowing into the dining area highlighted by clear glass panel railings and a built-in bar, perfect for entertaining guests. The large eat-in kitchen features cu
This recently remodeled condo in Sherman Oaks is a real gem! Its features, like the spacious living room with a fireplace, built-ins, and a large private balcony, create a cozy and inviting atmosphere. The gourmet kitchen with quartz counters and stainless steel appliances is a definite delight for anyone who loves to cook. The large bedroom with a walk-in closet and a remodeled bathroom featuring a dual vanity add a touch of luxury. Having your own private washer and dryer in the laundry room next door is a convenient perk. Additionally, assigned parking in a secure gated garage adds to the convenience and peace of mind. The location is also ideal, being close to some of the best restauran
An excellent opportunity to own a hidden gem awaits! This cozy one-bedroom, one-bathroom home is brimming with potential, awaiting your personal touch to transform it into your dream space. Boasting two tandem parking spots and a low HOA, this property also offers the convenience of public electric car charging right outside the building.
Welcome home to this stunning top floor 1 bed 1 bath unit with French doors that open to a balcony boasting breathtaking views of the iconic Hollywood Sign. The rooftop pool is perfect for relaxing and entertaining, with tables, chairs, umbrellas, lounge chairs, and a gas grille for outdoor cooking. Inside, you'll find a spacious walk-in closet and a large changing area in the bathroom for added convenience. The unit is located on the top floor with no one above. Stay active in the exercise room or take a leisurely stroll to nearby Sunset and Melrose for shopping and dining options. This secure building features an indoor gated garage and locked entry to all floors for peace of mind. With e
$559,000
1 bed1 bath706 sq ft
1355 N Sierra Bonita Ave #405, West Hollywood, CA 90046
Peaceful, private, and hedged 1960s Los Feliz 3-story Contemporary masterpiece. This recently renovated showstopper boasts 4 bedrooms, 4 baths, magnificent views, incredible bonus space, and even more possibility for expansion and upside. Drama and wonder can be found here at every turn. To begin, the stately double-door entryway features original Terrazzo floors, a dramatic sweeping staircase, and soaring pitched ceilings. A generous step-down living room sets the tone for sophisticated living. Prime for entertaining, an elegant formal dining room flows seamlessly through sliding doors out to an absolutely awe-inspiring deck which is anchored by a breathtaking view of the surrounding hills
Welcome to this charming two story, corner lot, single-family home situated in the historic and culturally rich neighborhood at the heart of Downtown Los Angeles. The California craftsman style home features 5 bedrooms and 2 baths. 4 bedrooms and 1 bath upstairs and 1 bedroom 1 bath downstairs. The home features hardwood floors throughout and custom ceramic tiles in the bathrooms. The bedroom downstairs is spacious. The home has a living room and formal dining room open to the kitchen. The open kitchen has custom dark wood cabinets and newer appliances. The plumbing and windows all around the house have been updated. Outside there is a playroom with a washer and dryer, which can also be us
Terrific opportunity to reimagine a wonderful one of a kind home on a peaceful street adorned with majestic trees in a great area. This 3 bed/ 1.5 bath plus den home is waiting to create new lasting memories. Generous outdoor space for chilling and grilling. Plus a separate fenced outdoor pool area. Parking will never be an issue with enough space to park 6 plus cars in the garage, carport, and driveway.
Proudly presenting 1208-1210 Poinsettia Drive, a beautiful Spanish duplex in a beautiful tranquil street in West Hollywood. Walking distance to shops, cafes, restaurants, and the West Hollywood Gateway shopping mall. The property consists of a 3bed/3bath two story unit and a 2bed/2bath unit. Each beautiful unit has a washer/dryer hookup, central A/C, tankless water heater.
EXACTLY WHAT YOU HAVE BEEN LOOKING FOR!!! Full of natural light, this spacious & bright 1 bedroom, 1 bathroom unit has two balconies! Large kitchen with stainless steel appliances and granite countertops with seating for four. The living room and dining room area has plenty of space to entertain and relax. Dual balconies located off the living room and bedroom. It's a rarity for a Market Lofts 1 bedroom to have windows, as most 1 bedrooms have the bedroom located behind the kitchen, let alone a sliding door leading to a balcony! A large custom walk-in closet and laundry closet located through the bathroom. Beautiful custom cabinetry provides ample storage space. One parking spot ju
* * * GET THIS HOUSE BEFORE SOMEONE ELSE DOES * * * SINGLE FAMILY HOME 1,080 SQ. FT. THAT SHOWS AS 3 BEDROOMS, 1 BATHROOM, SITTING ON ON A 6,750 SQ. FT. LOT. PROPERTY HAS BEEN WELL MAINTAINED AND IS WAITING FOR NEW OWNERS. CASH OK. HARD MONEY/INVESTOR LOAN OK. FHA FINANCING OK. CONVENTIONAL LOAN OK. MOST FINANCING OK. BUYER(S) AND SELLING AGENT(S) TO DO THEIR DUE DILIGENCE. * * * LISTING HAS SUPPLEMENTAL DOCUMENTS SO DON'T FORGET TO CHECK THEM OUT. NO WARRANTIES, NO GUARANTEES, EXPRESSED OR IMPLIED. BUYER(S) AND SELLING AGENT(S) TO DO THEIR DUE DILIGENCE. OFFERS WILL BE SENT TO SELLER IMMEDIATELY UPON RECEIPT!!!
Do not miss this lovely property located in the “Melody Acres” neighborhood of Tarzana. 3,448 sq ft. Contemporary Ranch style single story family home + 1,008 sq. ft ADU, lot size 25,860 sq. ft. , over ½ acre with three hundred feet of frontage! The property includes a multitude of wonderful features: two electric access gates, putting green, lagoon pool & spa, vegetable garden with fruits trees, mature trees, and a chicken coop. Enjoy all this while choosing which of the four lovely sitting areas surrounded by the beautiful lighted gardens that twinkle under the evening stars. Owners have kept the original charm of the 1946 adobe build, and with great integrity hav
Escape to this secluded haven, tucked away at the end of a private driveway in the picturesque hills of Studio City, where breathtaking views of the valley and canyons await. A charming courtyard, complete with a tranquil water feature, sets the tone for the serene ambiance that permeates this property. This stunning residence spans 2,557 square feet of living space, offering four bedrooms and four baths, all situated on a massive 41,265 square foot lot. Step inside to discover a generously appointed layout, featuring a spacious formal living room with a cozy fireplace, an elegant dining room ideal for entertaining, and a well-equipped kitchen ready to inspire culinary creations. The oversi
Remodeled 2 Bedroom 1 Bathroom. enters through the living room area with a modern recess lighting, Laminated flooring throughout the home, Kitchen has been remodeled and new quartz countertops, Oven, Dishwasher, Hood, and microwave, The primary bedroom has a large closet and plenty of space for storage through the home. Conveniently includes central cooling and heating unit. beautiful renovated Bathroom with brand new tile and quartz sink countertops. 2 side by side assigned parking spaces included. Low HOA includes community room, laundry room area, building maintenance, hot water, trash, and landscaping. Condominium is one floor plan and there is no neighbors above.
Three 1br/1ba units -- 2x units delivered vacant & 1x occupied @ $930/mo --- 1687 sq ft single story Triplex w/ ground level entrances 3x 1Br/1Ba units on 4,968 sqft located in prime Eagle Rock, steps away from shopping and dining options on Colorado and Eagle Rock boulevards. Gated driveway and large fenced-in yard with mature fruit trees. Zoning = [Q]C4-1XL TOC Tier 4 (per Zimas). Highly rated public K-8 and High School. Property subject to LA RSO (rent control) Commercial Zoning so could possibly be converted to business (Child Care, Assisted Living, Sober Living etc) Check with city of LA for different potential development opportunities Major value add opportunity * * Do NOT
Location. .. Location Spacious 1574 sqft highest floor corner Unit penthouse at the desirable San Tropez Villas in Encino features 2 master luxury suites. This spacious end unit features double suite doors entry to a high ceiling large living rooms full of natural light, large windows and a large private balcony with mountain view, built-in wet bar perfect for entertaining, updated kitchen with quartz countertops and modern white cabinets, Spacious primary suite offers a a cozy fireplace, en-suite bathroom separate shower and bath and large walk-in closet, a separate guest bathroom and a laundry room conveniently located on the first level, lots of storage space and a large dining area.
Welcome to The Regal, a luxurious retreat nestled in one of LA's most sought-after neighborhoods, harmoniously combining historical charm with contemporary convenience. This residential 2-story home boasts a private 1000 square foot deck with spa, 4 bedrooms and 4 baths. Additionally, it offers a detached 4-car garage, providing a house-like feel separate from the main building. Offering a tranquil and lavish lifestyle, our elegantly appointed residences align with LA's finest standards while providing the modern conveniences you deserve. As LA's newest and premier luxury building, The Regal stands out with its modern and high-end design, making it the optimal choice for professionals, give
$2,750,000
4 beds4 baths2,560 sq ft0.64 acre (lot)
3657 1/2 Regal Pl Unit 3657 1/2, Los Angeles, CA 90068
This home is within the full developed city of Los Angeles, close to public transportation, educational institutions, historical land marks, and entertainment of all types.
Welcome to your dream home located in the highly desirable neighborhood of Beverly Glen in Bel Air. This stunning single-family property offers the perfect blend of modern living and convenience, and is a must-see. With 2 bedrooms and 2 bathrooms this home is ideal for young professionals looking to settle down in a vibrant and sought-after neighborhood. As you step inside, you’ll be greeted by an abundance of natural light flooding through the windows, giving the entire space a warm and inviting ambiance. You will never grow tired of the beautiful mountain view visible from the living room window. This home boasts 1340 sf, with a generous lot size of 11526 sf with room for expan
Welcome to this stunning Oasis in the heart of the prime Los Feliz neighborhood. This Spanish modern duplex offers an ideal living arrangement with head-on views of the Rowena Reservoir. The property features two beautifully updated units, providing the perfect opportunity for an owner-occupant to enjoy one unit while generating income from the other. The first unit boasts 2 bedrooms and 1 bathroom, while the second unit offers 1 bedroom and 1 bathroom, both beautifully updated throughout. Each unit welcomes you with a spacious living room flooded with natural light, complemented by a huge picture window that frames the front patio and showcases breathtaking views of the reservoir. The kitc
Discover unparalleled sophistication and convenience at 330 Westbourne Dr, nestled in the prestigious West Hollywood West community. This completely reimagined residence spans approximately 1,728 sq ft on a single level, featuring three bedrooms plus an office/flex room and two bathrooms. Over $600,000 in meticulous upgrades have transformed this home into a stunning showcase of modern luxury. Enter through a private, fully-enclosed gateway that opens to a charming pathway leading to the residence and a convenient two-car driveway. The interior boasts an expansive open floor plan, accentuated by 9' arched windows that flood the living spaces with natural light, enhancing the seamless flow b
Welcome to this captivating mid-century home located at 6142 Manton Ave in the vibrant community of Woodland Hills. Meticulously updated throughout to meet the modern homeowner's needs, this property offers a unique blend of style, comfort, and practicality, making it a perfect choice for those looking for their forever home. This residence features 4 spacious bedrooms and 2.5 well-appointed bathrooms. The home's design maximizes natural light, enhancing the welcoming and warm atmosphere in every room. The kitchen and dining area are equipped with stunning bifold doors and windows, creating an effortless flow to the outdoor space. Speaking of the outdoors, the property boasts a professional
Don't miss the opportunity to check out this beautiful property! This charming single level home offers 3 bedrooms, 2 bathrooms and 1334 sqft. of living space. Huge master bedroom with access to the backyard. Kitchen with tons of storage space, laundry room inside, all good size bedrooms. New landscaping in both front and rear yards. The rear yard has a covered patio to enjoy those relaxing moments or for those wonderful gatherings. The detached garage is an ADU potential. Residence is close to the following areas and attractions/venues: LAX, Sofi Stadium, KIA forum, YouTube Theater and the upcoming Clippers Stadium
Welcome to your Loft: town home style located in the Arts District: A HIP Artists and Celebrity enclave in DTLA: nearby galleries, restaurants, bars, coffee shops, hotels, Little Tokyo. Upon entering the Loft you are greeted with about 26 feet bowstring high ceiling and wall of glass with natural lighting. The main floor offers a large living space for living, work or entertaining. Open floor plan lead to kitchen: stainless appliances and stone counter tops. Polished and Stained concrete floors through out, bathroom with in-unit washer and dryer. 2nd floor is spacious loft style bedroom with custom linen curtains, wood floor, custom mirrors, Lots of wall space for art work. Reasonable HOA d
Two homes on a lot! Great opportunity for owner user or investor. Front home is one story featuring 2 bedrooms + 3/4 bathroom, spacious living room, dining area off kitchen with breakfast nook, laundry area with hook-ups for side by side washer and dryer plus storage. The front home also has a partial basement that can be used for additional storage. The second home at the rear of the property is two stories, featuring 2 bedrooms, one downstairs and one upstairs. There is a 3/4 bathroom on the first floor and and a full bathroom on the second floor. Galley style kitchen with double sink and pantry area for additional storage. Laundry area in unit with hook-ups for side by side washer and dr
GREAT MIX-USED INVESTMENT OPPORTUNITY! FULLY OCCUPIED! IMMEDIATE CASH FLOW! This mix-used property consists of 3 residential and 2 commercial spaces, this adaptable gem currently showcases an impressive net operating income of $103,100 per year, and the tenant pays rent on time. Each unit has separate gas and electrical meters. Designate parking and street parking available, concrete backyard and front yard. Street retail space can be used as storefront, restaurant and so much more. This remarkable property reveals boundless potential! Easy access to I405, I110, grocery stores, parks, Downtown LA, the beach, Westfield Mall, Crypto.com Center and SOFI Stadium. * * Drive by ONLY, do not dist
Don't miss out on this incredible opportunity to own two separate units in El Sereno! With one unit ready for immediate owner or rental occupancy and the other generating rental income, you can start benefiting right away. Each unit boasts its own private yard, while a spacious shared backyard and patio offer the perfect space for entertaining. On a generous 7,330 square foot lot, there's ample room for the possibility of expansion or development, making this an ideal investment opportunity. Both units were partially updated in 2011, with the 2 bedroom recently receiving a fresh coat of paint, bathroom remodel, new water heater, new doors and more. All units have plenty of windows and ceili
* * Showing starts 4/11/2024 * * . Welcome to your new cozy retreat in Northridge! This delightful home offers ample space to unwind and rejuvenate, complete with a newly installed kitchen, and sprinkler system for added convenience. Situated on a generous 8520-square-foot lot, you'll also have a 2-car attached garage and easy street parking in the quiet cul-de-sac. But that's not all! This classic gem is perfectly located at the heart of Northridge, merely minutes away from the Northridge Fashion Center, where you can indulge in premier shopping, entertainment, and dining options. Plus, with quick access to I-405, SR-118, and SR-27. Don't let this opportunity slip away! Make this charmin
First time in the market in 45 years! Exquisite 4-Bedroom, 3-Bathroom Single-Family Home. Discover the perfect blend of comfort and elegance in this beautifully maintained home, boasting an impressive 2,574 square feet of living space nestled on nearly half an acre. As you enter, you are welcomed by a spacious family room featuring a cozy fireplace and floor-to-ceiling windows that flood the space with natural sunlight and highlight the gorgeous tiling. The first floor hosts a luxurious master bedroom with double entry doors that open to the breathtaking backyard. The master suite is complete with his-and-hers sinks, a vanity section, marble tile flooring, a walk-in shower, and a bathtub po
Welcome to your dream home in Tarzana! This stunning 5-bedroom, 5.5-bathroom remodeled home offers the pinnacle of luxury living. Situated in the prestigious neighborhood of Tarzana, this home is a masterpiece of modern design and comfort. Step inside to discover a spacious floor plan filled with natural light. Continue the entertainment in your bar/lounge area which seamlessly opens up to your formal living room. The formal living room area features a beautiful stone fireplace, the kitchen offers an oversized island, Thermador appliances and an eating area that offers both indoor and outdoor living. The primary suite includes a stone fireplace, pocket sliding doors to the backyard, a spaci
Great Location! Four Plex in Prime location just North of Melrose. Zoned LAR3 . There are four 1 bdrm + I bthrm units in the Bldg. , plus Two garages with one car parking for each unit. All units are occupied. The Bldg. is approx 6792 sq ft. Walk to stores, restaurants and shops. Tree lined St. with parking. With strong current income and future rental upside potential, this property offers significant value. All units are separately metered for gas and electricity. Most of the 4 units have been updated. Recent upgrades include some plumbing, newer electrical in some units. it's worth noting it's location is close to west Hollywood shopping, the Grove and Holywood. Plenty of upside in curre
Spacious & bright 2Bed + Den + Formal Dining residence with serene mountain & breath-taking city views in fabulous Wilshire House, LA's premier full service high rise on famed Wilshire Corridor. This unique property with a highly coveted floor plan offers a formal entry gallery hallway which leads to a grand living room with fireplace, separate den/office (3rd. room poss. ) and a large formal dining room. The kitchen has generous counter-top space, a sunny breakfast area and laundry. Primary suite includes two large walk-in closets, a fireplace and luxury bathroom. Additionally, there is a 2nd bedroom en-suite, a powder room and a guest closet. Great wall space for artwork, floo
Charming Single Story Home on LARD1.5 Multi-Res Zoned Lot located in East Hollywood. Property features 3 bedrooms, 2 baths, 1,426 sqft. (tax assessor shows as 2 bed, 1 bath). Perfect opportunity for the first time home buyer or seasoned investor/builder. Has large gated driveway, large front porch on house with spacious Bedrooms, walk-in closets. The open floor plan living room and dining room are perfect for large gatherings. Newer Appliances and Newer Roof. Conveniently located near shops, restaurants, Los Angeles City College, Kaiser Hospital and Children’s Hospital. Just minutes away from Los Feliz and Silverlake area.
Unleash Your Inner Homebody (and Entertainer)! Craving a place that ignites your excitement for everyday living? Look no further! This enchanting home isn't just a house; it's a launching pad for fabulous memories. Imagine mornings filled with sunlight streaming through the gourmet kitchen, perfectly placed for coffee-fueled creativity. Picture evenings spent under the stars, unwinding in your expansive, tranquil, and spacious backyard—perfect for hosting legendary barbecues. Transition seamlessly to hosting movie nights in the inviting large family room, ideal for big gatherings. Open Concept Oasis: Enjoy a seamless flow between the open living room, dining room, and kitchen combo
$995,000
4 beds2 baths1,896 sq ft8,674 sq ft (lot)
10000 Lemona Ave, Mission Hills (san Fernando), CA 91345
We are pleased to present a prime 6,000 sf development opportunity zoned RD1.5 in one of the fastest growing pockets of Los Angeles. First time on the market in five decades, this owner-occupied single family home with an alley access, is not subject to SB8 and is situated within a non-RSO section of the Historic Filipinotown (HIFI) area of trendy Echo Park/Silver Lake. Centrally located, you are only minutes from the 101 Fwy, Downtown LA and many of the area's attractions such as Bootleg Theatre, Doubting Thomas, Crawford's, 1642 Bar, Brooklyn Bagel Bakery, Gigi's Bakery & Cafe, HiFi Kitchen and many more. Property is sold in as-is condition with no credits or repairs. Buyer to verif
Rare opportunity to own a cash flowing compound! Currently all three units are rented. Drive by only, please do not disturb occupants. Main house is over 1,600 SF and features 4 beds (3+open office), 3 baths, a breezeway that attaches to a 2 car garage. Remodeled in 2020, the home features quartz counters and stainless appliances, luxury vinyl plank floors, wood windows and a lovely fully fenced yard. Behind the garage is 7756 and 7756 1/2 Delco Ave. a fully permitted 1200 SF 2 story ADU that has been split into two apartments. 7756 1/2 is the smaller second floor apartment and is 500 square feet with an eat in kitchen, private laundry, 2 bedrooms and 1 bath and offers a huge enclosed pati
This is a rare and exceptional chance for builders, flippers, and potential homeowners looking to build or renovate their dream home. Situated in the sought-after and prestigious Celebrity enclave of Beverly Hills Post Office, this property comes with approved plans ready for a 7,500 +/- square foot home on a 32,000 square foot lot. The property provides a unique opportunity for architectural creativity, with tree-top views in every direction. Surrounded by mature landscaping, the lot offers a peaceful and picturesque setting perfect for a new custom build or renovation. Perched atop the Canyon with breathtaking views, this property offers secluded living in a highly desirable neighborhood.
Welcome to 130 - 130 1/2 Clarence St, a well-kept exceptional investment opportunity in the prime neighborhood of Boyle Heights. Zoned RD3, this property is a short walk to the nearest Metro light rail station, and minutes from DTLA and the Arts District. This duplex consists of two separate detached structures with its own private access and yard spaces. The front unit is 2 bedroom (currently used as 3 bedroom) and 1 bathroom. The back unit is 2 bedroom 1 bathroom with an attached basement. Easy access to major Freeways 10, 60, 5, 101. The steady demand for rental properties in the area ensures a consistent stream of income, providing a reliable source of cash flow. Property will be delive
This area's enrollment policy is not based solely on geography. Please check the school district website for more information.
Elementary schools
Middle schools
High schools
GreatSchools Summary Rating
10/10
Balboa Gifted/high Ability Magnet Elementary School
Public, 1-5 • Choice school
10/10
Lanai Road Elementary School
Public, K-5
10/10
Vintage Math/science/technology Magnet School
Public, K-5
10/10
Hermosa View Elementary School
Public, K-3
10/10
Lunada Bay Elementary School
Public, K-5
Only showing 5 of
100+ elementary schools.
School data is provided by GreatSchools, a nonprofit organization. Redfin recommends buyers and renters use GreatSchools information and ratings as a first step, and conduct their own investigation to determine their desired schools or school districts, including by contacting and visiting the schools themselves.Redfin does not endorse or guarantee this information. School service boundaries are intended to be used as a reference only; they may change and are not guaranteed to be accurate. To verify school enrollment eligibility, contact the school district directly.
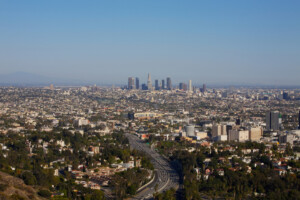
Homes for sale in Los Angeles have a median listing price of $1.2M. Some of these homes are Hot Homes, meaning they're likely to sell quickly.
What are some of the most popular neighborhoods in Los Angeles?
Popular neighborhoods include Pacific Palisades, Encino, Porter Ranch, Sylmar, Studio City, Granada Hills, Sherman Oaks, Chatsworth, Northridge, and Woodland Hills.
Los Angeles, California, is known for its extensive network of freeways and highways, making it a car-centric city. However, the city often experiences high traffic levels, particularly during peak hours, which can lead to substantial delays. Despite this, Los Angeles also offers a variety of public transportation options, including buses and a metro rail system. This combination of car and public transportation infrastructure provides residents with multiple commuting options throughout the city. Learn more on our Los Angeles city guide.
What types of properties are available in Los Angeles?
Los Angeles, California offers a variety of single-family home types, including ranch-style, contemporary, modern, Mediterranean, and craftsman-style homes, among others. These homes can be found throughout the city, from the bustling neighborhoods of Downtown Los Angeles to the scenic hills of Bel Air and the beachfront communities of Malibu. Most properties feature multiple bedrooms and were built in various years, providing a range of options for buyers. To explore different property types for sale in Los Angeles, California, use the 'Home type' filter located above the active listings. Customize your search by selecting options like single-family homes, condos, townhomes, and more.
What is life like in Los Angeles?
Living in Los Angeles, California offers a unique experience with its vibrant urban environment and diverse neighborhoods. The landscape is a mix of urban sprawl, palm-lined streets, and picturesque mountains in the distance. The weather is typically warm and sunny, with mild winters and hot summers. The city provides a plethora of job opportunities, particularly in the entertainment industry, technology sector, and healthcare field. There are endless things to do, from exploring trendy neighborhoods and dining at diverse restaurants to attending cultural events and enjoying outdoor activities like hiking and surfing.
What are the schools and amenities like in Los Angeles?
Los Angeles, California is a city rich in public amenities that cater to the diverse needs of its residents. The city boasts a plethora of restaurants, offering a wide range of cuisines to satisfy every palate. For those who enjoy outdoor leisure, numerous parks are scattered throughout the city, providing green spaces for relaxation and recreation. In terms of daily necessities, residents have access to multiple grocery stores, ensuring easy access to food and other essential items. Additionally, Los Angeles offers a variety of other amenities such as libraries, sports facilities, and public transportation, contributing to the overall quality of life in the city.
In the past month, 1545 homes have been sold in Los Angeles. In addition to houses in Los Angeles, there were also 1577 condos, 323 townhouses, and 1153 multi-family units for sale in Los Angeles last month. Los Angeles is a moderately walkable city in Los Angeles County with a Walk Score of 69. Los Angeles is home to approximately 3,787,000 people and 1,678,570 jobs. Find your dream home in Los Angeles using the tools above. Use filters to narrow your search by price, square feet, beds, and baths to find homes that fit your criteria. Our top-rated real estate agents in Los Angeles are local experts and are ready to answer your questions about properties, neighborhoods, schools, and the newest listings for sale in Los Angeles. Our Los Angeles real estate stats and trends will give you more information about home buying and selling trends in Los Angeles. If you're looking to sell your home in the Los Angeles area, our listing agents can help you get the best price. Redfin is redefining real estate and the home buying process in Los Angeles with industry-leading technology, full-service agents, and lower fees that provide a better value for Redfin buyers and sellers.


 REDFIN IS COMMITTED TO AND ABIDES BY THE FAIR HOUSING ACT AND EQUAL OPPORTUNITY ACT. READ REDFIN'S FAIR HOUSING POLICY AND THE NEW YORK STATE FAIR HOUSING NOTICE.
 United States
 Canada