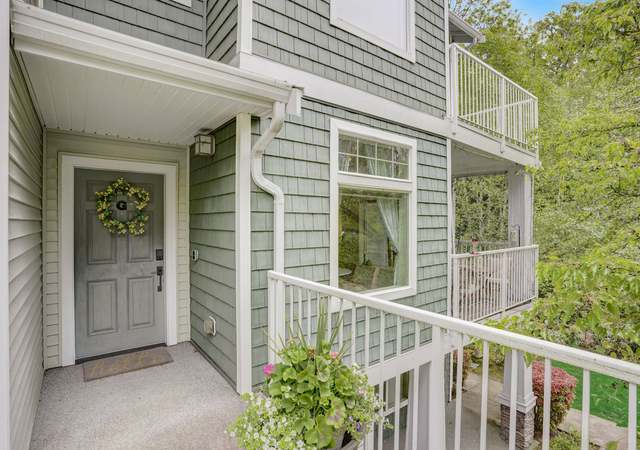
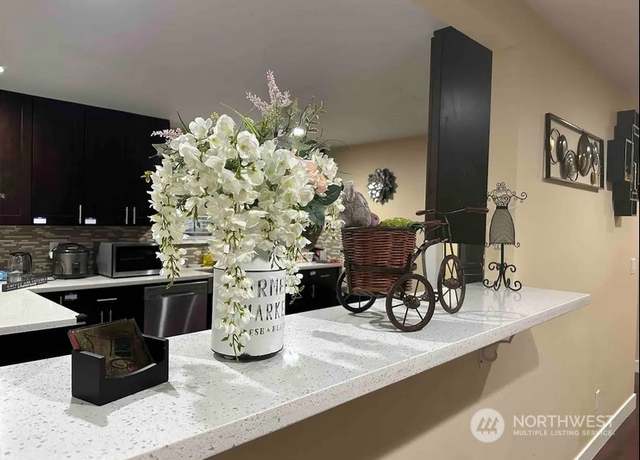
Centrally nestled in convenient location, this well maintained 2-bed, 2-bath corner unit unveils a private and inviting living environment. Embracing an airy layout, discover a generously sized kitchen w/ sleek shaker cabinets, ss appliances, and abundant storage. The primary suite boasts a spacious closet and bath, while the sizable second bedroom offers versatile usage. Step onto your private covered deck, an idyllic space for year-round enjoyment. Convenience is key with a connected 1-car garage and an additional space right at your doorstep. Situated in a tranquil, well-kept community mere moments from Southcenter, the Airport, and major freeways, this residence presents an ideal hub fo
1/35
$438,000
2 beds2 baths1,007 sq ft
21420 40th Pl S Unit G, Seatac, WA 98198
Listing provided by NWMLS as Distributed by MLS Grid
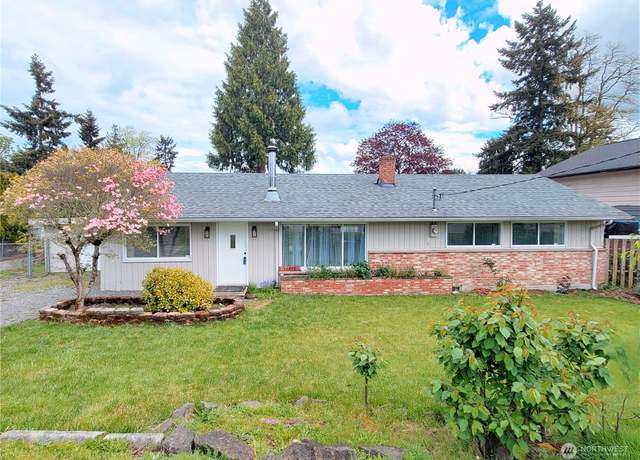
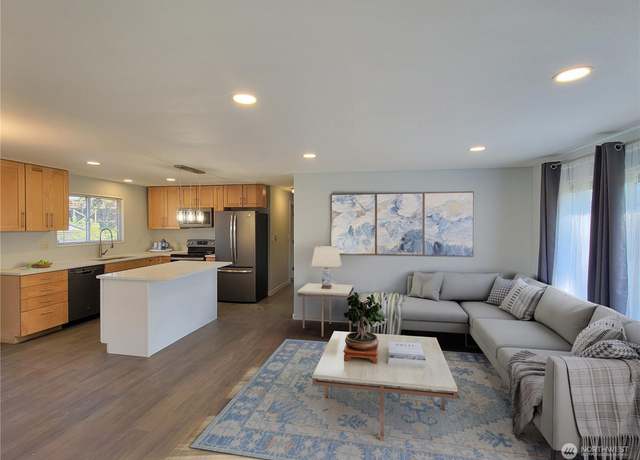
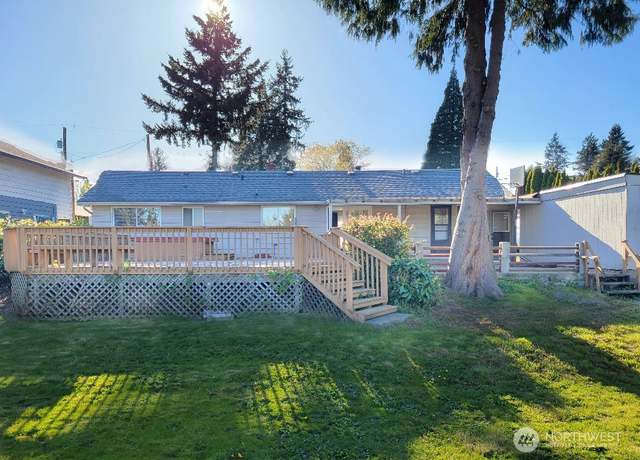
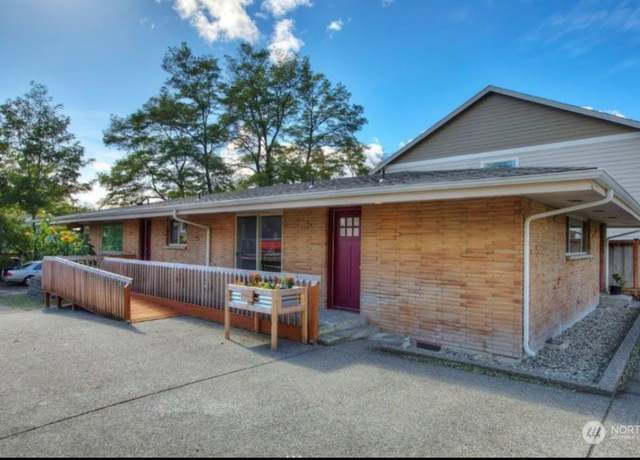
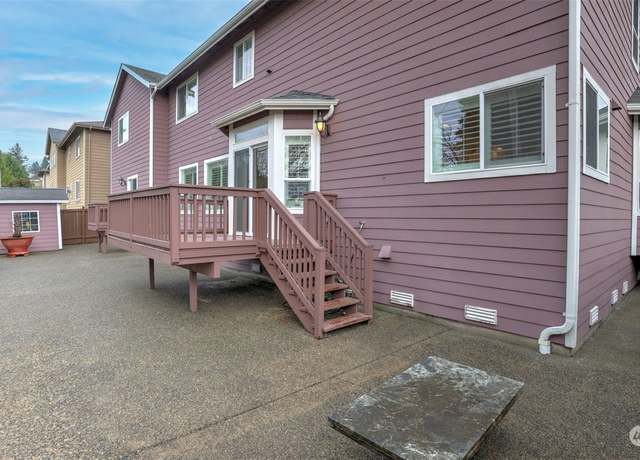
Turn-key Updated True One Story Bow Lake Rambler on a Spacious 10,000+ sq ft Fully Fenced Living. First time on market in over 40 years. Open concept kitchen and eating space. Wood burning stove brings cozy efficient warmth to living room. Master located at the front of home, offers fully renovated en suite bath. Don't miss the vintage original French-door-style slider opening to HUGE back patio and spacious back yard. Covered secure walkway behind home links kitchen and mud room to detached garage. Established landscaping throughout property. Super walkable location close to schools, library and parks. Minutes drive to retail, SeaTac airport, Angle Lake light rail station and I5/I405. Loca
1/18
$584,900
4 beds2 baths1,300 sq ft0.23 acre (lot)
17812 46 Ave S, Seatac, WA 98188
Listing provided by NWMLS as Distributed by MLS Grid
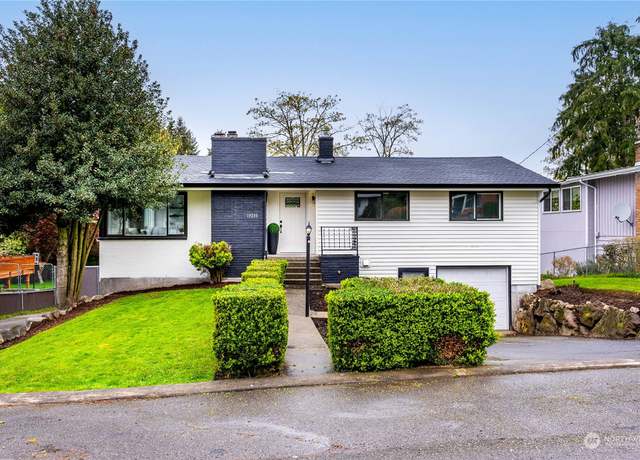
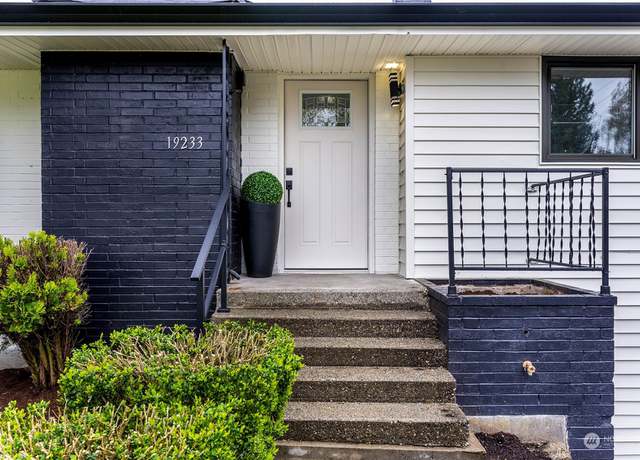
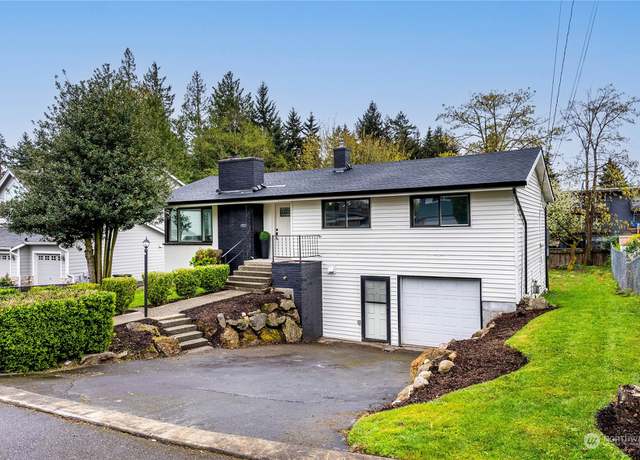
This newly renovated modern masterpiece boasts elegance & style. Nestled in w/ exclusive access to Angle Lake. Step inside to discover an open-concept living space flooded w/ natural light, sleek finishes & designer touches throughout. Expansive windows showcasing breathtaking views. Entertain in the gourmet kitchen complete w/ brand new appliances & a spacious island for gathering. Unwind in the beautiful main-level primary. Outside, a sprawling deck awaits for dining or soaking in the sunshine. The basement has something for everyone w/ wood burning fireplace, bar & room for all the gaming or relaxing. With Direct access to the lake, enjoy endless days of water act
1/35
$829,950
4 beds3 baths1,940 sq ft9,265 sq ft (lot)
19233 33rd Ave S, Seatac, WA 98188
Listing provided by NWMLS as Distributed by MLS Grid
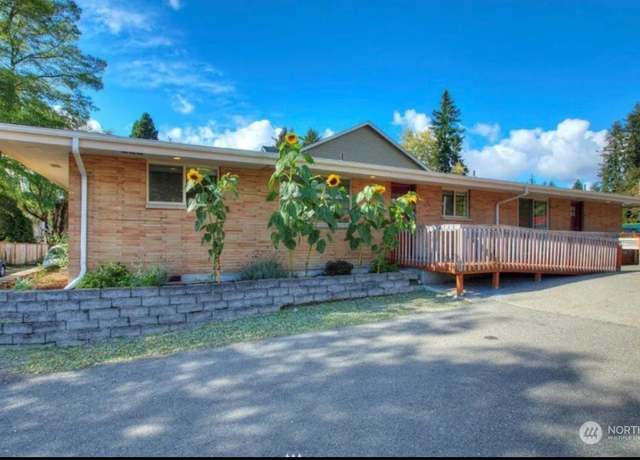
Welcome to your oasis of comfort and elegance! This delightful rambler offers a harmonious blend of modern convenience and timeless charm. Step inside and experience the epitome of open-space living, accentuated by abundant natural light and thoughtful design. The heart of this home revolves around its spacious open-concept living area, where the kitchen seamlessly flows into the dining and living spaces. Discover the luxury of not one, but two master suites! Each generously sized bedroom boasts its own en-suite bathroom, providing unparalleled privacy and comfort. You'll enjoy easy access to shopping, dining & parks. Commuting is a breeze with nearby freeway access and public transit
1/24
$694,500
4 beds3 baths1,960 sq ft8,080 sq ft (lot)
4346 S 168th Ln, Seatac, WA 98188
Listing provided by NWMLS as Distributed by MLS Grid
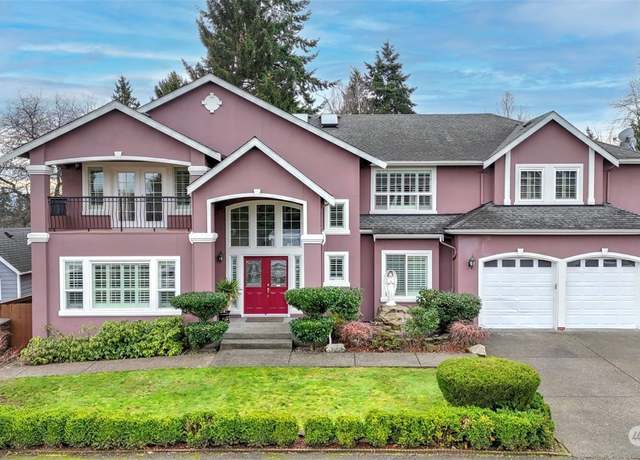
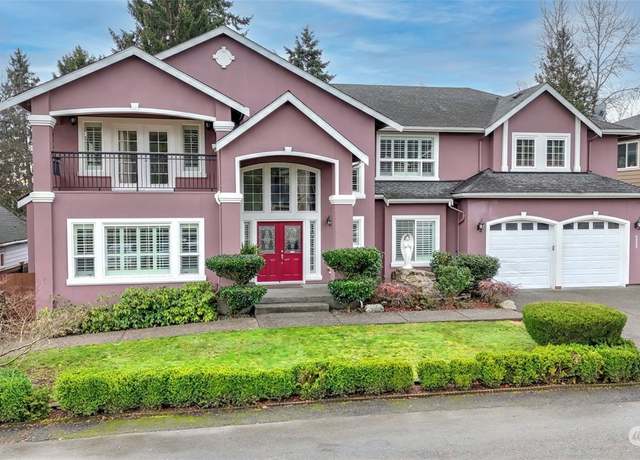
Welcome to beautiful 2006 custom built home w/ territorial views of Kent Valley & mountains. The home offers versatile layout to accommodate all needs and it is embodiment of sophistication, practically, & warmth. The gourmet kitchen, featuring stainless steel appliances, granite countertops, & walk-in pantry. Beautiful crown molding & millwork throughout. Windows are installed w/ custom California shutters. Hardwood floor. Main floor consist of 2 bedrooms, a full bath. Upper floor features large master en-suite bedroom, large walk-in closet, & private balcony. 4 additional large bedrooms, each w/ walk-in closet. A full bathroom & laundry room. Low maintenan
1/40
$1,160,000
6 beds3 baths3,890 sq ft7,500 sq ft (lot)
5225 S 170th Ln, Seatac, WA 98188
Listing provided by NWMLS as Distributed by MLS Grid
Don't Miss this Unique architecture style Home!! 3-bedroom, 2-bathroom Upstairs; Downstairs basement can be easily converted into a studio or Mother in-law! Plenty of natural light. Floor to ceiling windows & Amazing original antique fixtures thru all the House. Large, covered carport for motorcycle, boat, or RV. 1 car garage can be used as a shop! or you can just convert into 3 car garage. 2 Decks! Front deck with views of valley and mountains; Back deck is covered for year-round enjoyment. Large patio perfect for entertaining and gardening Great location closed to shopping/dining as well as freeway access. Nice quiet neighborhood.
$630,000
3 beds2 baths1,540 sq ft9,819 sq ft (lot)
16813 53Rd Ave S, Tukwila, WA 98188
Listing provided by NWMLS as Distributed by MLS Grid
The Southard is an environmentally sustainable neighborhood developed by Homestead Community Land Trust. Perfect for people who want a climate conscious lifestyle in a thoughtful community. This four-bedroom cottage-style home is designed for beauty, functionality, and energy efficiency. Built to a Net-Zero energy standard they include solar panels for onsite energy production, EV Charging Station and nearby light rail station for climate-conscious travel. Pea-patch community garden space, salmon-safe stormwater systems and educational installations. With I5, highways 518 & 509 less than 5 minutes away, you have direct access to amenities and all points in the region. This unique home
$645,000
4 beds3 baths1,437 sq ft
13813 32nd Ln S, Tukwila, WA 98168
Listing provided by NWMLS as Distributed by MLS Grid
The Southard is an environmentally sustainable neighborhood developed by Homestead Community Land Trust. Perfect for people who want a climate conscious lifestyle in a thoughtful community. This three-bedroom cottage-style home is designed for beauty, functionality, and energy efficiency. Built to a Net-Zero energy standard they include solar panels for onsite energy production, EV Charging Station and nearby light rail station for climate-conscious travel. Pea-patch community garden space, salmon-safe stormwater systems and educational installations. With I5, highways 518 & 509 less than 5 minutes away, you have direct access to amenities and all points in the region. This unique hom
$645,000
4 beds3 baths1,437 sq ft
13815 32nd Ln S, Tukwila, WA 98168
Listing provided by NWMLS as Distributed by MLS Grid
The Southard is an environmentally sustainable neighborhood developed by Homestead Community Land Trust. Perfect for people who want a climate conscious lifestyle in a thoughtful community. This four-bedroom cottage-style home is designed for beauty, functionality, and energy efficiency. Built to a Net-Zero energy standard they include solar panels for onsite energy production, EV Charging Station and nearby light rail station for climate-conscious travel. Pea-patch community garden space, salmon-safe stormwater systems and educational installations. With I5, highways 518 & 509 less than 5 minutes away, you have direct access to amenities and all points in the region. This unique home
$645,000
4 beds3 baths1,437 sq ft
13847 32nd Ln S, Tukwila, WA 98168
Listing provided by NWMLS as Distributed by MLS Grid
The Southard is an environmentally sustainable neighborhood developed by Homestead Community Land Trust. Perfect for people who want a climate conscious lifestyle in a thoughtful community. This three-bedroom cottage-style home is designed for beauty, functionality and energy efficiency. Built to a Net-Zero energy standard they include solar panels for onsite energy production, EV Charging Station and nearby light rail station for climate-conscious travel. Pea-patch community garden space, salmon-safe stormwater systems and educational installations. With I5, highways 518 & 509 less than 5 minutes away, you have direct access to amenities and all points in the region. This unique home
$627,000
3 beds2 baths1,407 sq ft
13831 32nd Ln S, Tukwila, WA 98168
Listing provided by NWMLS as Distributed by MLS Grid
The Southard is an environmentally sustainable neighborhood developed by Homestead Community Land Trust. Perfect for people who want a climate conscious lifestyle in a thoughtful community. This four-bedroom cottage-style home is designed for beauty, functionality, and energy efficiency. Built to a Net-Zero energy standard they include solar panels for onsite energy production, EV Charging Station and nearby light rail station for climate-conscious travel. Pea-patch community garden space, salmon-safe stormwater systems and educational installations. With I5, highways 518 & 509 less than 5 minutes away, you have direct access to amenities and all points in the region. This unique home
$665,000
4 beds3 baths1,408 sq ft
13839 32nd Ln S, Tukwila, WA 98168
Listing provided by NWMLS as Distributed by MLS Grid
This beautiful SeaTac home boasts 1,860 sqft of living space on a generous 7,866 sq ft lot, showcasing a total of 6 bedrooms and 2.5 bathrooms. The main floor welcomes you with 4 spacious bedrooms and an open kitchen, providing ample space for rest and relaxation. Downstairs, the fully finished basement features a separate entrance, offering 2 additional bedrooms, a kitchen, and a full bathroom - ideal for creating a separate living area or generating extra rental income. Don't miss out on this rare opportunity to own a piece of paradise in SeaTac!
$629,000
6 beds2.5 baths1,860 sq ft7,866 sq ft (lot)
16636 51st Ave S, Seatac, WA 98188
Listing provided by NWMLS as Distributed by MLS Grid
Welcome to this beautiful fully remodeled Tudor styled 2 bdrm, 1.5 ba condo. Pristinely renewed with updated kitchen, newer hot water tank, newer lighting, and accented by beautiful laminate flooring throughout. It come with in-unit washer/dryer which is unique in this entire condo complex. This end unit condo offer lots of natural light and extra privacy. Community amenities includes 3 pools, fitness center, sauna, court, cabana and manicured grounds. Enjoy close access to Freeways and walking distance to light rail station. Secured gated grounds and a designated owner parking space with ample guest parking. No rental caps.
$305,000
2 beds1.5 baths1,093 sq ft
3425 S 176th St #156, Seatac, WA 98188
Listing provided by NWMLS as Distributed by MLS Grid
Completely remodeled SeaTac rambler in highly sought after Angle Lake! New everything. Beautiful kitchen features white custom cabinets, back splash, stainless steel appliances, quartz counter tops, and a gas range. Marble surround in front bathroom and vanity. Fresh interior/exterior paint, new doors, recessed lighting, PEX plumbing, new hot water heater, new laminate floors, new carport roof w/ skylights & updated electrical. New sewer line (2017) & new water main (2019). Fantastic location mins to SeaTac Airport, South Center Mall, Angle Lake, transit, light rail, freeways, and DT Seattle. Major bus line/routes is a couple blocks away.
$725,000
3 beds2 baths1,830 sq ft0.29 acre (lot)
3401 S 198th St, Seatac, WA 98188
Listing provided by NWMLS as Distributed by MLS Grid
This beautiful home features a sturdy structure with a new roof, flooring, and carpet replaced in 2022 Excellent access to the coming light rail freeway Main level boasts a beautiful kitchen and dining room with a sliding door leading to the deck along with four bedrooms Downstairs two additional rooms ideal for a mother-in-law suite. Currently rented for $3,500 with the potential for a rent increase upon lease renewal. The tenant, operating a Day care home, interested in a long-term lease. The property is being sold as-is, viewings available post mutual agreement The buyer has already initiated the process for subdividing the lot under SR6 zoning. Photographs from a 2022 listing are being
$749,900
4 beds2.5 baths2,740 sq ft0.35 acre (lot)
22904 Military Rd S, Kent, WA 98032
Listing provided by NWMLS as Distributed by MLS Grid
Breathtaking views of the Olympics & Puget Sound await! Live large in this fabulous 5080sq ft home in highly coveted Normandy Park. Large private 17,010 SqFt beautifully landscaped lot w/ mature grounds including many fruit & flowering trees. Enjoy huge 43x104 trex deck to soak in the absolutely incredible views. Unbeatable possibilities w/ 7 bedrooms, 3 bathrooms, multiple entertaining rooms, utility/storage room, and space for days! Take in the stunning views from the enormous family room! Big, beautiful gourmet kitchen, massive laundry room & fantastic primary bedroom w/ ensuite bath. 2 furnaces, 2 H2O heaters, A/C, 3 fireplaces, hot tub & more! Exceptional opp
$1,625,000
7 beds3 baths5,080 sq ft0.39 acre (lot)
18440 4th Ave SW, Normandy Park, WA 98166
Listing provided by NWMLS as Distributed by MLS Grid
Stunning AND Priced Right, This Condo Has it All. Beautiful Renovation in A Super Convenient Location. End Unit on Top Floor is Bright and Sunny with All the Amenities. Sweet Little Patio Space Overlooking Courtyard. Plenty of Room for Entertaining & Overnight Guests. Pool is Just Steps Away. Primary Bedroom w/ 1/2 bath and Lots of Storage. Insta-Hot Water, Easy Care Plank Flooring and Carpeted Bedrooms. Community has 3 pools, Cabana, Gym and Landscaped Paths. Minutes to the Airport, all Highways and Shopping. Just a Few Blocks to Lightrail Station. Could This be Your Next Crash Pad? No Rent Cap!
$318,000
2 beds1.5 baths948 sq ft
3425 S 176th St #266, Seatac, WA 98188
Listing provided by NWMLS as Distributed by MLS Grid
Great top floor 2 bed, 1 bath condo in convenient location. Close to Sea-Tac airport, I-5, Highline College, light rail station and Des Moines Marina. This end unit features a fireplace with custom mantel, raised panel doors and white painted mill work, fresh paint, fully equipped kitchen, new microwave, dining area, new washer and dryer in hallway closet, new water heater, new waterproof LPV Flooring, laminate in br. Vaulted ceiling and large window in the living room bring in amazing light. Don't miss the deck with new indoor/outdoor carpet, mountain view and storage. No rental cap, low HOA dues, water, sewer & garbage included. 1 reserved parking space, lots of guest parking.
$275,000
2 beds1 bath700 sq ft
22700 30th Ave S #305, Des Moines, WA 98198
Listing provided by NWMLS as Distributed by MLS Grid
Opportunity for savvy investors seeking consistent cash flow with low stress tenants & minimal expense on a growing rental market. Occupy one of the units with a low residential loan and earn income on the other 3 units. Quality long-term tenants with month-to-month lease. Amazing 4plex conveniently located near SeaTac International Airport and I-5 with a desirable mix of three 2-bed/1 bath and one 1-bed/1 bath units. All same floorplans except for the 1 bedroom. Well maintained building with updated kitchens, bathrooms & flooring. 8 reserved parking. Coin-op laundry for added income. Rubber sealed rolled on roofing. One inch cedar siding; Walking distance to Angle lake, public
$1,150,000
7 beds4 baths3,780 sq ft8,632 sq ft (lot)
18909 47th Ave S, Seatac, WA 98188
Listing provided by NWMLS as Distributed by MLS Grid
Top floor Corner-End unit. 2 Primary Bedrooms + 1 Additional Bedroom added. Town-home in city close to everything. See-through kitchen/dinning, 2 Primary bedrooms upstairs w/ individual sinks, Jack-n-Jill bath. Upgrades include new plumbing and appliances, new heating thermostats & cooling fans. Turn-key business ready. 1/2 bath on the main floor (Currently 3rd bedroom) Kitchen & separate dinning room. Courtyard setting with sculpted landscaping views from each window, Territorial views from balcony. Complex has 3 Pools, a Gym, 2 Saunas, Sports Court, Extra Storage, Cabana. Easy access to Seatac Airport I-5/405/99 & Light-Rail Station.
$300,000
3 beds1.5 baths1,076 sq ft
3425 S 176th St #238, Seatac, WA 98188
Listing provided by NWMLS as Distributed by MLS Grid
Move in ready, 2 bedroom condo w/ peekaboo Puget Sound views at Newport Village! Newer (1-year) carpet & fresh paint throughout! The spacious living area w/ cozy wood-burning fireplace flows out onto the private deck overlooking green lawns, a perfect extension of your living & entertaining space. Efficient kitchen design w/ open breakfast bar & all appliances included. Primary Bedroom w/ ensuite access & walk-in closet. Washer & dryer in unit, dedicated parking space & private storage conveniently located off deck. Well managed HOA w/ low monthly dues that incl. water, sewer & garbage. No rental cap. Ideal commute, minutes to I-5, Pacific Hwy, Des
$259,900
2 beds1 bath700 sq ft
22700 30th Ave S #206, Des Moines, WA 98198
Listing provided by NWMLS as Distributed by MLS Grid
Full of opportunities, commercial zoning, blank canvas ready to accommodate your vision. 3 bed, 1 bath Rambler with whole separate unit above garage 2 bed 1 bath, w/ separate entry and own kitchen. Live in one unit and rent out the other unit. Corner lot and lots of visibility. Front fully fenced.
$950,000
5 beds2 baths2,080 sq ft7,276 sq ft (lot)
14404 Military St S, Tukwila, WA 98168
Listing provided by NWMLS as Distributed by MLS Grid
Nestled on a generous corner lot in a serene neighborhood, this delightful 3-bedroom, 1-bath home combines classic charm with modern conveniences, making it a perfect sanctuary for first-time homebuyers or investors. As you step inside, you're greeted by a warm and inviting living area, bathed in natural light and offering the perfect setting for relaxing evenings or hosting gatherings. With its blend of comfort, style, and prime location, this house is ready to become your forever home or next investment opportunity. Home also boasts amazing views of the Cascades from the front and an add on porch for entertaining, Don't miss out on the chance to own this gem.
$565,000
3 beds1 bath1,090 sq ft0.28 acre (lot)
18055 Military Rd S, Seatac, WA 98188
Listing provided by NWMLS as Distributed by MLS Grid
Wow! What a beautiful 3 bedroom home with open kitchen concept. Completely remodeled down to studs, everything is new. Special foam insulation under the siding for extra sound proofing. All new insulation inside the walls. New windows, doors, drywall, siding, roof, gutters, mostly new electrical, completely new kitchen & bathroom. New concrete driveway in the front. There is so much more that was done to the house. .. must see it in person. Lots of space on the side of the house for a garage, carport, additional parking or RV parking. 220V outlet on the side of the house for Tesla charger or RV hookup.
$539,900
3 beds1 bath900 sq ft6,450 sq ft (lot)
20638 13th Ave S, Seatac, WA 98198
Listing provided by NWMLS as Distributed by MLS Grid
Experience the leisure lifestyle, of waterfront living, on the west side of Angle Lake. 40 ft. of no bank pea gravel beachfront. 80 ft dock suitable for boat tie up, room for lounging, and wonderful swimming area. Eastern exposure offers maximized natural light, in this designer NW Contemporary. Open great room concept on main level for entertaining. Custom lighting & design features throughout. 3 gas fireplaces within the home make it cozy during those fall & winter months. Extensive exterior areas for entertaining year around. Property is landscaped and configured to be low maintenance & very private. Two car garage with double carport. Located down a secluded driveway.
$1,639,000
3 beds2 baths3,010 sq ft0.23 acre (lot)
3750 S 188th Ln, Seatac, WA 98188
Listing provided by NWMLS as Distributed by MLS Grid
Three bedroom, two bath condo, conveniently located close to shopping, dining and schools. Functional kitchen complete with bar and dining room. Brand new vinyl flooring, fresh paint, tile in both bathrooms was recently replaced. Great for investors since there's NO RENTAL CAP!
$315,000
3 beds2 baths1,024 sq ft
22810 30th Ave Unit A203, Des Moines, WA 98198
Listing provided by NWMLS as Distributed by MLS Grid
Charming home situated in the beautiful and tranquil Bow Lake 55+ gated community. This affordable residence offers 2 bedrooms, 1 bathroom, generous extra space, and wheelchair ramp accessibility. The home has a nice kitchen with bar and dining room. Living room feels extra spacious. Notable features include a shaded patio, covered front porch, gardener's greenhouse, window awnings, brand new, stackable washer & dryer, and a covered carport with storage sheds. 2 new living room windows were recently installed. The community boasts a renovated clubhouse, relaxing swimming pool, hot tub/spa, exercise room, walking trails, woodworking shop for the hobbyist, and additional amenities. Walk
$53,700
2 beds1 bath836 sq ft2,400 sq ft (lot)
3239 S 182nd St #177, Seatac, WA 98188
Listing provided by NWMLS as Distributed by MLS Grid
Location, Location, Location! If you have been looking for a property to generate income this, is it. This home is on nearly 1/3 acre and allows you easy access to Seattle, Tacoma, Sea tac Airport, Light Rail, Southcenter Mall and so much more. Bring your tools to fix and flip lower level to a potential side income opportunity. New roof!! Main floor has 2 Bedroom that it can be converted to 3 bedrooms again. Lower level 3 bedrooms 1 Bath and a second kitchen Bring your tools to fix and flip lower level to a potential side income opportunity. Picture you're self, seating and relaxing on the deck!
$823,000
5 beds2.5 baths2,330 sq ft0.30 acre (lot)
15819 42nd Ave S, Tukwila, WA 98188
Listing provided by NWMLS as Distributed by MLS Grid
BRAND NEW SINGLEWIDE FOR SALE at Bow Lake (55+) Be the first to live in this beautiful Brand New 2022 Skyline singlewide. 2 bedrooms / 1 bathroom at 728 sq. ft. The home has been updated with gorgeous block skirting. Also featured: A new carport (on the way), W/ D hookups, stainless appliances, and a new exterior storage shed. Bow Lake is a wonderful community with amazing amenities including a pool and secured access! Come make it yours!
$123,500
2 beds1 bath728 sq ft
3221 S 182nd Pl #217, Seatac, WA 98188
Listing provided by NWMLS as Distributed by MLS Grid
BRAND NEW SINGLEWIDE FOR SALE at Bow Lake (55+) Be the first to live in this beautiful Brand New 2023 Karsten singlewide. 2 bedrooms / 1 bathroom at 648 sq. ft. The home has been updated with gorgeous block skirting. Also featured: A new carport (on the way), W/ D hookups, stainless appliances, and a new exterior storage shed. Bow Lake is a wonderful community with amazing amenities including a pool and secured access! Come make it yours!
$110,000
2 beds1 bath648 sq ft
3255 S 181st St #97, Seatac, WA 98188
Listing provided by NWMLS as Distributed by MLS Grid
BRAND NEW SINGLEWIDE FOR SALE at Bow Lake (55+) Be the first to live in this beautiful Brand New 2023 Karsten singlewide. 1 bedroom / 1 bathroom at 426 sq. ft. The home has been updated with gorgeous block skirting. Also featured: A new carport (on the way), W/ D hookups, stainless appliances, and a new exterior storage shed. Bow Lake is a wonderful community with amazing amenities including a pool and secured access! Come make it yours!
$72,500
1 bed1 bath426 sq ft
3446 S 181st St #90, Seatac, WA 98188
Listing provided by NWMLS as Distributed by MLS Grid
NEW double wide for sale at Bow Lake (55+). Be the first to live in this spacious 2023 Skyline: 3 Bed / 2 Bath / 1,344 sq. ft. The home is updated with new block skirting, new carport, and new storage shed. Inside you will find a kitchen island, plenty of cabinet space, new appliances, and a separate area for laundry. The community amenities are unmatched. Included amenities: community waterfront, pool, workout room, media room, library, billiards, and more! This wonderful community has a lot to offer; conveniently located near the airport and close to everything SeaTac has to offer. Come make it yours!
$229,500
3 beds2 baths1,344 sq ft
18117 31st Ave S #314, Seatac, WA 98188
Listing provided by NWMLS as Distributed by MLS Grid
BRAND NEW double wide for sale at Bow Lake (55+). Be the first to live in this spacious 2023 Skyline: 3 Bed / 2 Bath / 1,248 sq. ft. The home comes with a new carport, an exterior storage shed, brand new block skirting, and a kitchen island. Inside you will find large windows, built in storage, new appliances, and a separate area for laundry. The community amenities are unmatched. Included amenities: community waterfront, pool, workout room, media room, library, billiards, and more! This wonderful community has a lot to offer; conveniently located near the airport and close to everything SeaTac has to offer. Come make it yours!
$218,500
3 beds2 baths1,248 sq ft
3623 S 182nd St #482, Seatac, WA 98188
Listing provided by NWMLS as Distributed by MLS Grid
This four bedroom, three bathroom custom-built home is located in a quiet and yet accessible neighborhood. This meticulously maintained home provides luxurious living - from soaring ceilings to granite/hardwood flooring and a gourmet kitchen with stainless appliances. The windows provide a look out to a wooded area with a peek-a-boo view of Angle Lake. The private backyard comes with arbor trellis and a fully fenced yard. The home is easily accessible by I-5 for commuters to Seattle, Bellevue, Tacoma, and more!
$1,225,000
4 beds3.5 baths3,820 sq ft8,964 sq ft (lot)
4559 S 190TH Ln, Seatac, WA 98188
Listing provided by NWMLS as Distributed by MLS Grid
1967 Singlewide for sale at Bow Lake (55+) Come see the potential for yourself! 2 Bed / 1 Bath / 720 Sq. Ft. All appliances are included with this home including the washer and dryer. This home features a covered deck, 2 exterior storage sheds, a carport, and a wash area near the washer/dryer. Bow Lake is conveniently located and close to everything SeaTac has to offer. The community is loaded with unmatched amenities including: secured access/gated community, a large clubhouse with an exercise room, a media room, a game room, and a pool! Come make it yours!
$30,000
2 beds1 bath720 sq ft
18227 36th Ave S #409, Seatac, WA 98188
Listing provided by NWMLS as Distributed by MLS Grid
BRAND NEW double wide for sale at Bow Lake (55+). Be the first to live in this spacious 2022 Karsten: 3 Bed / 2 Bath / 1,248 sq. ft. The home comes with a new carport, an exterior storage shed, brand new block skirting, and a kitchen island. Inside you will find large windows, built in storage, new appliances, and a separate area for laundry. The community amenities are unmatched. Included amenities: community waterfront, pool, workout room, media room, library, billiards, and more! This wonderful community has a lot to offer; conveniently located near the airport and close to everything SeaTac has to offer. Come make it yours!
$218,500
3 beds2 baths1,248 sq ft
3615 S 182nd St #480, Seatac, WA 98188
Listing provided by NWMLS as Distributed by MLS Grid
BRAND NEW SINGLEWIDE FOR SALE at Bow Lake (55+) Be the first to live in this beautiful Brand New 2023 Skyline singlewide. 2 bedrooms / 1 bathroom at 728 sq. ft. The home has been updated with gorgeous block skirting. Also featured: A new carport, W/ D hookups, stainless appliances, and a new exterior storage shed. Bow Lake is a wonderful community with amazing amenities including a pool and secured access! Come make it yours!
$123,500
2 beds1 bath728 sq ft
18215 35TH Pl S #371, Seatac, WA 98188
Listing provided by NWMLS as Distributed by MLS Grid
Based on information submitted to the MLS GRID as of Sat Apr 27 2024. All data is obtained from various sources and may not have been verified by broker or MLS GRID. Supplied Open House Information is subject to change without notice. All information should be independently reviewed and verified for accuracy. Properties may or may not be listed by the office/agent presenting the information. Some IDX listings have been excluded from this website.
This area's enrollment policy is not based solely on geography. Please check the school district website for more information.
Elementary schools
Middle schools
High schools
GreatSchools Summary Rating
6/10
McMicken Heights Elementary School
Public, PreK-5
4/10
Des Moines Elementary School
Public, PreK-5
4/10
Midway Elementary School
Public, PreK-5
3/10
Bow Lake Elementary School
Public, PreK-5
3/10
Cedarhurst Elementary School
Public, PreK-5
Only showing 5 of
9 elementary schools.
School data is provided by GreatSchools, a nonprofit organization. Redfin recommends buyers and renters use GreatSchools information and ratings as a first step, and conduct their own investigation to determine their desired schools or school districts, including by contacting and visiting the schools themselves.Redfin does not endorse or guarantee this information. School service boundaries are intended to be used as a reference only; they may change and are not guaranteed to be accurate. To verify school enrollment eligibility, contact the school district directly.
Homes for sale in SeaTac have a median listing price of $540K. Some of these homes are Hot Homes, meaning they're likely to sell quickly.
What are some of the most popular neighborhoods in SeaTac?
Popular neighborhoods include Central Des Moines, North Hill, SeaTac City Center, Downtown Burien, Tukwila Hill, Highline, Sunnydale, Seattle-Tacoma International Airport, Angle Lake, and McMicken.
How often does Redfin update their new listings?
Most of our new listings in SeaTac are updated every 5 minutes so you can see new homes as soon as they come on the market. Learn more
What is transportation like in SeaTac?
SeaTac, Washington boasts a robust transportation system, making it easy for residents to get around using a variety of methods. The city is served by several public transportation options, including King County Metro Transit buses and the Sound Transit Light Rail. For those who prefer to drive, traffic levels can vary, but generally, the city experiences typical rush hour congestion. Additionally, SeaTac is conveniently located near major highways such as Interstate 5 and State Route 518, providing easy access for car travel. Learn more on our SeaTac city guide.
What types of properties are available in SeaTac?
SeaTac, Washington offers a variety of single-family home types, including ranch-style homes, split-level homes, and contemporary homes. These homes can be found throughout the city, with ranch-style homes predominantly located in the southern neighborhoods, split-level homes scattered throughout the city, and contemporary homes primarily situated in the newer developments. Most properties feature 3-4 bedrooms and were built within the last 20 years. To explore different property types for sale in SeaTac, Washington, use the 'Home type' filter located above the active listings. Customize your search by selecting options like single-family homes, condos, townhomes, and more.
What is life like in SeaTac?
SeaTac, Washington offers a unique living experience with its diverse range of neighborhoods and vibrant community. The landscape is characterized by a stunning blend of urban and natural elements, boasting picturesque views of mountains and water bodies. The weather in SeaTac is known for its mild winters and warm summers, providing a comfortable year-round climate. The city presents a variety of job opportunities across various industries, ensuring a dynamic and thriving economy. Residents can enjoy a plethora of recreational activities, including outdoor adventures, cultural events, and a wide array of dining and shopping options.
What are the schools and amenities like in SeaTac?
SeaTac, Washington offers a variety of public amenities for its residents. The city is home to numerous restaurants, serving a wide range of cuisines to satisfy diverse culinary tastes. For outdoor enthusiasts, there are several parks available for leisure and recreational activities. Essential shopping needs can be met at the local grocery stores scattered throughout the city. Other amenities include public libraries, fitness centers, and community centers, all contributing to a comfortable and convenient lifestyle in SeaTac.
In the past month, 15 homes have been sold in SeaTac. In addition to houses in SeaTac, there were also 9 condos, 1 townhouse, and 1 multi-family unit for sale in SeaTac last month. SeaTac is a minimally walkable city in King County with a Walk Score of 38. SeaTac is home to approximately 27,226 people and 24,645 jobs. Find your dream home in SeaTac using the tools above. Use filters to narrow your search by price, square feet, beds, and baths to find homes that fit your criteria. Our top-rated real estate agents in SeaTac are local experts and are ready to answer your questions about properties, neighborhoods, schools, and the newest listings for sale in SeaTac. Our SeaTac real estate stats and trends will give you more information about home buying and selling trends in SeaTac. If you're looking to sell your home in the SeaTac area, our listing agents can help you get the best price. Redfin is redefining real estate and the home buying process in SeaTac with industry-leading technology, full-service agents, and lower fees that provide a better value for Redfin buyers and sellers.


 REDFIN IS COMMITTED TO AND ABIDES BY THE FAIR HOUSING ACT AND EQUAL OPPORTUNITY ACT. READ REDFIN'S FAIR HOUSING POLICY AND THE NEW YORK STATE FAIR HOUSING NOTICE.
 United States
 Canada