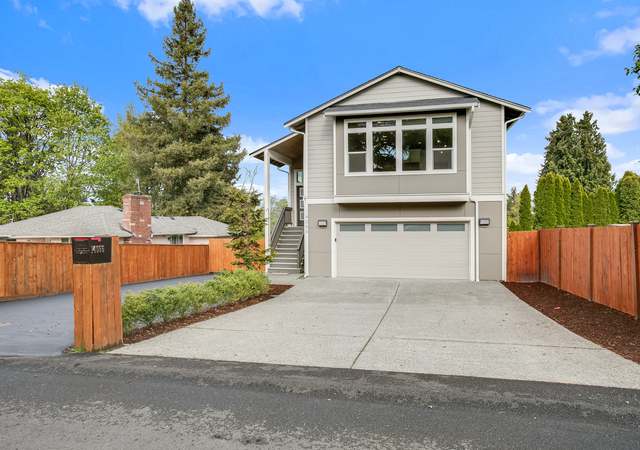
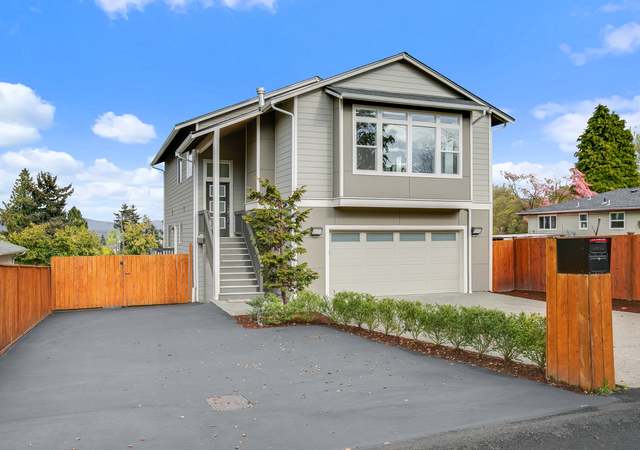
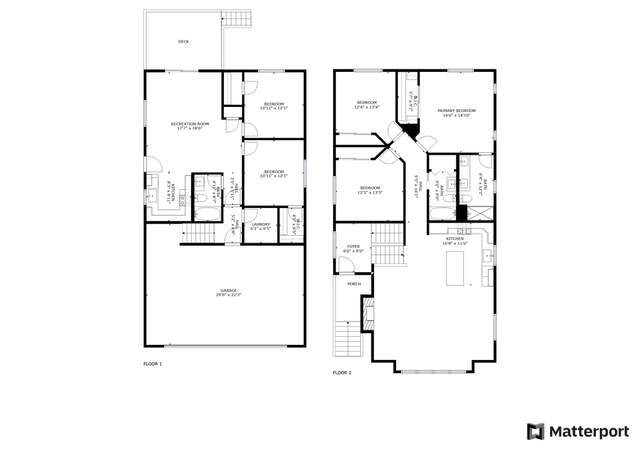
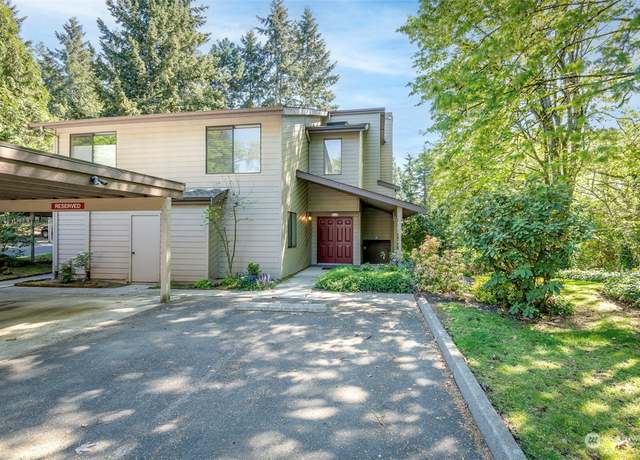
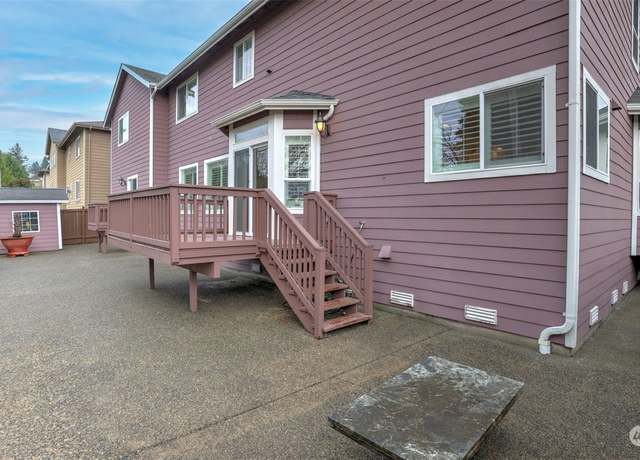
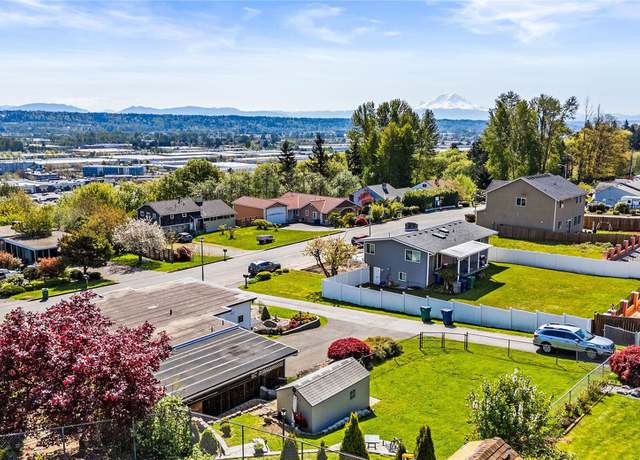
This residence features two bedrooms downstairs and three upstairs, including a true primary suite. Each level provides its own distinct living space, ensuring privacy and comfort for all occupants. Serene territorial views, perfect for relaxation and outdoor gatherings. Fully fenced, offering security and privacy, while the expansive yard provides ample space for outdoor activities and gardening. 2-car garage, a long driveway, and tons of extra parking. Minutes from the lite rail, bus routes, SeaTac Airport, major arterials, and amenities and necessities. Boasting two separate entrances, kitchens, living areas, utility rooms, and great rooms, this home offers endless possibilities for mult
1/31
$949,990
5 beds3 baths2,540 sq ft9,993 sq ft (lot)
14066 35th Ave S, Tukwila, WA 98168
Listing provided by NWMLS as Distributed by MLS Grid
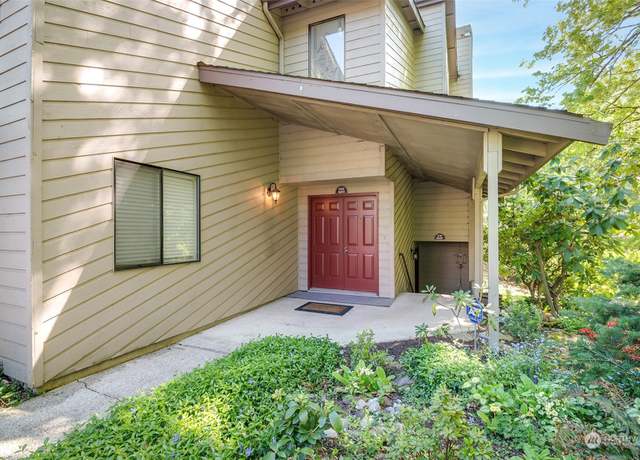
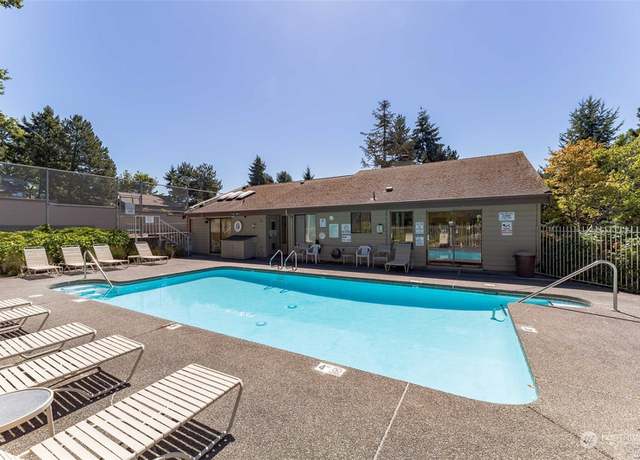
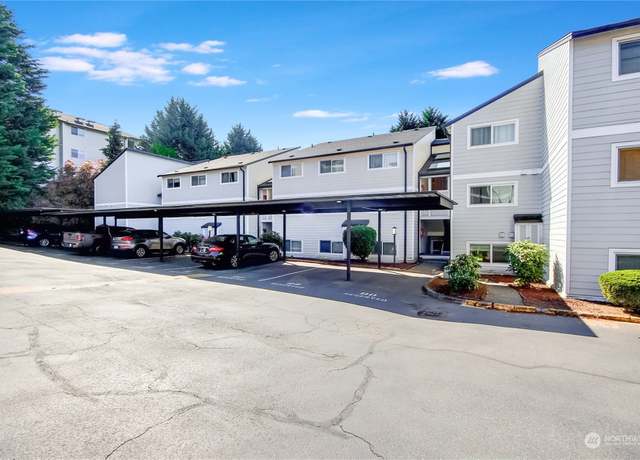
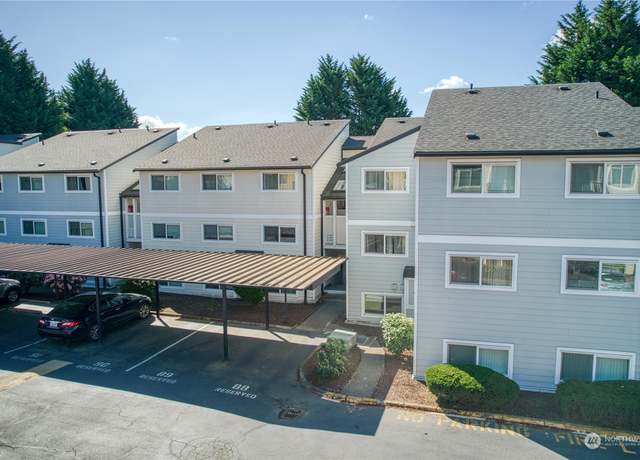
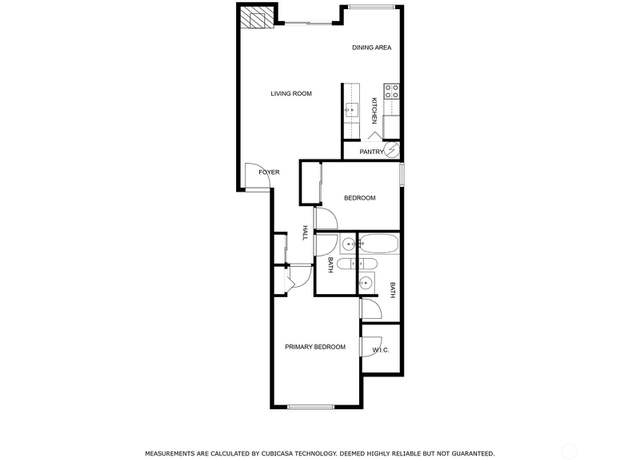
Nestled among lush greenery, this inviting 2-bedroom condo promises a serene retreat. The spacious main floor boasts a seamless flow from the living room to the kitchen & dining, extending to a tranquil deck overlooking the scenic woods. A charming hallway bathroom with a spacious walk-in shower serves the 2nd bedroom, while upstairs, the primary suite awaits with its luxurious amenities – a private bathroom featuring a soothing soaking tub, double closets, & dual sinks. Indulge in the amenities of Sunwood Condominiums, including an outdoor pool, tennis courts, a cabana, jacuzzi & more. Conveniently located near schools, shopping, & major freeways for easy access
1/33
$368,950
2 beds2 baths1,217 sq ft11.53 acres (lot)
15111 Sunwood Blvd Unit II22, Seattle, WA 98188
Listing provided by NWMLS as Distributed by MLS Grid
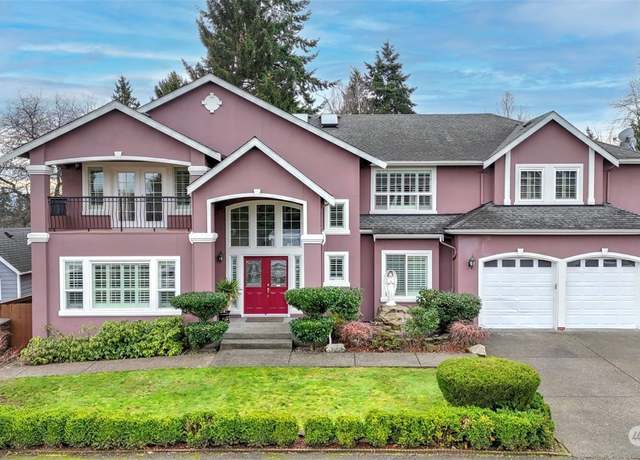
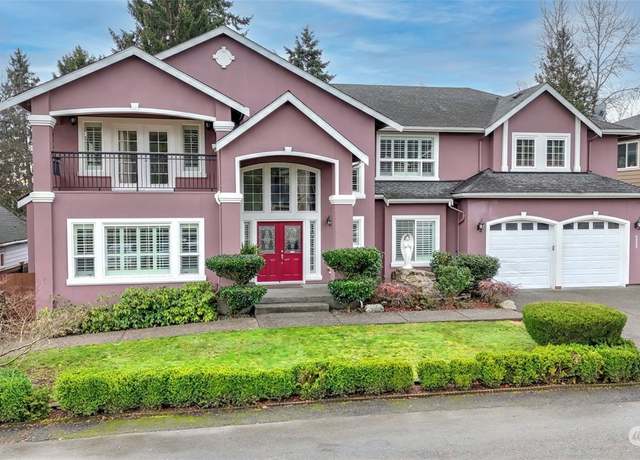
Welcome to beautiful 2006 custom built home w/ territorial views of Kent Valley & mountains. The home offers versatile layout to accommodate all needs and it is embodiment of sophistication, practically, & warmth. The gourmet kitchen, featuring stainless steel appliances, granite countertops, & walk-in pantry. Beautiful crown molding & millwork throughout. Windows are installed w/ custom California shutters. Hardwood floor. Main floor consist of 2 bedrooms, a full bath. Upper floor features large master en-suite bedroom, large walk-in closet, & private balcony. 4 additional large bedrooms, each w/ walk-in closet. A full bathroom & laundry room. Low maintenan
1/40
$1,160,000
6 beds3 baths3,890 sq ft7,500 sq ft (lot)
5225 S 170th Ln, Seatac, WA 98188
Listing provided by NWMLS as Distributed by MLS Grid
Welcome to your new home at the desirable Southcenter View Condo, nestled in the vibrant heart of Tukwila. This appealing ground floor unit is perfectly designed for comfort & convenience, featuring 2 spacious bedrooms, 1.5 bathrooms, Enjoy the ease of living with less stairs & direct access to your unit, making everyday life a breeze. Offers 1 Reserve Parking. This condo combines accessibility, convenience, and tranquility, making it an ideal choice for anyone looking for a serene yet connected living experience. New Carpet, Tile Flooring, Updated Fireplace, New Paint. HOA covers W/ S/G No Rental Cap! Don’t miss out on this opportunity. Experience the best of Tukwila livi
1/33
$300,000
2 beds1.5 baths901 sq ft
15280 Macadam Rd S Unit E106, Tukwila, WA 98188
Listing provided by NWMLS as Distributed by MLS Grid
Don't Miss this Unique architecture style Home!! 3-bedroom, 2-bathroom Upstairs; Downstairs basement can be easily converted into a studio or Mother in-law! Plenty of natural light. Floor to ceiling windows & Amazing original antique fixtures thru all the House. Large, covered carport for motorcycle, boat, or RV. 1 car garage can be used as a shop! or you can just convert into 3 car garage. 2 Decks! Front deck with views of valley and mountains; Back deck is covered for year-round enjoyment. Large patio perfect for entertaining and gardening Great location closed to shopping/dining as well as freeway access. Nice quiet neighborhood.
1/40
$630,000
3 beds2 baths1,540 sq ft9,819 sq ft (lot)
16813 53Rd Ave S, Tukwila, WA 98188
Listing provided by NWMLS as Distributed by MLS Grid
Welcome to this spacious 2470 sq ft 3 story home with lower entry and garage on a corner lot. The main floor features open concept with gas fireplace, Quartz slab countertops, island with bar eating area, custom cabinets, Stainless steel appliances, gas range and chef inspired kitchen. Outside patio area for entertaining and central ac installed to cool off in the summer. 5 large Bedrooms with 1 bedroom on main floor and 4 upstairs. Primary Bedroom with on suite and Cascade views. Separate laundry room, efficient heating, led lights, sound resistant windows and just minutes to Seattle, SeaTac, I-5 and 405.
$799,000
5 beds2.5 baths2,470 sq ft3,497 sq ft (lot)
12001 27th Ct S, Burien, WA 98168
Listing provided by NWMLS as Distributed by MLS Grid
The Southard is an environmentally sustainable neighborhood developed by Homestead Community Land Trust. Perfect for people who want a climate conscious lifestyle in a thoughtful community. This four-bedroom cottage-style home is designed for beauty, functionality, and energy efficiency. Built to a Net-Zero energy standard they include solar panels for onsite energy production, EV Charging Station and nearby light rail station for climate-conscious travel. Pea-patch community garden space, salmon-safe stormwater systems and educational installations. With I5, highways 518 & 509 less than 5 minutes away, you have direct access to amenities and all points in the region. This unique home
$645,000
4 beds3 baths1,437 sq ft
13813 32nd Ln S, Tukwila, WA 98168
Listing provided by NWMLS as Distributed by MLS Grid
The Southard is an environmentally sustainable neighborhood developed by Homestead Community Land Trust. Perfect for people who want a climate conscious lifestyle in a thoughtful community. This three-bedroom cottage-style home is designed for beauty, functionality, and energy efficiency. Built to a Net-Zero energy standard they include solar panels for onsite energy production, EV Charging Station and nearby light rail station for climate-conscious travel. Pea-patch community garden space, salmon-safe stormwater systems and educational installations. With I5, highways 518 & 509 less than 5 minutes away, you have direct access to amenities and all points in the region. This unique hom
$645,000
4 beds3 baths1,437 sq ft
13815 32nd Ln S, Tukwila, WA 98168
Listing provided by NWMLS as Distributed by MLS Grid
The Southard is an environmentally sustainable neighborhood developed by Homestead Community Land Trust. Perfect for people who want a climate conscious lifestyle in a thoughtful community. This four-bedroom cottage-style home is designed for beauty, functionality, and energy efficiency. Built to a Net-Zero energy standard they include solar panels for onsite energy production, EV Charging Station and nearby light rail station for climate-conscious travel. Pea-patch community garden space, salmon-safe stormwater systems and educational installations. With I5, highways 518 & 509 less than 5 minutes away, you have direct access to amenities and all points in the region. This unique home
$645,000
4 beds3 baths1,437 sq ft
13847 32nd Ln S, Tukwila, WA 98168
Listing provided by NWMLS as Distributed by MLS Grid
The Southard is an environmentally sustainable neighborhood developed by Homestead Community Land Trust. Perfect for people who want a climate conscious lifestyle in a thoughtful community. This three-bedroom cottage-style home is designed for beauty, functionality and energy efficiency. Built to a Net-Zero energy standard they include solar panels for onsite energy production, EV Charging Station and nearby light rail station for climate-conscious travel. Pea-patch community garden space, salmon-safe stormwater systems and educational installations. With I5, highways 518 & 509 less than 5 minutes away, you have direct access to amenities and all points in the region. This unique home
$627,000
3 beds2 baths1,407 sq ft
13831 32nd Ln S, Tukwila, WA 98168
Listing provided by NWMLS as Distributed by MLS Grid
The Southard is an environmentally sustainable neighborhood developed by Homestead Community Land Trust. Perfect for people who want a climate conscious lifestyle in a thoughtful community. This four-bedroom cottage-style home is designed for beauty, functionality, and energy efficiency. Built to a Net-Zero energy standard they include solar panels for onsite energy production, EV Charging Station and nearby light rail station for climate-conscious travel. Pea-patch community garden space, salmon-safe stormwater systems and educational installations. With I5, highways 518 & 509 less than 5 minutes away, you have direct access to amenities and all points in the region. This unique home
$665,000
4 beds3 baths1,408 sq ft
13839 32nd Ln S, Tukwila, WA 98168
Listing provided by NWMLS as Distributed by MLS Grid
Development site to include house at 4504 and the right to boundry line adjust into the parcel to the east, additional sq ft for a total of 13000 sq ft (current zoning 6500 sq ft per lot). Check with City of Tukwila about future comprehensive plan to increase density. Property faces the beautiful and new Tukwila park and Community Center. House is rentable as-is. This is a long-term play for a savvy investor or small site developer.
$699,999
3 beds2 baths1,720 sq ft0.29 acre (lot)
4504 S 124th St, Seattle, WA 98178
Listing provided by NWMLS as Distributed by MLS Grid
This beautiful SeaTac home boasts 1,860 sqft of living space on a generous 7,866 sq ft lot, showcasing a total of 6 bedrooms and 2.5 bathrooms. The main floor welcomes you with 4 spacious bedrooms and an open kitchen, providing ample space for rest and relaxation. Downstairs, the fully finished basement features a separate entrance, offering 2 additional bedrooms, a kitchen, and a full bathroom - ideal for creating a separate living area or generating extra rental income. Don't miss out on this rare opportunity to own a piece of paradise in SeaTac!
$629,000
6 beds2.5 baths1,860 sq ft7,866 sq ft (lot)
16636 51st Ave S, Seatac, WA 98188
Listing provided by NWMLS as Distributed by MLS Grid
Introducing a move-in ready home, conveniently located just 15 minutes from downtown Seattle. Enjoy the benefits of a new water heater, a convenient one-car garage + 6 parking spaces in driveway, fresh paint throughout, and newer washer/dryer. Rest easy with the sound-proofing windows. Outside, a shed in the backyard offers extra storage. Plus, there's no HOA to worry about. Don't miss the opportunity to own this exceptional Tukwila residence, offering comfort, and style. Great investment rental property opportunity! Conveniently located near the Tukwila Community Center, grocery stores, restaurants, and the Green River Trail!
$550,000
3 beds2.5 baths1,190 sq ft3,000 sq ft (lot)
12229 47th Ave S, Tukwila, WA 98178
Listing provided by NWMLS as Distributed by MLS Grid
This home has dramatic views of Mt Rainier and the Kent Valley from the living room, primary bedroom and lanai. Convenient location to Southcenter, I-5 and 405. The kitchen has slab granite counters, stainless steel appliances, ceramic tile floors, new interior paint and new carpet. The home has a spacious bath with direct access from the primary bedroom and living space. Enjoy the comfort of a gas fireplace. There's plenty of living space without sacrificing bedroom space. This unit has a detached garage with lots of storage in the accessible attic space.
$325,000
2 beds1 bath915 sq ft
15345 Sunwood Blvd Unit D203, Tukwila, WA 98188
Listing provided by NWMLS as Distributed by MLS Grid
Welcome to this meticulously maintained home nestled in a quiet Tukwila neighborhood with convenient access to the freeway, airport, and shopping at the nearby mall. Inside, enjoy multiple spacious living areas with a cozy family room right off the kitchen and very generous bedrooms, perfect for gatherings and everyday living. Step outside to a beautifully landscaped backyard oasis, offering privacy and low maintenance. Park with ease in the generous 2-car garage, providing ample storage space. Experience the best of suburban living with easy access to amenities and major transportation routes, ideal for those seeking a retreat from the bustle of city life. Don't miss the chance to make thi
$680,000
3 beds2.5 baths1,910 sq ft4,521 sq ft (lot)
4287 S 137th St, Tukwila, WA 98168
Listing provided by NWMLS as Distributed by MLS Grid
Light and bright south facing condo is convenient to Seattle, Bellevue, and SeaTac. This 2 bed/2 bath condo has a large living room and generously proportioned bedrooms. The home has been impeccably maintained. This home boasts engineered hardwood floors, in unit washer/dryer, and sizable deck with storage room. Enjoy summers out by the pool, playing tennis or use of the club house. This home is perfect for a roommate or work from home lifestyle.
$349,900
2 beds2 baths1,059 sq ft
15175 Sunwood Blvd Unit DD21, Tukwila, WA 98188
Listing provided by NWMLS as Distributed by MLS Grid
The crown jewel of the neighborhood has finally hit the market, come check it out before it's gone! Fully remodeled with west facing views grant this unit incredible light, sunset views, peace, and quiet AND its own parking spot! Get in now before prices skyrocket with all the improvements they are making to the complex like new hallways, new plumbing, new office! This move-in ready condo is the best value you'll find anywhere in the area, it comes with its own parking spot and incredible privacy. It's convenient location allows you to hop on either highway in a couple of minutes and you'll never run out of stores to go shopping with Southcenter Mal just a couple of minutes away as well. En
$299,000
2 beds1 bath913 sq ft
15152 65th Ave S #810, Tukwila, WA 98188
Listing provided by NWMLS as Distributed by MLS Grid
Updated kitchen, Bathroom, the entire interior is updated. New luxury vinyl plank. New countertop. New refrigerator, New oven/range. New cabinet and stainless steel hood. New washer & dryer. Close to everything. Minutes to South center Mall. Minutes to airport. Perfect for 1st time home buyer. Must see to appreciate!
$393,999
1 bed1 bath550 sq ft5,040 sq ft (lot)
12501 50th Pl S, Seattle, WA 98178
Listing provided by NWMLS as Distributed by MLS Grid
Welcome to this charming 2 bed/2 bath condo, nestled in a vibrant, diverse community. Featuring a practical balcony and an included carport, this home blends convenience with the simplicity of condo living. Well-maintained and cared for, this condo promises a comfortable living space that's waiting for its next chapter with you. Location is everything, & this condo delivers. Enjoy the convenience of being a short walk from the light rail, minutes from the airport & near the freeway. Living close to essential transportation links, will make your daily commute or weekend explorations a breeze. Perfect for the traveler or anyone looking to navigate the city with ease. City living as
$315,000
2 beds2 baths904 sq ft
15625 42nd Ave S #31, Tukwila, WA 98188
Listing provided by NWMLS as Distributed by MLS Grid
Exciting investment opportunity! This 6-bed, 3-bath home in Tukwila boasts a prime location, ideal for investors and first-time homebuyers alike. With options for dual-family living or rental income, the property features a two-car garage and a secluded backyard, ready for your personal touch to craft your urban retreat. Update this home to embrace a modern aesthetic. Conveniently located near I-5, Hwy 599, Southcenter shopping center, and I-405, with Riverton Park just moments away. Don't miss out on the chance to turn this property into your dream home!
$759,750
6 beds3 baths3,780 sq ft0.26 acre (lot)
4021 S 128th, Tukwila, WA 98168
Listing provided by NWMLS as Distributed by MLS Grid
Prime development potential in Riverton Area! With NCC zoning permitting multi-family, mixed-use, and commercial ventures, this property is ideal for owner/users or developers. Comprising 2 tax parcels with lot sizes of 0.344 acres and 0.239 acres, the property is currently tenant-occupied on a month-to-month basis, providing flexibility for immediate use or redevelopment. Current monthly rental income stands at $2,500. Mins to freeway and shops. Don't miss the great investment opportunity!
$950,000
3 beds2 baths1,270 sq ft0.58 acre (lot)
12909 E Marginal Way S, Tukwila, WA 98168
Listing provided by NWMLS as Distributed by MLS Grid
Full of opportunities, commercial zoning, blank canvas ready to accommodate your vision. 3 bed, 1 bath Rambler with whole separate unit above garage 2 bed 1 bath, w/ separate entry and own kitchen. Live in one unit and rent out the other unit. Corner lot and lots of visibility. Front fully fenced.
$950,000
5 beds2 baths2,080 sq ft7,276 sq ft (lot)
14404 Military St S, Tukwila, WA 98168
Listing provided by NWMLS as Distributed by MLS Grid
Location, Location, Location! If you have been looking for a property to generate income this, is it. This home is on nearly 1/3 acre and allows you easy access to Seattle, Tacoma, Sea tac Airport, Light Rail, Southcenter Mall and so much more. Bring your tools to fix and flip lower level to a potential side income opportunity. New roof!! Main floor has 2 Bedroom that it can be converted to 3 bedrooms again. Lower level 3 bedrooms 1 Bath and a second kitchen Bring your tools to fix and flip lower level to a potential side income opportunity. Picture you're self, seating and relaxing on the deck!
$823,000
5 beds2.5 baths2,330 sq ft0.30 acre (lot)
15819 42nd Ave S, Tukwila, WA 98188
Listing provided by NWMLS as Distributed by MLS Grid
One of a kind New Construction 4,525 sq ft home with 6 bedrooms and 4 bathrooms tucked away on a secluded dead-end street. Home is located on a 16,658 sq ft lot and has a 1,200 sq ft separate ADU with potential rental income. The 3-story home has a Great Room, Dining Room, Home Office, Gourmet Kitchen with Snack bar, Quartz Counters, Stainless Steel Appliances, with a Butler's Pantry. The Master Suite features a huge walk-in closet with a Dressing Room, and Master Bathroom with Freestanding shower, separate Soaking Tub and Vanities in quartz. Main level also has a large Leisure Room for entertainment. 2 Car garage on lower level. Home is currently under construction so there is an opportuni
$1,569,950
6 beds4 baths4,525 sq ft0.38 acre (lot)
14737 56th Ave S, Tukwila, WA 98168
Listing provided by NWMLS as Distributed by MLS Grid
Min to I5, I405 and South Center Mall. End unit with loads of light. Two garden windows with window ledge seating. Open and spacious dining and living room. Wood burning fireplace. Sliding glass door out to private deck with woodsy, territorial view. Master large for oversized furniture. Spacious closet and good sized 3/4bath. Main bath with large tub. Second bedroom is sized nicely as a bedroom or office. Oval kitchen has lots of cabinets and counter space. Full sized W/ D. Complex offers sport court, pool, sauna, community room,
$339,000
2 beds2 baths1,092 sq ft
15278 Sunwood Blvd Unit C24, Tukwila, WA 98188
Listing provided by NWMLS as Distributed by MLS Grid
Location, Privacy & move in ready! This Rambler sits on a 1/2 Acre Lot, welcoming entry with vaulted ceilings, freshly updated throughout, from the Kitchen, to all new appliances, new laminate flooring, carpets, fully renovated stylish bathrooms! Nice size covered deck off living room to enjoy year round. Great location at the end of a private road, yet close to everything. Plenty of room to park all your toys, RV, boat, no HOA! Quick access to freeways, light rail, shopping, schools. Extra large crawlspace, access door behind house could be finished to add additional storage space.
$599,000
3 beds2 baths1,090 sq ft0.55 acre (lot)
4627 S 140th St, Tukwila, WA 98168
Listing provided by NWMLS as Distributed by MLS Grid
Level flat property with no critical areas or wetlands. Dynamic Macadam Rd Location. All utilities (water, sewer, electricity) present. Excellent location near South Center commercial zone, and Interstate 5 and 405. Plenty of street frontage. No HOA. No CCR's. If you're one of those buyers looking for a site for a modestly sized home you'll find this property an outstanding candidate for what you have in mind. Tax ID#7661600185.
$49,000
— beds— baths3,900 sq ft (lot)
15015 Macadam Rd S, Tukwila, WA 98188
Listing provided by NWMLS as Distributed by MLS Grid
Don't miss this nearly a 1/2 acre lot in a Low Density Residential neighborhood. Conveniently located near I-5. Close to Southcenter, Boeing and Tukwila Light Rail Station. Located in a developing area that's growing fast and thriving! Buildable lot on a dead end street that's full of potential. Buyer and buyer's agent to conduct their own due diligence.
$150,000
— beds— baths0.42 acre (lot)
4700 S 109th St, Tukwila, WA 98178
Listing provided by NWMLS as Distributed by MLS Grid
Tukwila - Shy of 1 Acre parcel in Tukwila on private street. Build your home, subdivide or hold onto for an investment. Easy access to Light Rail, Sea-Tac International Airport, The Sounder and Metro Bus lines. City water, sewer, gas & electricity available in the street. Neighborhood homes $800+ range. Must have confirmed appt.
$300,000
— beds— baths0.90 acre (lot)
48 XX S 150 St, Tukwila, WA 98168
Listing provided by NWMLS as Distributed by MLS Grid
Prime LDR-zoned location near Seattle and Southcenter. Convenient access, close to amenities, with plenty of developing real estate in a thriving and growing area. Ideal for building your dream home, holding for the future or potential development. 2 separate parcels, each with 10,530 square feet. Second parcel # is 687420-0416. Buyer and agent to conduct their own due diligence.
$170,000
— beds— baths0.48 acre (lot)
123 47th Ave S, Seattle, WA 98178
Listing provided by NWMLS as Distributed by MLS Grid
Build your custom dream home in the McMicken Heights neighborhood where the homes are nice, the street is quiet, and the views are great! Easy access to all amenities including SouthCenter Mall and SeaTac Airport. Seller has home building and floor plans available. Water/Sewer and Electricity on site and gas available in street.
$179,000
— beds— baths0.25 acre (lot)
53 XX Slade Way, Tukwila, WA 98168
Listing provided by NWMLS as Distributed by MLS Grid
This sprawling vacant lot offers an unparalleled canvas for your custom dream home, situated in the enchanting backdrop of Lake Washington and the majestic Cascade Mountains. This hidden gem, with its boundless water views, promises a haven of tranquility and natural beauty. Imagine waking up to the gentle lapping of the lake's waters and savoring panoramic vistas of the rugged Cascade peaks. This lot is your opportunity to craft a residence that perfectly complements this stunning, serene setting—a truly unique and cherished piece of Pacific Northwest paradise awaiting your vision.
$300,000
— beds— baths0.26 acre (lot)
65 XX S Norfolk St, Seattle, WA 98118
Listing provided by NWMLS as Distributed by MLS Grid
Builders, rare opportunity to build and finish a large home in a great location, footings and rebar are in, ready to pour foundation. Plans available, permit is expired, approx. $12,000 for a new permit. 2 story home with daylight basement and 2 car garage. Need to bring in fill. Sewer in street, grinder pump needed to pump up. Great location, close to I-5, Sea Tac, Downtown Seattle, Boeing plant. Selling as is, buyer to do their due diligence.
$177,000
— beds— baths9,524 sq ft (lot)
5005 S 114th St, Tukwila, WA 98178
Listing provided by NWMLS as Distributed by MLS Grid
Welcome to an exceptional opportunity to own a pristine 11,000-square-foot lot nestled in the heart of Tukwila, WA. The lot is located near major highways, providing easy access to Seattle, Bellevue, and the SeaTac International Airport. Benefit from the utilities being readily available, connected to water/sewer and gas in the streets, streamlining the building process for your future home. Enjoy the convenience of being just moments away from shopping centers, dining options, and parks. Don't miss this chance to shape your vision into reality! Buyers to verify all info.
$165,000
— beds— baths0.25 acre (lot)
3720 S 128th St, Tukwila, WA 98168
Listing provided by NWMLS as Distributed by MLS Grid
Comes with plans submitted to the city for a 3000 square foot 4 bedroom 3 bath home with 2 car garage + MIL apartmentValue is in the land. Home is inhabitable. A great large level lot just minutes from downtown Seattle, Airport and New Transit Center. No neighbors behind or to the south of this lot which offers you an opportunity to build a nice home without peering into your neighbor's house. Home is on septic but sewer is in the street. Zoned LDR. Next to church
$500,000
— beds— baths0.27 acre (lot)
4407 S 140th St, Tukwila, WA 98168
Listing provided by NWMLS as Distributed by MLS Grid
Make a larger lot with your property in Tukwila area for Great or Reserve sources! Parcel # 1523049041 offers 32,878SF Lot. Your research study and confirmation to your own satisfaction is recommended. Short feasibility study would be allowed. If financing must have been currently approval. POF for cash offer. Buyer and Buyers broker are to verify all information prior to submitting offer. Location close by to I-5, 405, Light rail, South Center Mall and SeaTac Airport. Use your imagination and cash in on this opportunity!
$179,000
— beds— baths0.75 acre (lot)
14253 Macadam Rd S, Tukwila, WA 98168
Listing provided by NWMLS as Distributed by MLS Grid
Based on information submitted to the MLS GRID as of Sat Apr 27 2024. All data is obtained from various sources and may not have been verified by broker or MLS GRID. Supplied Open House Information is subject to change without notice. All information should be independently reviewed and verified for accuracy. Properties may or may not be listed by the office/agent presenting the information. Some IDX listings have been excluded from this website.
This area's enrollment policy is not based solely on geography. Please check the school district website for more information.
Elementary schools
Middle schools
High schools
GreatSchools Summary Rating
7/10
Wing Luke Elementary School
Public, K-5
6/10
McMicken Heights Elementary School
Public, PreK-5
6/10
Southern Heights Elementary School
Public, PreK-5
6/10
Campbell Hill Elementary School
Public, K-5
5/10
Rainier View
Public, PreK-5
Only showing 5 of
17 elementary schools.
School data is provided by GreatSchools, a nonprofit organization. Redfin recommends buyers and renters use GreatSchools information and ratings as a first step, and conduct their own investigation to determine their desired schools or school districts, including by contacting and visiting the schools themselves.Redfin does not endorse or guarantee this information. School service boundaries are intended to be used as a reference only; they may change and are not guaranteed to be accurate. To verify school enrollment eligibility, contact the school district directly.
Homes for sale in Tukwila have a median listing price of $599K. Some of these homes are Hot Homes, meaning they're likely to sell quickly.
What are some of the most popular neighborhoods in Tukwila?
Popular neighborhoods include Mountain Island Lake, Rainier Valley, Rainier View, Tukwila Hill, Skyway, Shorewood, Old Burien, Seattle-Tacoma International Airport, South Beacon Hill, and Rainier Beach.
Tukwila, Washington boasts a robust transportation system with a variety of options for residents. The city is well-connected by several major highways and freeways, making car travel convenient, though traffic levels can be high during peak hours. Public transportation is readily available in Tukwila, with services including buses and light rail, providing an alternative to driving. Whether you're commuting for work or exploring the city, Tukwila's transportation network supports your journey. Learn more on our Tukwila city guide.
What types of properties are available in Tukwila?
Tukwila, Washington offers a variety of single-family home types, including ranch-style homes, split-level homes, and contemporary-style homes. These homes can be found throughout Tukwila, Washington, in neighborhoods such as Foster, McMicken Heights, and Southcenter. Most properties in Tukwila, Washington feature two to four bedrooms and were built in various years. To explore different property types for sale in Tukwila, Washington, use the 'Home type' filter located above the active listings. Customize your search by selecting options like single-family homes, condos, townhomes, and more.
What is life like in Tukwila?
Tukwila, Washington offers a unique blend of urban and suburban living. The landscape is characterized by a mix of residential areas, commercial districts, and green spaces. The weather in Tukwila is typical of the Pacific Northwest, with mild summers and cool, wet winters. The city provides a range of job opportunities, with a variety of industries represented, including manufacturing, technology, and retail. Residents can enjoy a wide range of activities in Tukwila, such as exploring local parks, dining at diverse restaurants, and participating in community events.
What are the schools and amenities like in Tukwila?
Tukwila, Washington offers a variety of public amenities for its residents to enjoy. Dining options are abundant, with a range of restaurants serving diverse cuisines. For those who love the outdoors, the city boasts numerous parks perfect for relaxation and recreation. Grocery shopping is convenient with several grocery stores throughout the city. Additionally, Tukwila offers more amenities such as libraries, fitness centers, and shopping centers to cater to a variety of needs and interests.
In the past month, 8 homes have been sold in Tukwila. In addition to houses in Tukwila, there were also 6 condos, 2 townhouses, and 1 multi-family unit for sale in Tukwila last month. Tukwila is a minimally walkable city in King County with a Walk Score of 41. Tukwila is home to approximately 19,325 people and 44,206 jobs. Find your dream home in Tukwila using the tools above. Use filters to narrow your search by price, square feet, beds, and baths to find homes that fit your criteria. Our top-rated real estate agents in Tukwila are local experts and are ready to answer your questions about properties, neighborhoods, schools, and the newest listings for sale in Tukwila. Our Tukwila real estate stats and trends will give you more information about home buying and selling trends in Tukwila. If you're looking to sell your home in the Tukwila area, our listing agents can help you get the best price. Redfin is redefining real estate and the home buying process in Tukwila with industry-leading technology, full-service agents, and lower fees that provide a better value for Redfin buyers and sellers.


 REDFIN IS COMMITTED TO AND ABIDES BY THE FAIR HOUSING ACT AND EQUAL OPPORTUNITY ACT. READ REDFIN'S FAIR HOUSING POLICY AND THE NEW YORK STATE FAIR HOUSING NOTICE.
 United States
 Canada