?? * * Exquisite Oasis in El Monte * * Welcome to your dream home at 3026 Sastre Avenue, where luxury meets comfort in this meticulously remodeled sanctuary. Step into a world of elegance and modern living, boasting an impressive 2,037 sq. ft. of expansive open-concept space. Situated on a generous 9,037 sq. ft. lot, this residence offers the ultimate in California living. ? * * Custom Craftsmanship * * Indulge in the finest details with custom tile flooring adorning every corner, creating a seamless flow throughout the home. Sunlight dances through custom wooden window shutters, illuminating the elegance within. Crown molding graces each room, adding a touch of sophistication to
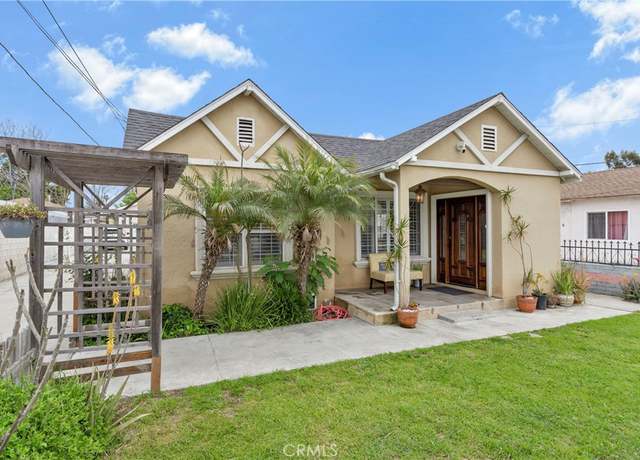
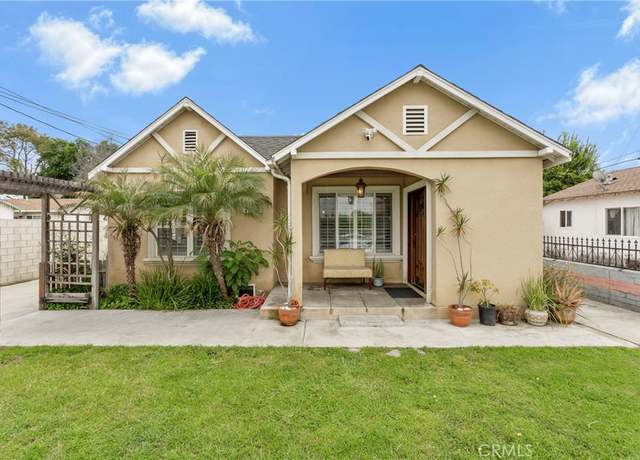
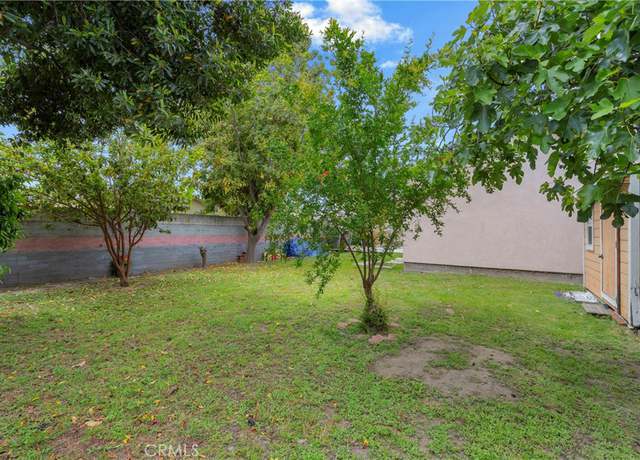
* This Is It !!! * Pics were taken before. Potential ADU and/or JADU space in Big Back Yard and big covered patio! Buyers to verify. * Location, Location and Location!! Neighbors Said This is the Center Location Close to Everywhere!" * Gorgeous, Pleasant 3 Bedrooms, 2 Bathrooms, Living Rm & Family Rm * Master Bedroom w/ Private Bathroom * This Remarkable Truly Stunning Home, * Lots of Newly Charming Renovated & Upgrades: Hot Water Supply plumbing pipes Newly Replaced, New Floor Tile & New Laminate Flooring, Freshly Painted Interior & Exterior!! Newly Replaced Kitchen Counter Tops, opens to Dinning area, Family Room Direct Access to Huge Covered Patio w/ open
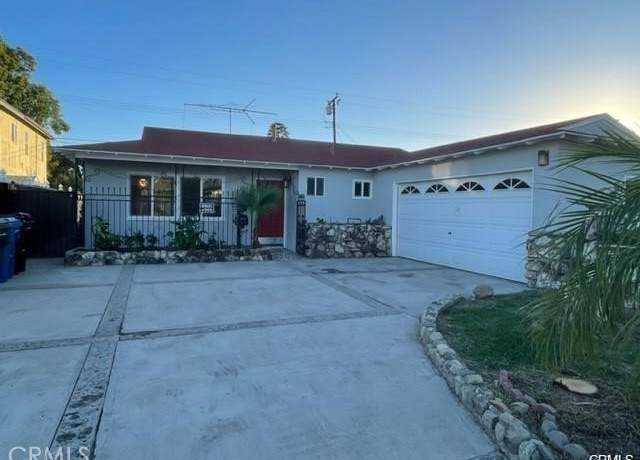
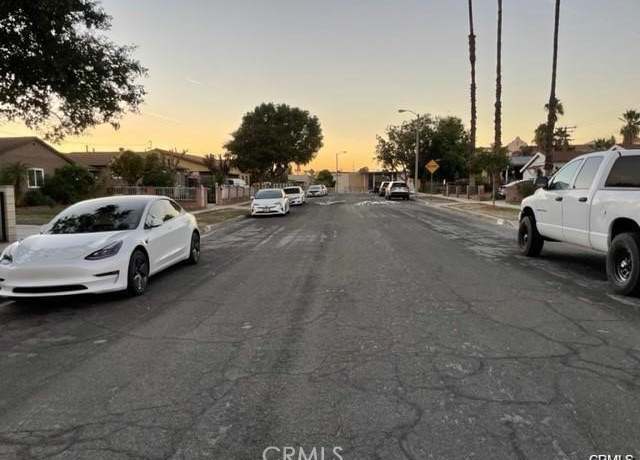
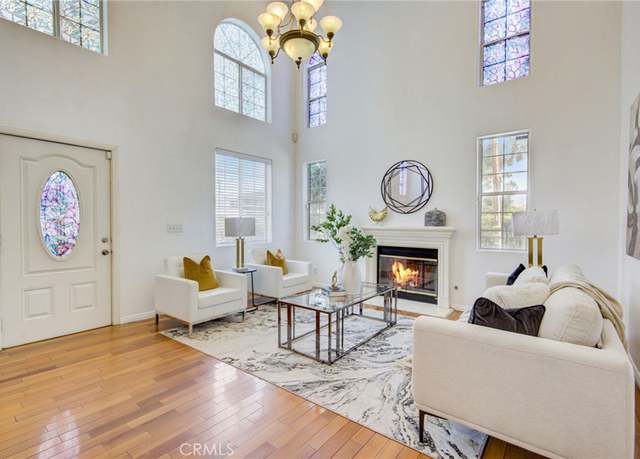
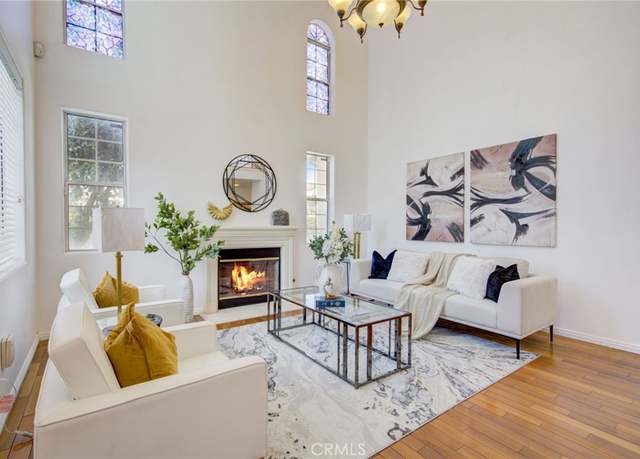
This charming house boasts a bright and airy interior, meticulously maintained and in move-in condition. The high-ceilinged living room features a cozy fireplace, creating a welcoming ambiance. A bedroom and a full bathroom are conveniently located on the first floor. Outside, the spacious backyard and side yard are enclosed with block walls, ensuring privacy. The cement floor is perfect for BBQ entertainment. Beautiful landscaping adorns the front yard. The oversized two-car attached garage offers direct access to the house, along with laundry facilities and storage sheds. Situated in a tranquil neighborhood, this property is the front unit of a gated community comprising four detached tow
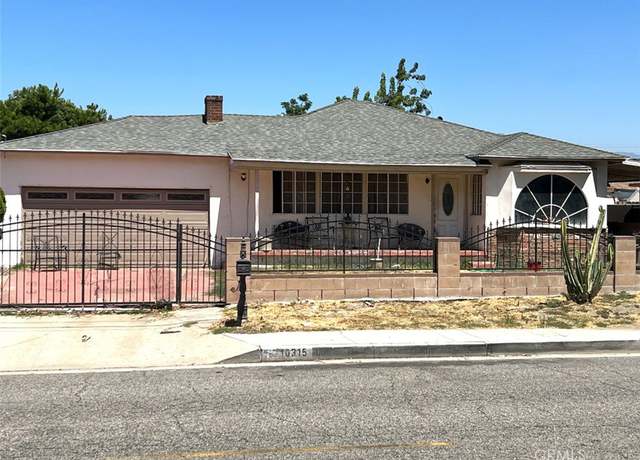
Welcome to your stunning new home at 10315 Klingerman Street in the serene neighborhood of South El Monte. This immaculately remodeled residence is a testament to modern elegance and thoughtful design, offering a seamless blend of comfort and style. Originally a 2 bedroom, 1 bath dwelling, this home has been expertly converted with permits into a spacious 3 bedroom, 2 bath haven. Boasting 1,222 square feet of meticulously crafted living space on a generous 5,909 square foot lot, this property offers ample room to live, relax, and entertain. Step inside to discover a wealth of upgrades and enhancements, including new plumbing, electrical systems, and a panel upgrade, ensuring both safety and
Great for first time buyer to own a house with yards! No HOA fees. This two bedroom 1 and a half bath house with updated Laminate wood flooring. Kitchen has updated Cabinets, Countertop Appliances and Tile Flooring, Corner Lot 1 car detached Garage. Walking distance to ShanFa supermarket and Garvey Ave. Very easy to access to the 10 and 60 freeway. This property located in the light Industry and Commercial zone is LEGAL NON-CONFORMING USE. To be sold as is present condition. Agent before you present the offer you better to seek your MLO to obtain Lender/Underwriter approval.
Discover luxury and convenience home in Echo community. Nestled in a gated enclave, this residence offers easy access to the area's best amenities, including downtown LA. These contemporary townhomes boast open-concept layouts and premium finishes throughout, along with the convenience of our Century Home Connect smart home package. The first floor beckons with stunning maintenance-free luxury vinyl plank flooring, complemented by stainless steel kitchen appliances and quartz countertops adorned with subway tile backsplash. Ample cabinet space, complete with pull bars, ensures both elegance and practicality. Take note of the thoughtful details, including electrical/junction box readiness fo
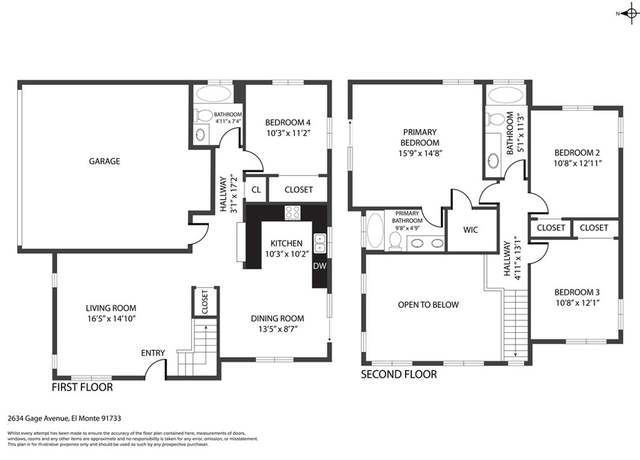
Welcome to your future home in the city of South El Monte! This charming two-story house offers the perfect blend of comfort, convenience, and style. Boasting four spacious bedrooms, three full bathrooms, and one half bathroom, this residence provides ample space for your family's needs. As you step inside, you'll be greeted by a warm and inviting atmosphere, with natural light streaming through large windows and illuminating the open floor plan. The well-appointed kitchen features modern appliances, sleek countertops, and plenty of cabinet space. The living area provides a cozy retreat, perfect for relaxing with loved ones or entertaining guests. Upstairs, you'll find the two master suites
This delightful mobile home offers a perfect blend of comfort and convenience. Step inside and discover the inviting features that make this residence truly special. The interior boasts beautiful laminate flooring, adding a touch of modern elegance to each room. Enjoy the convenience of a 3-car parking space, ensuring that you and your guests always have a secure place to park. Nestled in a prime location close to 605 and 60 freeways, this home offers easy access to transportation routes and nearby amenities. Don't miss the opportunity to make this mobile home yours. Schedule a viewing today and start envisioning the wonderful moments you'll create in this charming El Monte residence.
Beautiful home located in South El Monte great location four bedrooms three baths which has been upgraded throughout. This property won’t last long. Don’t hesitate on viewing this amazing 4beds 3 bath home . More photos to come in the next few days
There is a 2 bedrooms, 1 bathrooms single family house plus a market in front with one bathroom. Both property is for $820,000. The market tenant is willing to sell his store for $200,000. Please do not talk to the tenants. There will be no inspection of the house available. You need to buy as is condition.
Excellent opportunity to own this four-plex income property in El Monte! Currently fully occupied property with great tenants. All units come with 2 bedrooms, 1 bathroom, 4 separate electric & gas meters, and 1 common water meter. Great potential for ADU out of the large courtyard. A little TLC can absolutely turn it into a much more lucrative property. Conveniently located on Garvey Ave and near the 10 freeway, it is surrounded by plenty of shopping centers, restaurants, markets, and other amenities. The potential for revenue growth is abundant!
R3 zoning with 2 difference address, 3108 Adelia and 9701 Cortada. 3108 is residential with 1 bedroom and 1 bathroom. 9701 is a convenience store, water and beer & wine and lotto. Great location, good family business with steady income. Owner can live one and continuous rent out the convenience store for renter. There's a Hugh Vacant lot can be built another residential, please check with city for all information. Close to FHY. Markets and Restaurants. .. .. ..
Great investment opportunity. Live in one and rent the other three. This large private lot features 9652 sq. ft. with four units total 3031 sq . All two units have 2 bedrooms 2 bath rooms, one unit is 2 bed rooms 1 bathroom. One unit is 1 bed room 1 bath. Total 7 bedrooms and 6 bath rooms. There are two car garage. Close to schools, freeway, and commercial.
Presenting an excellent investment opportunity in the City of El Monte! We are proud to offer this exceptionally well-maintained 6 unit building, on the market for the first time in over 30 years. The property management company and ownership takes great care of the property and the tenants themselves demonstrate a strong sense of pride in their homes, resulting in a well-kept and inviting atmosphere throughout the property. A common courtyard with lots of shade and fruit trees are situated between 11126 and 11122 (also available for sale). Each of the 6 units within the building offers spacious living quarters. These well-designed apartments consist of 2 bedrooms, 1 bath, a comfortable liv
Well maintained 6 unit apartment building where the property management company takes good care of the building and the tenants take good care of their homes! There's a common courtyard between 11122 and 11126 (also for sale) with fruit trees for the tenant's enjoyment as well as a fenced front yard area. Each of the apartments have dual pane windows and are spacious 2 bedroom, 1 bath units with living room and dining area. There are 7 gas meters and 7 electric meters, a community laundry to service all apartments and parking for 6 cars behind the building. Located close to transportation, school, restaurants and easy access to the 10, 60 and 605 freeways. Current rents are below market, th
Investor's great news! Land located at one of premier location for townhouse development. Two separate units with total of 6 bedrooms and 3 bathrooms. One unit is currently occupied by tenants. The land covers an area of 30,000 sqft. Expired permit to build 11 properties. It is located east of Rosemead Blvd, south of Garvey Ave, in the center of South El Monte. Close proximity to schools, supermarkets, restaurants, and major highways (I-10, Fwy 60, 605). Near Whittier Narrows Natural Area, California Country Club, and Joy Badminton & Tennis. Rare chance for builders and investors seeking growth. Drive by only. More photos. Text listing agent for site plan.
Come and check out this beautiful 2 bedroom 2 bath home in South El Monte. The living room is very spacious and both rooms feature walk-in closets. It's move-in ready and has a driveway for up to three parked cars. Not to mention it's located near freeways and shopping centers. This park also includes a community pool perfect for families and a very peaceful neighborhood.
Great income property, all units have 2 bedrooms and 1 bathroom. This property is recently upgraded including : New painted exterior wall, new paint fences, new rain gutters, replace some windows, replace one new window A/C unit. Convenience locations to Shopping, Restaurants, and Freeway.
Rare find R3 lot in South El Monte, excellent neighborhood, plan to build 10 units apartment building, each unit is about 2133 sqft. (plan can be review upon request), Current house is 1780 sqft 3 bedrooms 3 bathrooms rent at $3000 per month in m/m lease, purchase includes 8103-024-032.
Rare find R3 land in South El Monte, City approved to build 11-12 unit condo apartments, plan can be reviewed upon requested, lot dimension 100 by 300, currently has two structures on the lot rental income $3300 monthly on m/m bases, highly demanding rental area, excellent quiet neighbor. The second lot similar size on north side also for sale. Buyer can develop both at the same time.
School data is provided by GreatSchools, a nonprofit organization. Redfin recommends buyers and renters use GreatSchools information and ratings as a first step, and conduct their own investigation to determine their desired schools or school districts, including by contacting and visiting the schools themselves.Redfin does not endorse or guarantee this information. School service boundaries are intended to be used as a reference only; they may change and are not guaranteed to be accurate. To verify school enrollment eligibility, contact the school district directly.
South El Monte, California boasts a robust transportation system, with a variety of options for residents. The city experiences moderate traffic levels, making car travel a convenient option for commuting or leisurely drives. Public transportation is also available, providing an alternative for those who prefer not to drive. Additionally, South El Monte is conveniently located near several major highways and freeways, further facilitating ease of travel.
What types of properties are available in South El Monte?
South El Monte, California offers a variety of single-family home types, including ranch-style homes, contemporary homes, and modern homes. These homes can be found throughout the city, with some located in established neighborhoods while others are situated in newer developments. Most properties in South El Monte feature two to four bedrooms and were built within the past 20 years. To explore different property types for sale in South El Monte, California, use the 'Home type' filter located above the active listings. Customize your search by selecting options like single-family homes, condos, townhomes, and more.
What is life like in South El Monte?
South El Monte, California offers a unique living experience with its picturesque landscape. The region boasts a pleasant climate, characterized by mild winters and warm summers. The area presents a range of job opportunities in various sectors, ensuring a diverse employment market. Residents can engage in a variety of recreational activities, including outdoor sports and exploring nearby natural areas. South El Monte also hosts numerous community events and festivals, providing ample entertainment options for residents to enjoy.
What are the schools and amenities like in South El Monte?
South El Monte, California, offers a variety of public amenities to its residents. It boasts a selection of restaurants, providing a range of dining options to cater to diverse tastes. The city is also home to several parks, offering open spaces for relaxation and recreation. For daily necessities, there are grocery stores available within the city limits. Additionally, South El Monte provides other amenities such as schools, libraries, and fitness centers for the convenience and enrichment of its residents.
In the past month, 4 homes have been sold in South El Monte. In addition to houses in South El Monte, there were also 2 condos, 2 townhouses, and 1 multi-family unit for sale in South El Monte last month. South El Monte is a moderately walkable city in Los Angeles County with a Walk Score of 61. South El Monte is home to approximately 20,523 people and 15,047 jobs. Find your dream home in South El Monte using the tools above. Use filters to narrow your search by price, square feet, beds, and baths to find homes that fit your criteria. Our top-rated real estate agents in South El Monte are local experts and are ready to answer your questions about properties, neighborhoods, schools, and the newest listings for sale in South El Monte. Our South El Monte real estate stats and trends will give you more information about home buying and selling trends in South El Monte. If you're looking to sell your home in the South El Monte area, our listing agents can help you get the best price. Redfin is redefining real estate and the home buying process in South El Monte with industry-leading technology, full-service agents, and lower fees that provide a better value for Redfin buyers and sellers.


 REDFIN IS COMMITTED TO AND ABIDES BY THE FAIR HOUSING ACT AND EQUAL OPPORTUNITY ACT. READ REDFIN'S FAIR HOUSING POLICY AND THE NEW YORK STATE FAIR HOUSING NOTICE.
 United States
 Canada