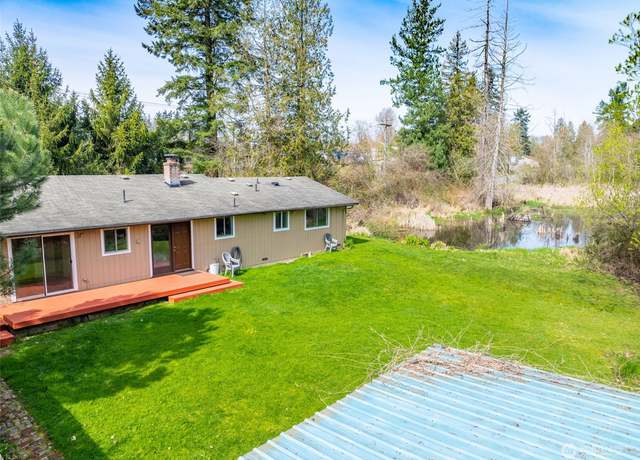
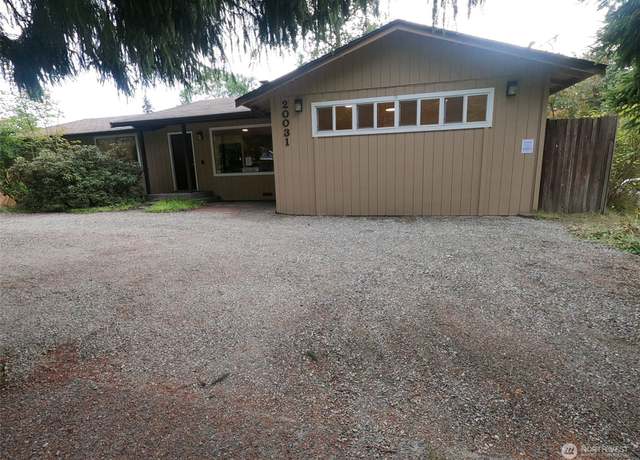
Total Privacy, NO NEIGHBORS EVER! Waterfront on two sides. This is a MUST SEE to believe. Bring your nature lovers. Magnificent sweeping view feels like a national park. Total privacy in large backyard. Established mature gardens and flowering shrubs. A gardener's paradise. House has complete rehab of all surfaces: floor, counter, walls. Huge detached workroom, space for RV with outlet, private covered parking in rear. All this within walking distance of Alderwood Mall. Close to freeway and new light rail station. NOTHING ELSE LIKE IT ON THE MARKET AT THIS PRICE POINT.
1/39
$950,000
4 beds3 baths1,623 sq ft8,712 sq ft (lot)
20031 28th Ave W, Lynnwood, WA 98036
Listing provided by NWMLS as Distributed by MLS Grid
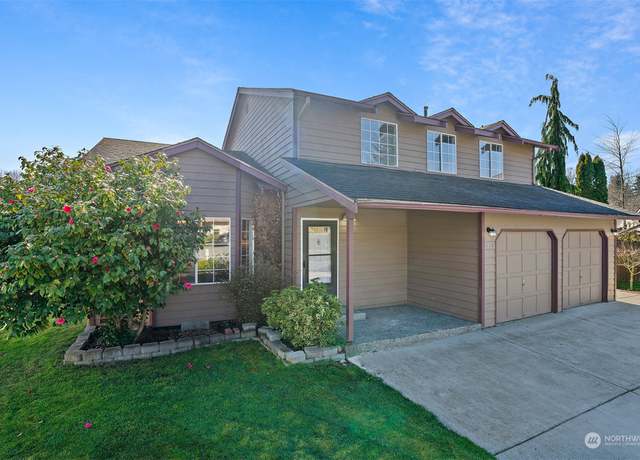
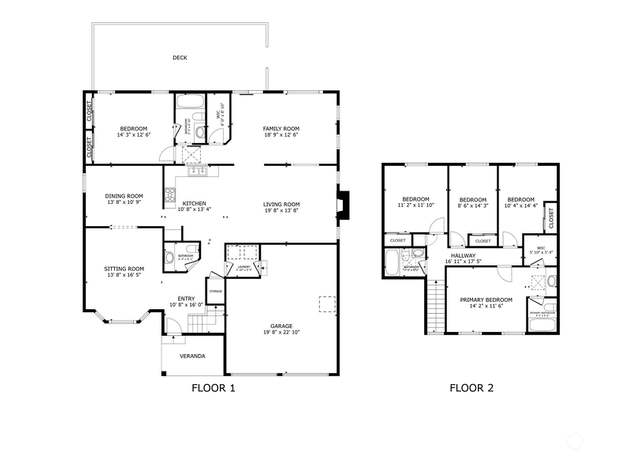
Lovely tri level home on huge lot with an additional shop/garage. Plenty of room for your RV too! Home has been tastefully updated throughout. SS appliances, quartz countertops, newer cabinets & laminate floors. Living room has cozy pellet stove. Primary bdr has travetine bath/heated floors & walk in closet. Outside you have covered patio and fire pit, great for entertaining. The enormous shop has plenty of room for your projects and a wood stove to keep you warm. This property has so much to offer, close to town but feels away from it all!
1/35
$949,950
3 beds2.5 baths1,787 sq ft0.27 acre (lot)
18829 24th Ave W, Lynnwood, WA 98036
Listing provided by NWMLS as Distributed by MLS Grid
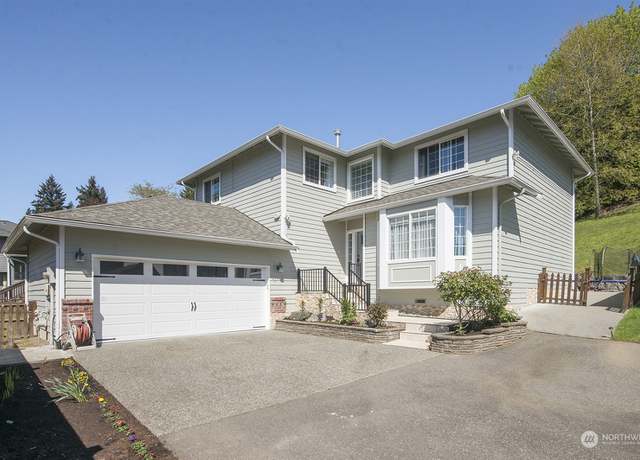
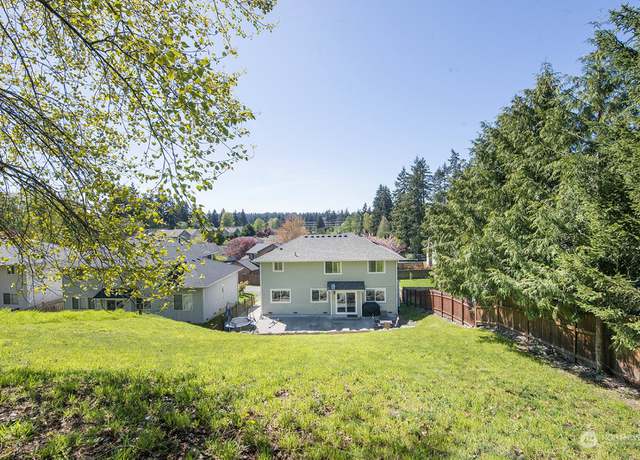
Exquisite 2,554sf 5-bed Brierwood home offers the perfect setting for everyday living & entertaining! Enjoy the open plan layout w/ several sizable living & dining spaces that create a very inviting atmosphere. The impressive gourmet kitchen features granite counters/breakfast bar/SS appl. ADDED BONUS - A Primary Suite w/ bath on each level! Upper level also features 3 guest rooms & guest bath. The fenced backyard is the perfect setting for BBQ’s & entertaining. It features an enormous deck, a children’s play set & trampoline w/ safety net, & a lrg shed. It's just a quick stroll to Brierwood Park w/ playgrounds, picnic tables & sports cou
1/34
$1,150,000
5 beds3.5 baths2,554 sq ft8,276 sq ft (lot)
2822 210th St SW, Lynnwood, WA 98036
Listing provided by NWMLS as Distributed by MLS Grid
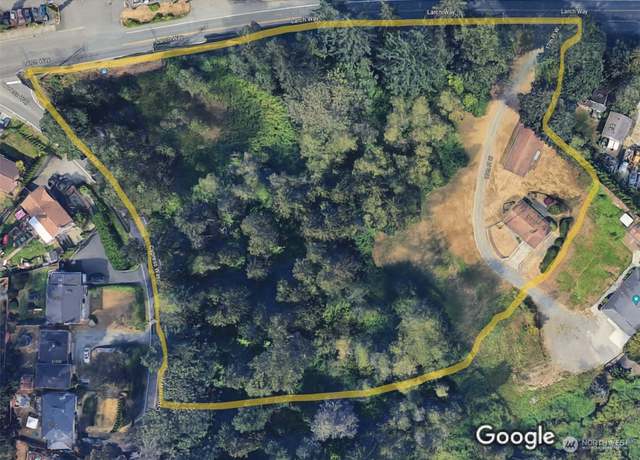
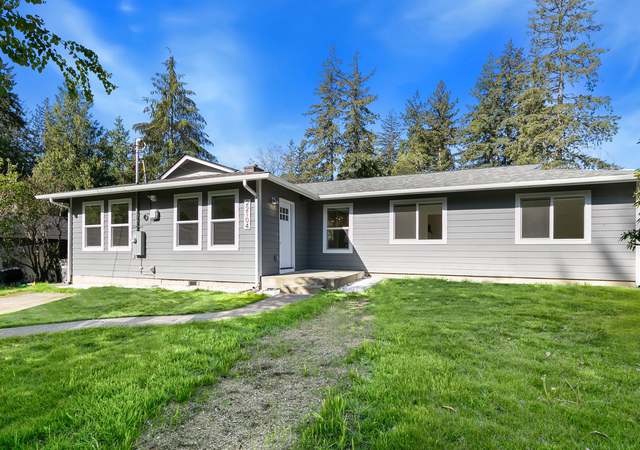
Incredible opportunity for investors, farmers or a multiple family property! Over 5 acres of private park like setting with a charming small house, 20x48 shop and plenty of beautiful trees! This property has endless possibilities! Minutes to Alderwood Mall, I-5, I-405, Costco, bus line, restaurants, shopping and new light rail. Home is in good condition/VALUE IS IN THE LAND. Property corners with Cypress/Larch Way for amazing building opportunities. Long term feasibility contingency WILL NOT be accepted, property is sold as-is/Estate Sale. So much potential! Check the supplements. Buyer to verify all information independently. Property includes 2 parcels 003731-011-017-01 and 003731-007-006
1/9
$1,200,000
2 beds1 bath864 sq ft5.09 acres (lot)
1814 Larch Way, Lynnwood, WA 98036
Listing provided by NWMLS as Distributed by MLS Grid
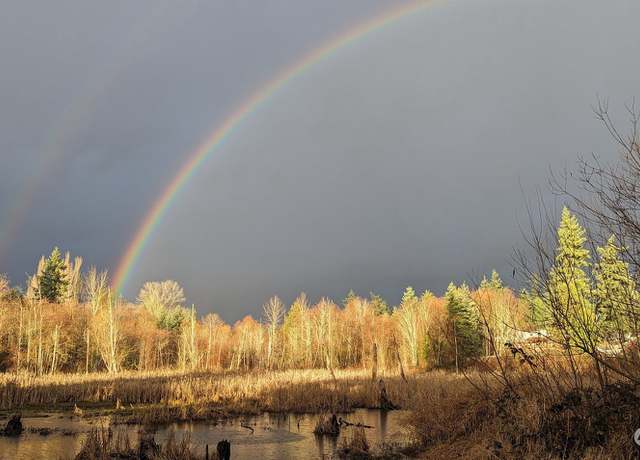
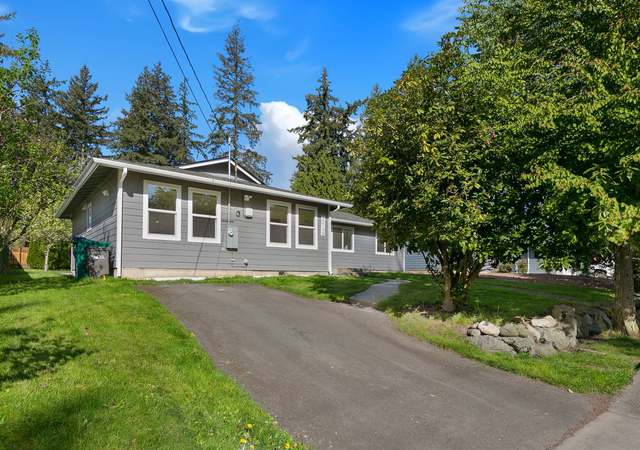
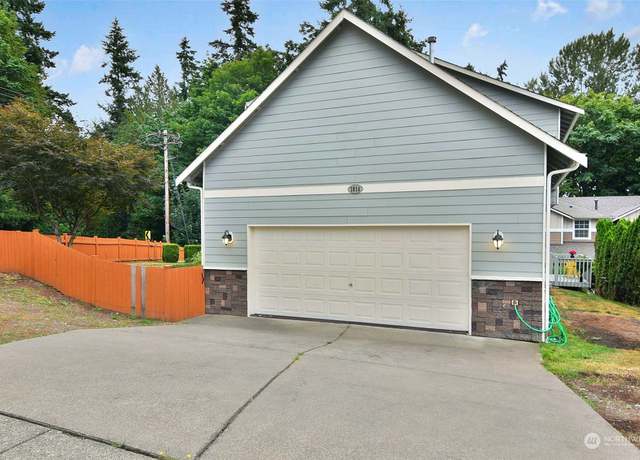
Stunning 4 bed or 3 bed + office home that has been fully remodeled & ready for your personal décor. Welcoming you into the home is an open layout w spacious entry that flows into the living room, giving you a warm smile w the wood burning fireplace. The kitchen w quartz counters, SS appliances, & bar seating is also open to the dining room to make it great for cooking while entertaining guests. Thru the kitchen is a fantastic leisure room w doors to large backyard w huge detached garage w loads of storage space/workshop/ home gym. This home also backs to the Bicentennial Park for easy access to trail, playground, picnic tables, & occasional rainbow sightings. Close t
1/38
$849,950
4 beds2 baths1,600 sq ft8,712 sq ft (lot)
22104 39th Ave W, Mountlake Terrace, WA 98043
Listing provided by NWMLS as Distributed by MLS Grid
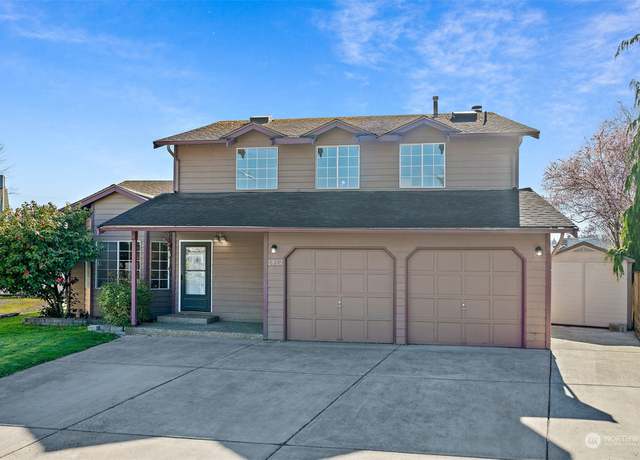
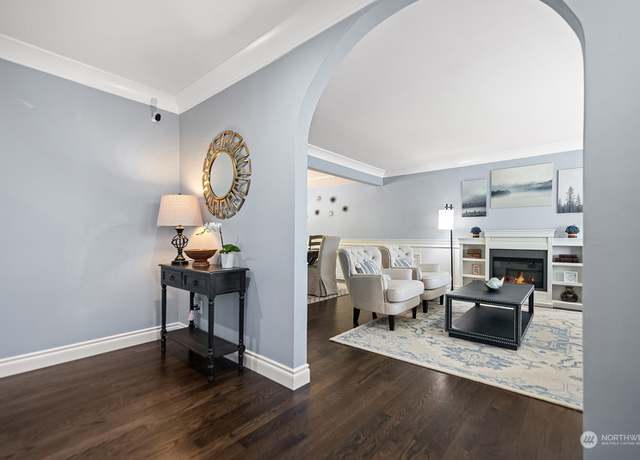
The grand two-story foyer and separate formal dining and living rooms are perfect for entertaining guests. The heart of the home is the expansive great room, boasting a cozy gas fireplace & plush carpeting, creating a warm, inviting atmosphere. Expansive kitchen with convenient eating bar, gas cooktop, SS appliances, maple cabinets & granite countertops. Luxurious primary suite. Pamper yourself in the corner soaking tub or rejuvenate in the tiled shower. A generous walk-in closet provides ample storage space. Additional living spaces, media/bonus room or potential fifth bedroom & den/loft/tech center, catering to various lifestyle needs. Landscaped yard & RV parking.
1/35
$1,150,000
5 beds3 baths3,382 sq ft9,148 sq ft (lot)
903 199th St SW, Lynnwood, WA 98036
Listing provided by NWMLS as Distributed by MLS Grid
This 4 Bedroom+Den+Bonus is Remodeled to perfection and sits on a large, private lot in the sought-after Northshore School District(Bothell HS/Kenmore MS/Frank Love ES). Kitchen and all 3 baths recently remodeled with slab countertops, new cabinetry, lighting, fixtures, appliances, extensive additional millwork added throughout home(crown molding/chair rail/baseboards/doors and trim) plus hardwood floors throughout both levels(zero carpet!). Furnace, AC, Roof, tankless HW recently replaced and AC added! Walk-in pantry and luxurious primary ensuite. 4 beds plus bonus together on upper level, den with closet on main. Great neighborhood, open floorplan, light and bright, move in ready. .. this
1/39
$1,098,000
5 beds2.5 baths2,326 sq ft0.26 acre (lot)
21513 12th Ave W, Lynnwood, WA 98036
Listing provided by NWMLS as Distributed by MLS Grid
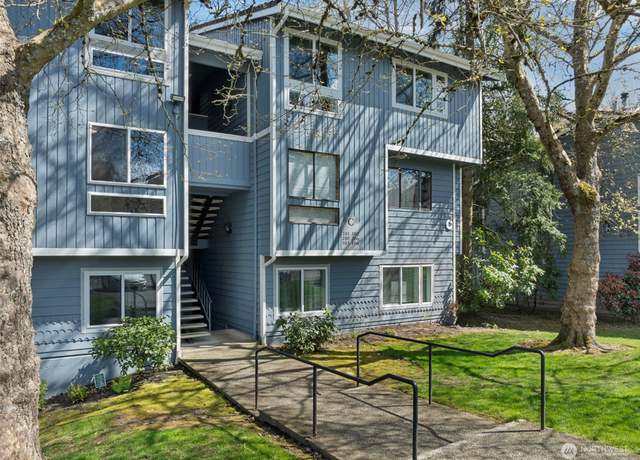
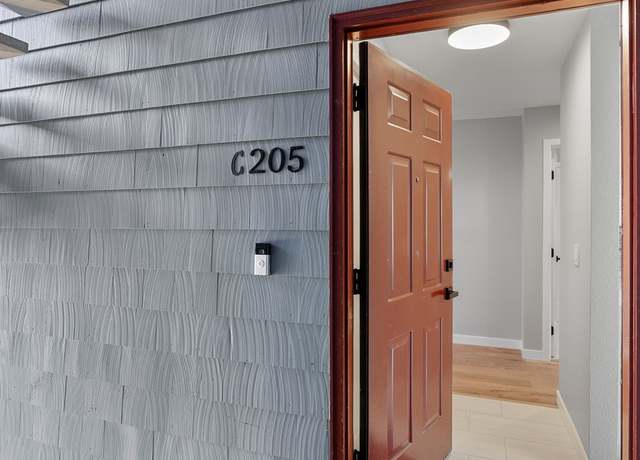
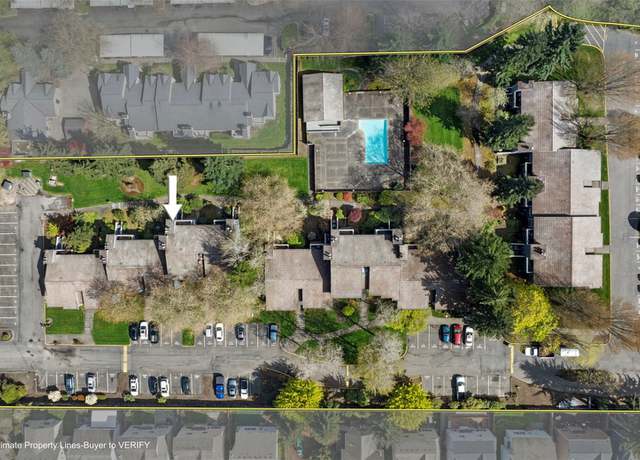
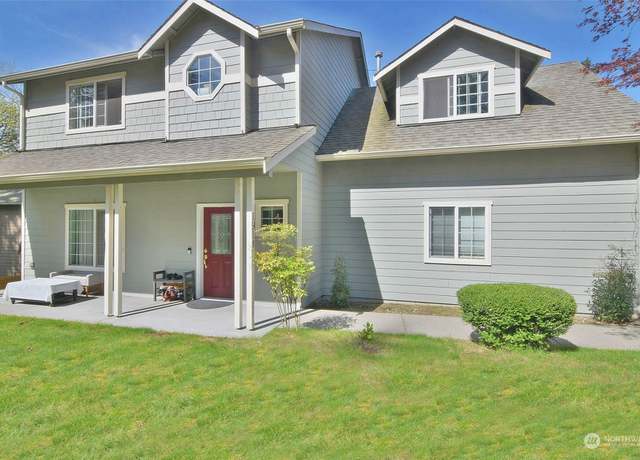
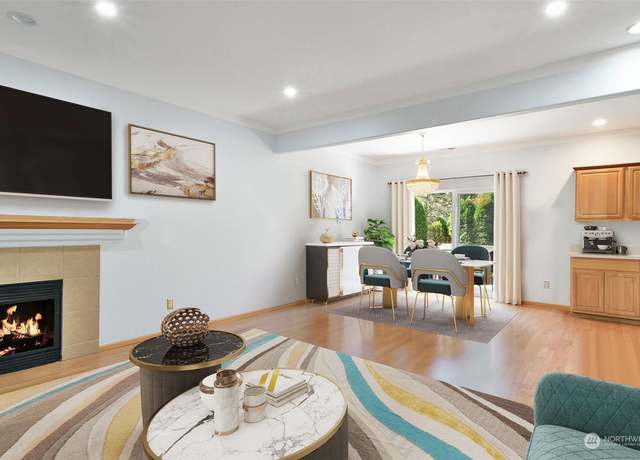
Fully permitted remodel completed in 2024. Everything has been updated, this is a new condo inside. This is the perfect home for you! Modern styling throughout the home. New; Cabinets, Appliances, Fresh paint, Light Fixtures, Furnace, Water Heater and so much more. Less than 2 miles to light rail coming soon in late 2024 which will connect you to Seattle and the Airport. Alderwood Mall is 2.5 miles away. Safeway shopping plaza across the street. HOA fees include garbage, sewer, water, cable, landscaping and more!
1/29
$399,999
2 beds1 bath886 sq ft
4118 212Th St SW Unit C205, Mountlake Terrace, WA 98043
Listing provided by NWMLS as Distributed by MLS Grid
Light and bright, beautifully maintained two-story craftsman centrally located in the Lynnwood-Martha Lake area. Open area concept includes spacious living room with cozy gas fireplace, dining area with slider to private barbeque deck and kitchen complete with stainless steel appliances. Gleaming laminate wood floors span the entire space. Generous bedrooms include primary with walk-in closet and five-piece bath. Huge bonus room on upper level has endless possibilities: 4th bedroom, entertainment room, play area etc. No HOA. Newer interior and exterior paint plus recessed lighting. Two-car attached garage. Quick and easy access to I-5 and I-405, Alderwood Mall, new Costco and Home Depot plu
1/22
$830,000
3 beds2.5 baths1,931 sq ft6,098 sq ft (lot)
1914 182nd St SW, Lynnwood, WA 98037
Listing provided by NWMLS as Distributed by MLS Grid
Incredible opportunity awaits in this RS8-zoned property sits on 17,424 sq. ft lot! This income-generating home offers endless possibilities. Featuring 8 bedrooms, 8.5 baths, and 2 kitchens spread over 2 levels, with 5 bedrooms on the main and 3 on the upper, including a second kitchen and separate laundry. Currently earning $6,500 per month with potential for more by finishing the 3-car garage for additional income. Enjoy ample parking in the front and back yards, with potential for renting out parking or building an additional DADU. Nearby adult family home generating $18K/month with only 3 residents or house International Students. Imagine the potential! Act now!
1/40
$1,599,000
8 beds10 baths7,680 sq ft0.40 acre (lot)
17828 44th Ave W, Lynnwood, WA 98037
Listing provided by NWMLS as Distributed by MLS Grid
Large 4 bedroom, 3 bathroom home with updates throughout! Home has a separate apartment for extra income. Upper floor of home has 3 bedrooms, and 2 baths, with open kitchen and large deck. Lower apartment unit is a 1 bedroom and 1 bathroom apartment with a separate entrance and it’s own laundry. The rental unit has a living room with a fireplace, and large Kitchen. Great income potential. Current rent $1350. Home has a newer furnace, A/C, and split duct heating/cooling in the apartment. The home has a 2 car garage as well as off street parking for 3 additional cars near mailbox. Easy access to both 405 and I-5.
1/35
$930,000
4 beds3 baths2,113 sq ft6,534 sq ft (lot)
18211 Larch Way, Lynnwood, WA 98037
Listing provided by NWMLS as Distributed by MLS Grid
Welcome to Cedar Pointe! This fast selling centrally located community has it all! Enjoy easy commute options plus shopping, dining and entertainment are nearby. The Baker Daylight on homesite #40 offers a main floor bedroom and adjoining bath, gourmet chef’s island kitchen with seating, dining area and open concept great room and mud room! Plus loft area with tech niche, oversize primary and ensuite, 3 additional spacious bedrooms, full bath & utility. Lower level boasts large bonus room, 6th bedroom, bath with shower and storage room. You'll be excited to find the latest in contemporary and a sizeable neighborhood park w/ regulation pickle ball court and a basketball court.
1/29
$1,334,995
6 beds4 baths3,482 sq ft
18808 14th Ave W, Lynnwood, WA 98037
Listing provided by NWMLS as Distributed by MLS Grid
Attn-developers! Beautiful multi-level home with MIL potential on shy acre lot with two additional lots almost ready to go! Ideal location and ideal property for developer to live in home while building! Home has been remodeled and updated with granite in kitchen-gleaming hardwoods and unique floorplan which could accommodate extended living. Relax by your river rock fireplace or soak in your hot tub nestled amid the trees on your heavily wooded hideaway! All the hard work is done on the additional lots -Just bring your contractor to finalize the development and away you go!! Swift stop for light rail right outside! Don't let this one slip away!
1/19
$1,595,000
4 beds3 baths3,206 sq ft0.87 acre (lot)
17907 36th Ave W, Lynnwood, WA 98037
Listing provided by NWMLS as Distributed by MLS Grid
Based on information submitted to the MLS GRID as of Tue Apr 30 2024. All data is obtained from various sources and may not have been verified by broker or MLS GRID. Supplied Open House Information is subject to change without notice. All information should be independently reviewed and verified for accuracy. Properties may or may not be listed by the office/agent presenting the information. Some IDX listings have been excluded from this website.
School data is provided by GreatSchools, a nonprofit organization. Redfin recommends buyers and renters use GreatSchools information and ratings as a first step, and conduct their own investigation to determine their desired schools or school districts, including by contacting and visiting the schools themselves.Redfin does not endorse or guarantee this information. School service boundaries are intended to be used as a reference only; they may change and are not guaranteed to be accurate. To verify school enrollment eligibility, contact the school district directly.
Alderwood Manor, Washington boasts a well-structured transportation system that supports the daily commute of its residents. The region experiences moderate traffic levels, making driving by car a convenient option for many. Public transportation is available, providing an alternative for those who prefer not to drive. Additionally, Alderwood Manor is conveniently located near several major highways and freeways, further enhancing its accessibility.
What types of properties are available in Alderwood Manor?
Alderwood Manor, Washington offers a variety of single-family home types, including ranch-style homes, split-level homes, and contemporary homes. These homes can be found throughout the neighborhood, providing a diverse range of options for buyers. Most properties in Alderwood Manor feature two to four bedrooms and were built within the past few decades. To explore different property types for sale in Alderwood Manor, Washington, use the 'Home type' filter located above the active listings. Customize your search by selecting options like single-family homes, condos, townhomes, and more.
What is life like in Alderwood Manor?
Living in Alderwood Manor, Washington offers a serene and picturesque environment with a diverse range of landscapes. The region experiences a mild climate, characterized by moderate temperatures and occasional rainfall. The area provides ample job opportunities across various industries, catering to diverse interests and skill sets. Residents can engage in a wide array of recreational activities, including outdoor adventures such as hiking, biking, and exploring nearby parks and trails. Additionally, the community fosters a vibrant social scene, with numerous local events and gatherings to partake in.
What are the schools and amenities like in Alderwood Manor?
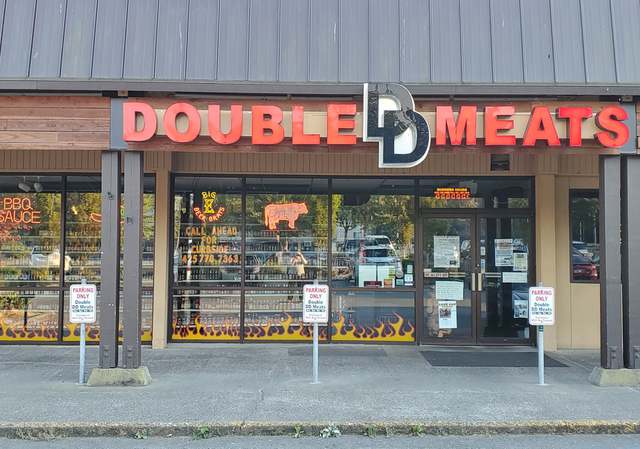
Alderwood Manor, Washington, is a community that boasts a variety of public amenities. Residents can enjoy a meal at a local restaurant, providing a range of culinary experiences. The area is also home to a well-stocked grocery store, ensuring easy access to daily necessities. Outdoor enthusiasts will appreciate the presence of a park, perfect for leisurely strolls or picnics. Additionally, more amenities are available, making Alderwood Manor a well-equipped and convenient place to reside.
In the past month, 12 homes have been sold in Alderwood Manor. In addition to houses in Alderwood Manor, there was also 1 condo, 1 townhouse, and 1 multi-family unit for sale in Alderwood Manor last month. Find your dream home in Alderwood Manor using the tools above. Use filters to narrow your search by price, square feet, beds, and baths to find homes that fit your criteria. Our top-rated real estate agents in Alderwood Manor are local experts and are ready to answer your questions about properties, neighborhoods, schools, and the newest listings for sale in Alderwood Manor. Our Alderwood Manor real estate stats and trends will give you more information about home buying and selling trends in Alderwood Manor. If you're looking to sell your home in the Alderwood Manor area, our listing agents can help you get the best price. Redfin is redefining real estate and the home buying process in Alderwood Manor with industry-leading technology, full-service agents, and lower fees that provide a better value for Redfin buyers and sellers.


 REDFIN IS COMMITTED TO AND ABIDES BY THE FAIR HOUSING ACT AND EQUAL OPPORTUNITY ACT. READ REDFIN'S FAIR HOUSING POLICY AND THE NEW YORK STATE FAIR HOUSING NOTICE.
 United States
 Canada