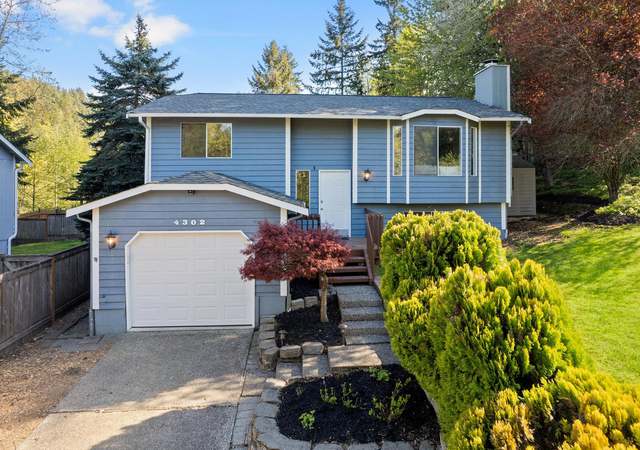
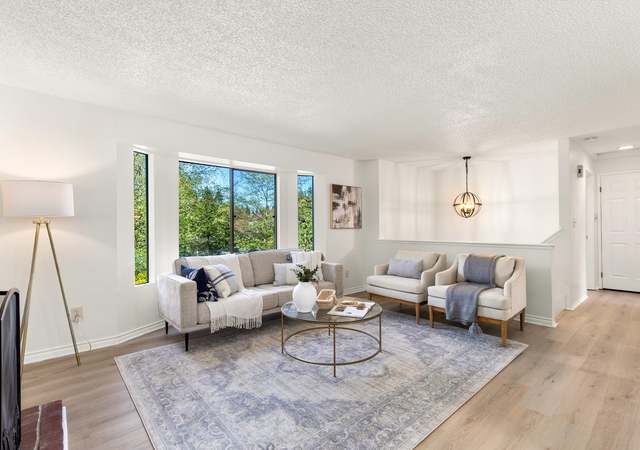
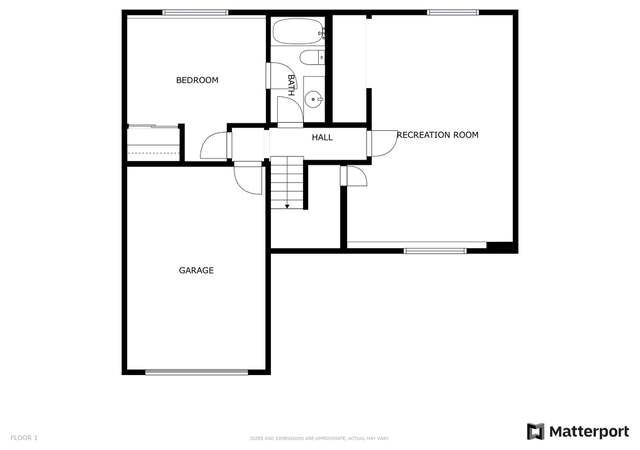
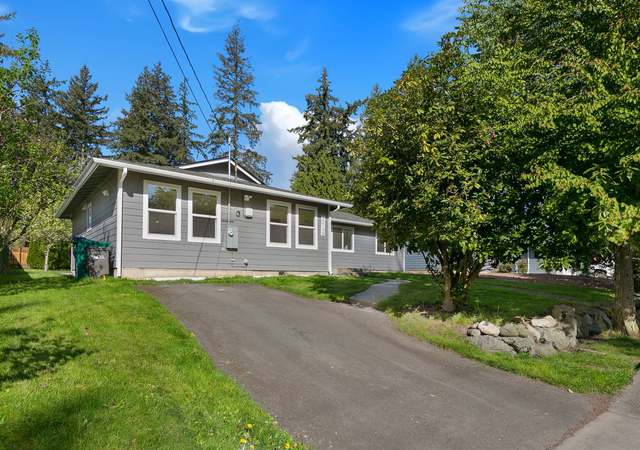
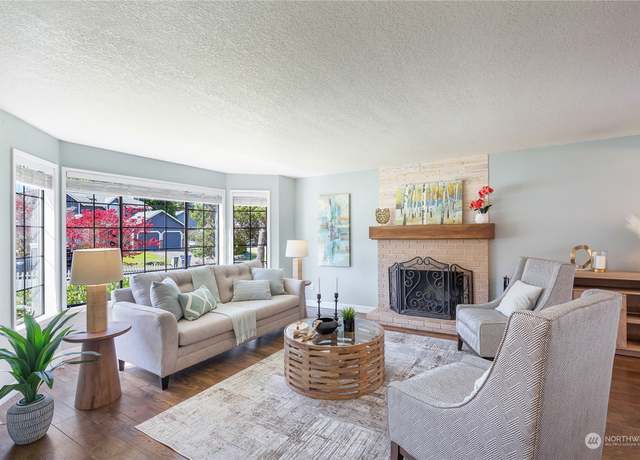
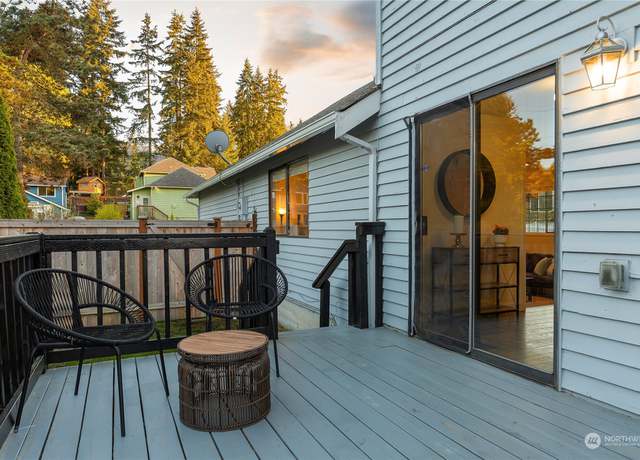
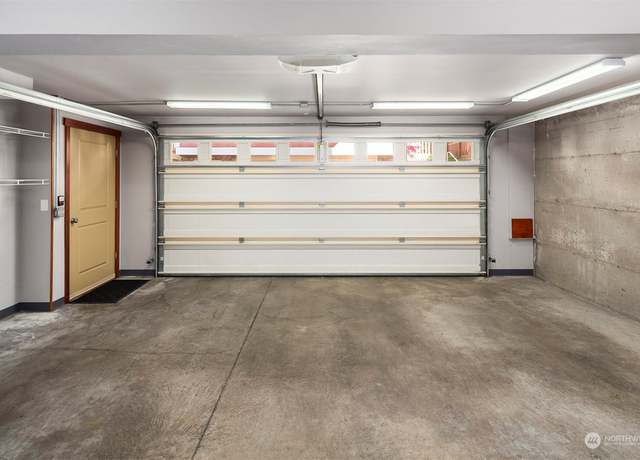
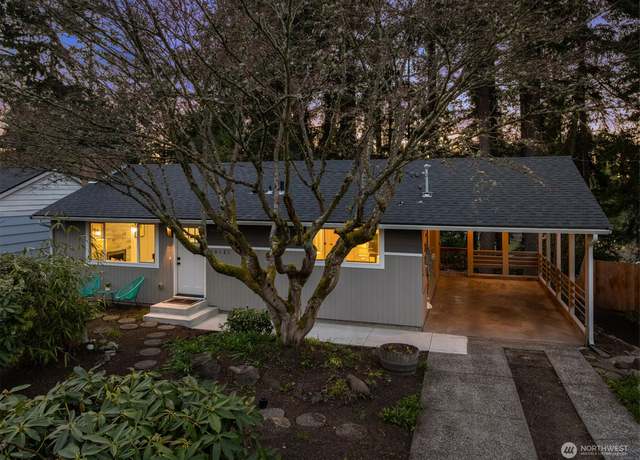
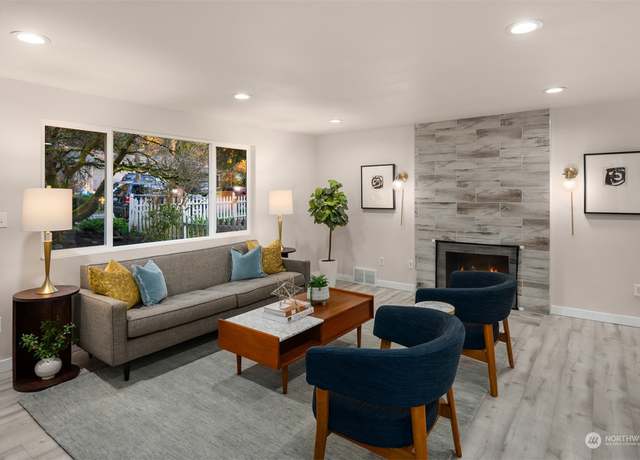
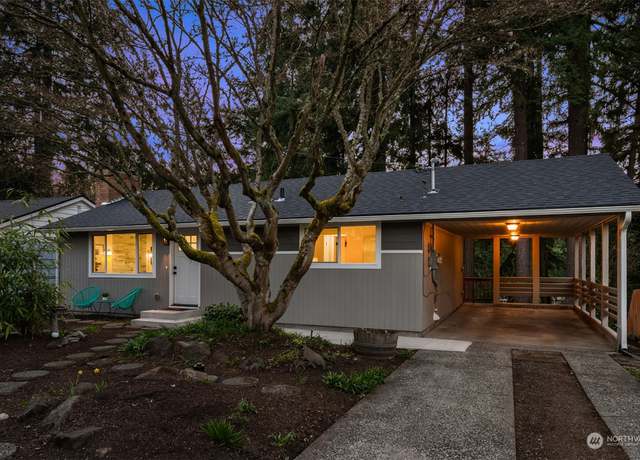
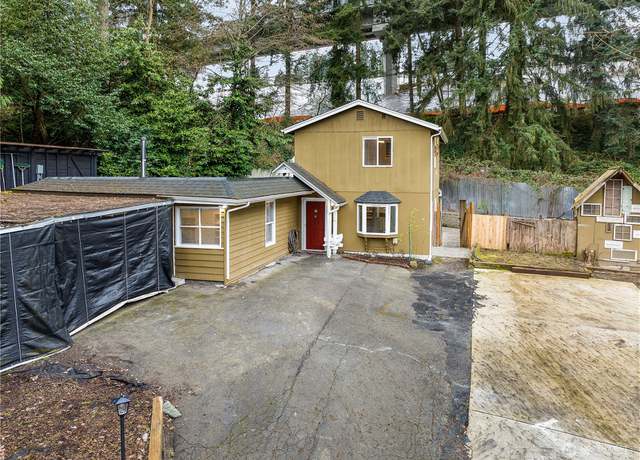
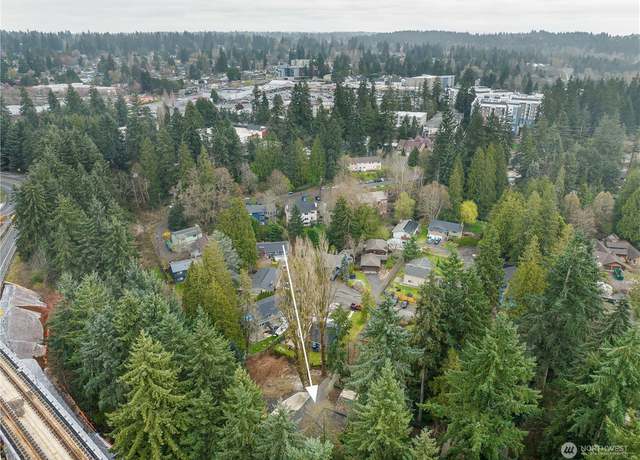
This spacious gem boasts a light-filled living room with picturesque views of the sprawling lot, complemented by fresh flooring and a charming fireplace for cozy evenings. The kitchen, complete w/ SS apps & eating bar, flows into the dining area & onto the deck—perfect for long summer days. Upstairs, 2 beds & a pristine bath. Lower level offers an ensuite bedroom & generous rec room. Bask in the sunshine of the south-facing backyard, ideal for a veggie garden in the raised beds. With the upcoming LINK Light Rail just a stroll away, convenience meets a solid investment. Enjoy the garage & ample off-street parking. Close to the new elementary school, parks,
1/23
$779,000
3 beds2 baths1,554 sq ft0.74 acre (lot)
4302 238th Pl SW, Mountlake Terrace, WA 98043
Listing provided by NWMLS as Distributed by MLS Grid
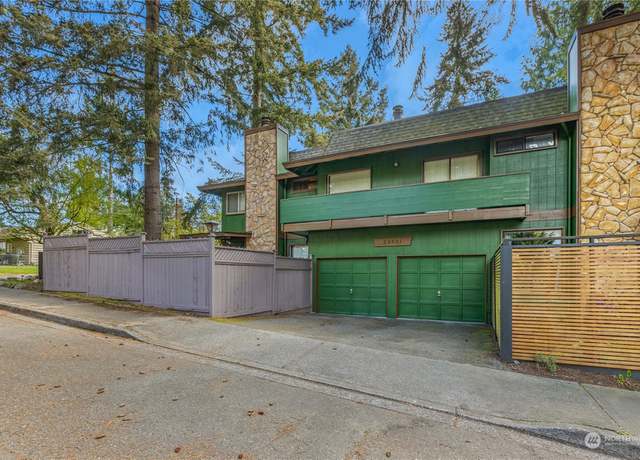
Stunning 4 bed or 3 bed + office home that has been fully remodeled & ready for your personal décor. Welcoming you into the home is an open layout w spacious entry that flows into the living room, giving you a warm smile w the wood burning fireplace. The kitchen w quartz counters, SS appliances, & bar seating is also open to the dining room to make it great for cooking while entertaining guests. Thru the kitchen is a fantastic leisure room w doors to large backyard w huge detached garage w loads of storage space/workshop/ home gym. This home also backs to the Bicentennial Park for easy access to trail, playground, picnic tables, & occasional rainbow sightings. Close t
1/38
$849,950
4 beds2 baths1,600 sq ft8,712 sq ft (lot)
22104 39th Ave W, Mountlake Terrace, WA 98043
Listing provided by NWMLS as Distributed by MLS Grid
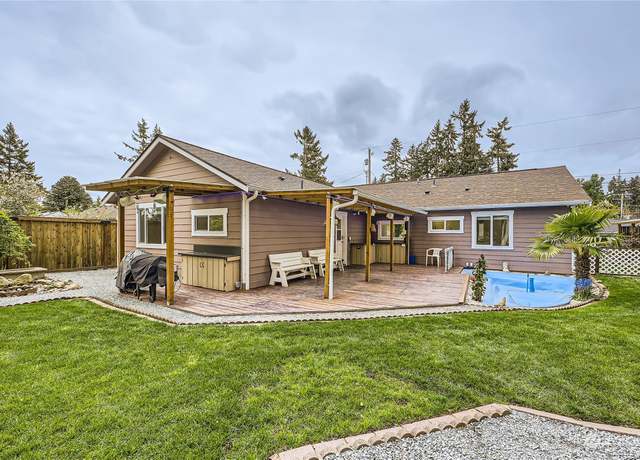
Exceptional west-facing home on a cul-de-sac corner lot in a tranquil neighborhood. All spaces are above-grade, flowing easily inside & out. Kitchen w/ easy sight lines to deck & yard; calmly watch people & pets. Two large hang spaces (use one as main level bedroom?) for hosting & hobbies. Powder room & easy access to attached 2-car garage; vehicles & toys. 3 beds/2 baths up; a generous primary w/ en-suite & two more beds with full bath. It’s all nice & functional, with future upside in updated finishes. A/C for summer & cozy fireplace for winter. Abundant light & great outdoor spaces. A short jaunt: MLT town center; parks, l
1/28
$925,000
3 beds2.5 baths1,881 sq ft8,712 sq ft (lot)
23809 44th Ave W, Mountlake Terrace, WA 98043
Listing provided by NWMLS as Distributed by MLS Grid
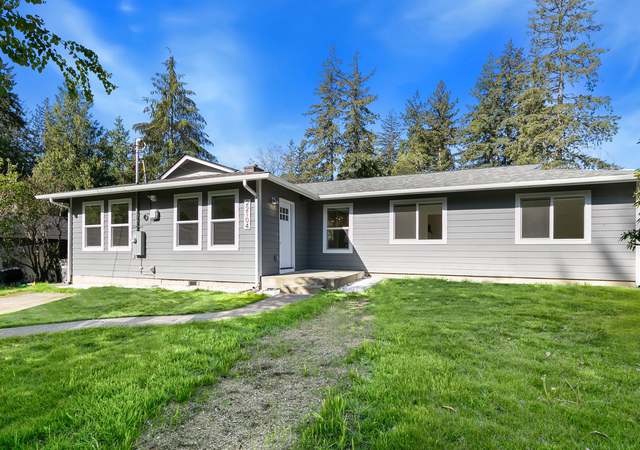
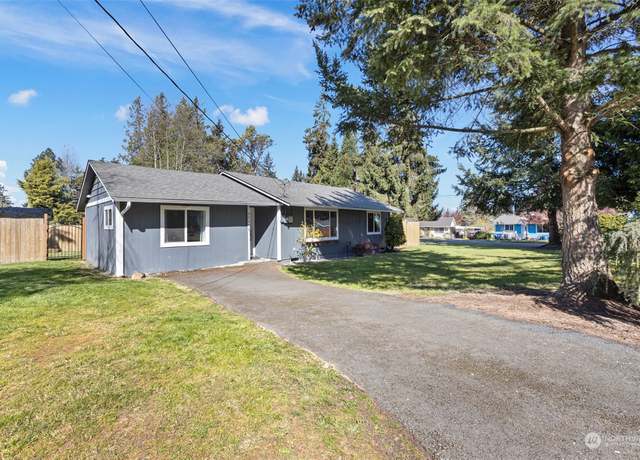
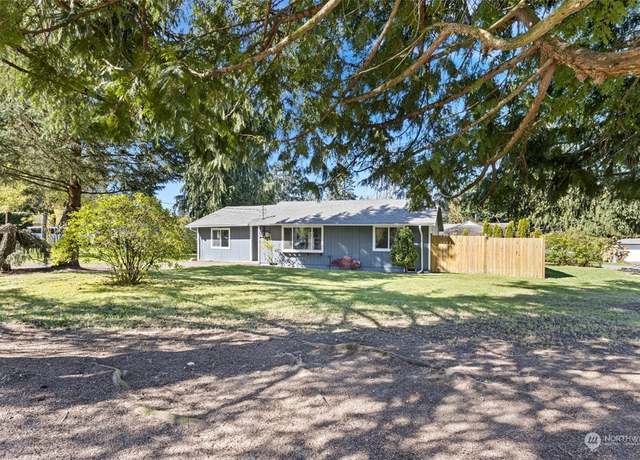
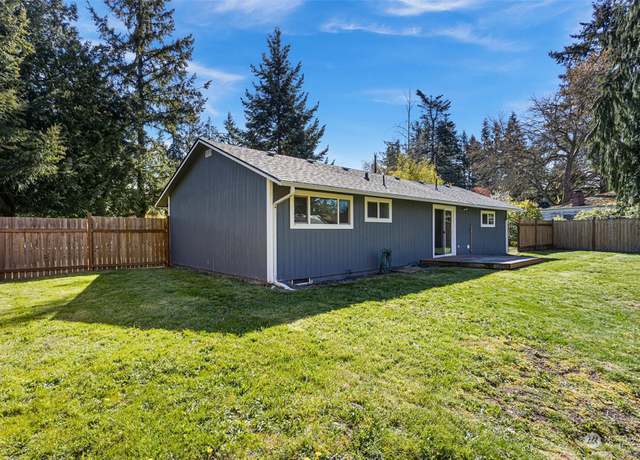
Renovated home on HUGE corner lot which has been tastefully remodeled. Enjoy your new home in a quiet neighborhood in the heart of Mountlake Terrace. Newer windows, Newer kitchen (all kitchen appliances included), NEW bathroom, Newer fence. Close to I-5 (3 mins), Ballinger Lake and Park (5 mins), and Downtown Seattle (20 mins). There's a future planned light rail station which will make commuting a breeze. Great property, come check it out. Offers due Tuesday, April 30th by 3:00 Pm
1/18
$575,000
3 beds2 baths978 sq ft8,712 sq ft (lot)
22502 62nd Ave W, Mountlake Terrace, WA 98043
Listing provided by NWMLS as Distributed by MLS Grid
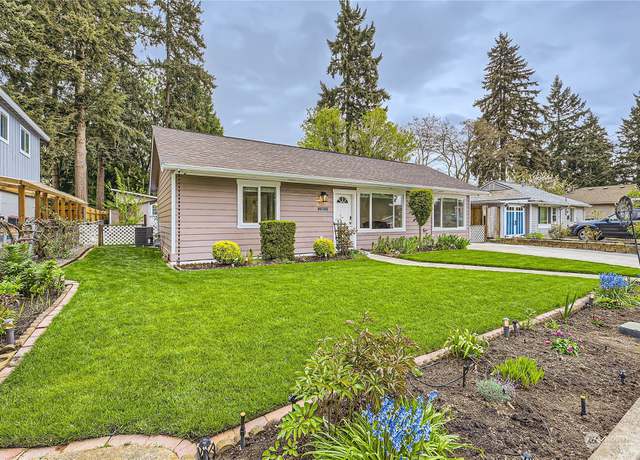
Next level SMART home built new in 2021 from the ground up! Pristine yard is the first thing you see. Close to Mountlake Terrace light rail set to open August 2024, Lake Ballinger, Nile Golf course, I-5. Make sure to ask about the attached document that lists everything this home has to offer. Full camera system from Lorex, Rachio sprinkler controller, Yale Smart Locks, Sonos system, Lutron lighting controller. WAY too much to list here, this is a must see home. Be sure to view the virtual walk through!
1/27
$829,000
3 beds2 baths1,297 sq ft7,405 sq ft (lot)
23803 54th Ave W, Mountlake Terrace, WA 98043
Listing provided by NWMLS as Distributed by MLS Grid
[CLEAN + POLISHED] This impeccably maintained home in the Atworth Commons is move in ready. Right as you step inside you are greeted with high ceilings that create an AIRY & INVITING atmosphere. The open concept floor plan has plenty of natural LIGHT with large windows & beautiful flooring. The kitchen is a dream come true with quartz countertops + stainless steel appliances +large island + tons of cabinet space. The living room is the perfect gathering spot, complete with a stylish gas fireplace. Upstairs you will find a HUGE master bedroom PLUS 2 more large bedrooms + an extra bonus room/loft + 2 full bathrooms. Peaceful backyard. Conveniently located near schools, shopping, I
$975,000
3 beds2.5 baths2,135 sq ft3,049 sq ft (lot)
21602 56th Pl W, Mountlake Terrace, WA 98043
Listing provided by NWMLS as Distributed by MLS Grid
Fully permitted remodel completed in 2024. Everything has been updated, this is a new condo inside. This is the perfect home for you! Modern styling throughout the home. New; Cabinets, Appliances, Fresh paint, Light Fixtures, Furnace, Water Heater and so much more. Less than 2 miles to light rail coming soon in late 2024 which will connect you to Seattle and the Airport. Alderwood Mall is 2.5 miles away. Safeway shopping plaza across the street. HOA fees include garbage, sewer, water, cable, landscaping and more!
$399,999
2 beds1 bath886 sq ft
4118 212Th St SW Unit C205, Mountlake Terrace, WA 98043
Listing provided by NWMLS as Distributed by MLS Grid
Sweeping views of Lake Ballinger from this beautifully maintained 2BR home! 1st time on mkt, one owner home. Spacious living & dining rm w/ FP & huge windows to enjoy the lake views. Updated LVP flooring in the entry & hallway. Fabulous & spacious cov'd deck to entertain & enjoy lakeview living! Lovely kitchen w/ plenty of cabinet storage & sxs washer/dryer in laundry rm. King size primary suite & gracious guest bdrm which could be ideal home ofc. Resort style amenities incl gym, clubhouse, sauna & outdoor pool. Enjoy the dock, parklike grounds, play area that Lk Ballinger offers. Outstanding loctn - close to new light rail station opening t
$424,950
2 beds1 bath1,029 sq ft
23507 Lakeview Dr Unit B202, Mountlake Terrace, WA 98043
Listing provided by NWMLS as Distributed by MLS Grid
Come see this very conveniently located home near the future light rail stations, freeways, and many walkable amenities. The main level features carpet and laminate floors, providing a warm and welcoming feel throughout. There is a private courtyard, offering a peaceful retreat at the end of the day. The home also includes Shelf Genie throughout making access to your cabinets a breeze. With garbage and common area maintenance included, this home offers convenience and ease. The attached tandem garage provides secure parking and additional storage space. Outside, the community gazebo offers a lovely space for outdoor gatherings. This well maintained towmhome is a common wall single family ho
$639,995
2 beds2.5 baths1,187 sq ft871 sq ft (lot)
4804 215th Ln SW #35, Mountlake Terrace, WA 98043
Listing provided by NWMLS as Distributed by MLS Grid
Corner lot/space in friendly 55+ Community, conveniently located off Ballinger Way near I-5, future light rail/transit, grocery, restaurants, bakery, Costco, Regal Cinebarre, Nile Golf Course and medical facilities. Spacious living area with tip-out. Electric forced air heat, furnace recently serviced. Double pane vinyl windows. Foundation piers recently leveled and new skirting. Brand new hot water tank. Tile floor and tile shower surround. Full size washer/dryer. Storage shed on covered front porch. New gutters and downspouts in 2021. Room for garden space. Very affordable space rent. Plenty of guest parking. Conventional financing available subject to qualifications.
$60,000
2 beds1 bath720 sq ft4.08 acres (lot)
24222 54th Ave W #6, Mountlake Terrace, WA 98043
Listing provided by NWMLS as Distributed by MLS Grid
Desirable corner lot/space in 55+ Owner Occupied, all new interiors! Originally a 4bed home, now a 2bed with bright, open kitchen, new insulation & sheetrock, paint, updated plumbing and rewired throughout w/ new breakers. Heat pump with A/C heating and cooling, tankless H20, heated flooring in bathroom w/ double Lotus sinks and cast iron tub w/ jets. Gas top cooking with electric oven and shaker cabinets, too many upgrades to mention. Ready for new owner in a convenient location off Ballinger Way near future light rail, grocery, restaurants, Costco, and medical facilities. South facing courtyard with potential for deck, storage shed and assigned parking. $4k buyer credit avail, ask f
$150,000
2 beds1 bath— sq ft
24222 54th Ave W #19, Mountlake Terrace, WA 98043
Listing provided by NWMLS as Distributed by MLS Grid
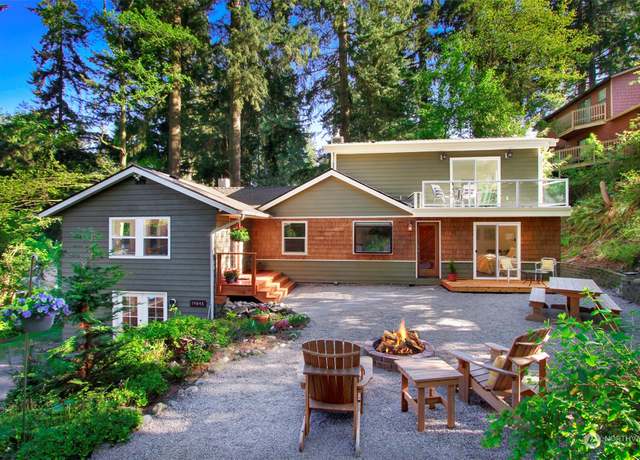
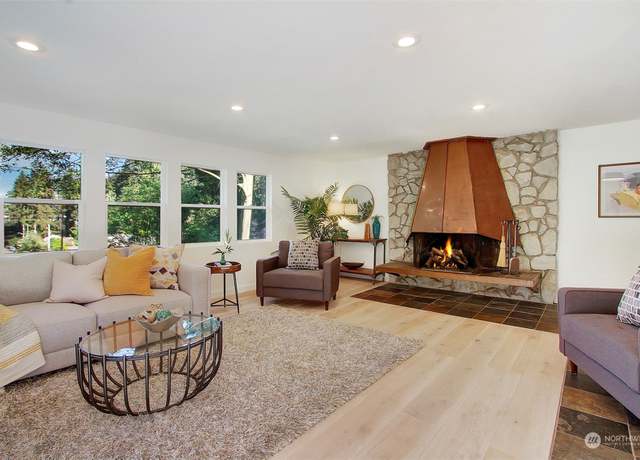
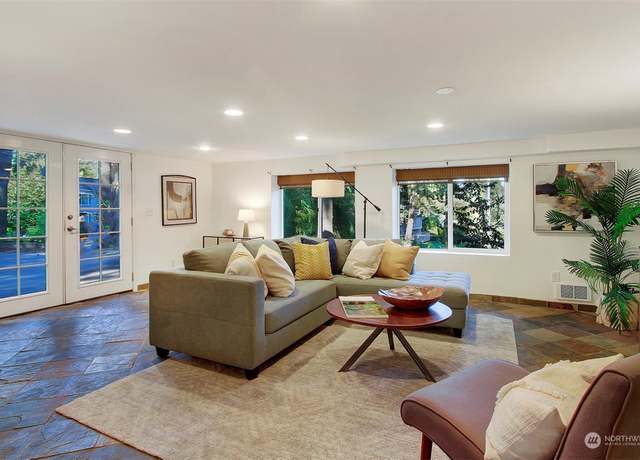
Stunningly remodeled Echo Lake home nestled on . 29 acres. This 3 bed /3 bath NW contemporary is a private oasis in-city retreat! This home boasts a large living room with tons of natural light, territorial views and a wood burning FP. The open kitchen with true high-end appl. and seamless outdoor experience is perfect for entertaining. The homes generous master bedroom has vaulted ceilings, a full on-suite featuring radiant floors and steam shower, plus a large walk-in closet. The fully remodeled daylight basement features an oversized family/bed room for the big game, movie night or craft room! Walking distance to Light Rail. Coveted Shoreline school Dist. Off-street RV parking an
1/13
$899,950
3 beds3 baths2,500 sq ft0.29 acre (lot)
19845 6th Ave NE, Shoreline, WA 98155
Listing provided by NWMLS as Distributed by MLS Grid
This condo bldg in Edmonds has 4 units. Spacious 1567sqft living space. Inside entrance has a coat, shoes, storage area. Kitchen is big & bright w/ a pantry. A door leads out to small deck and two steps down to huge fully fenced backyard. Room for a garden & concrete pad for basketball or leisure activities. The living room has big picture windows looking to the back yard. Master has en suite & walk in closet. The 2 other bdrms are large w/ oversize closets. W/ D are upstairs & all appliances are included. Carpets cleaned, freshly painted outside & new roof in 2018. Water heater is 2 yrs old. Window coverings stay & new insulation under unit. Pet friendly
1/25
$545,000
3 beds2.5 baths1,567 sq ft
23601 79th Ave W #3, Edmonds, WA 98026
Listing provided by NWMLS as Distributed by MLS Grid
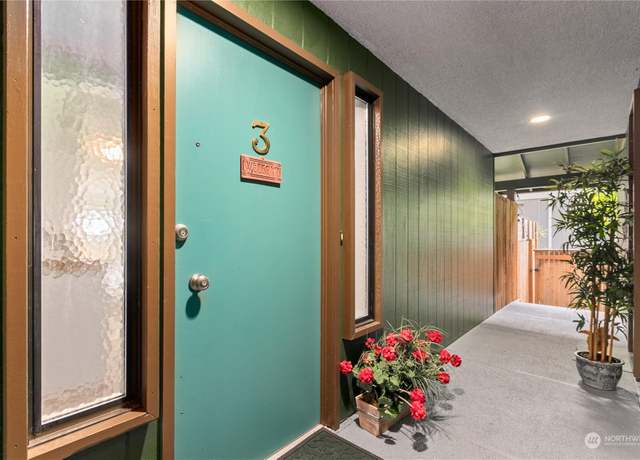
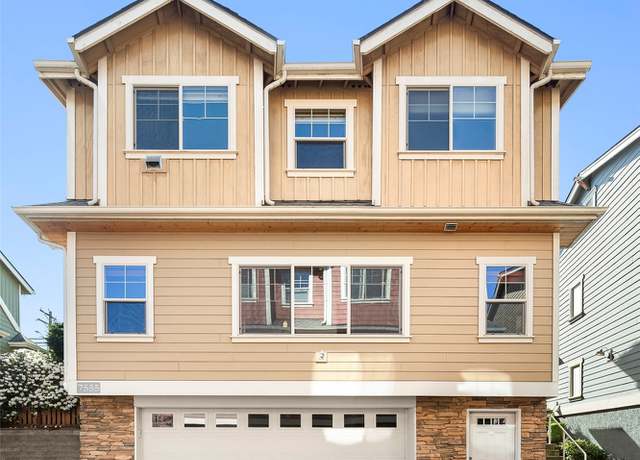
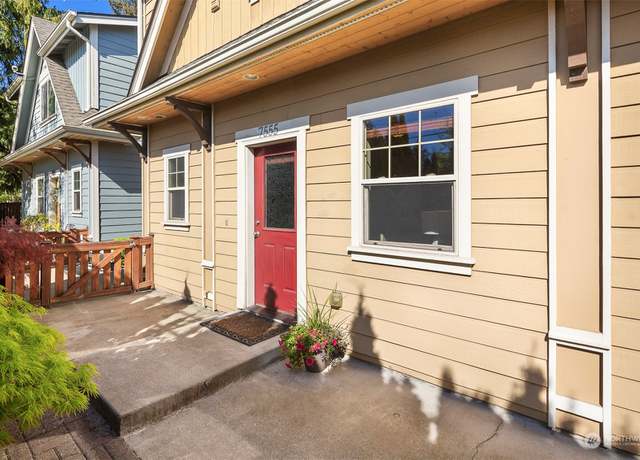
{{Cascade Cottages}}, where refined living meets unparalleled convenience, an enclave of 16 private residences. This meticulously maintained detached 2-bed, 2.5 ba townhome is a testament to comfort and functionality. Step inside to discover premium bamboo flooring, quartz countertops, & stylish subway tile accents that evoke a sense of timeless elegance. The heart of the home features a large breakfast bar, Kohler farm sink, & upgraded appliances, offering both practicality & sophistication. Entertain effortlessly on the private front patio, perfect for barbecuing & enjoying al fresco dining. The oversized two-car garage with a storage room ensures ample space for all
1/28
$675,000
2 beds2.5 baths1,437 sq ft2,178 sq ft (lot)
7555 210th St SW, Edmonds, WA 98026
Listing provided by NWMLS as Distributed by MLS Grid
Charming mid-century home with open concept layout + exquisite renovations throughout. Interior spaces are bright with a stylish + modern color palette. Two living areas are accented by inviting fireplaces. Stunning kitchen features tasteful quartz counters, striking white cabinets + stainless appliances. Private primary bedroom with ensuite. Two full baths are expertly updated. Fantastic outdoor space with fenced + terraced backyard. Patio provides ideal spot for entertaining in warmer months. Towering trees create idyllic + secluded natural setting. Recent electrical, plumbing, roof + A/C. Located in highly regarded Shoreline School District, near major commuter routes, dining + parks.
1/34
$949,900
3 beds2 baths1,780 sq ft8,375 sq ft (lot)
20121 7th Ave NE, Shoreline, WA 98155
Listing provided by NWMLS as Distributed by MLS Grid
Wonderful top floor spacious 1 bedroom condo facing east. Enjoy beautiful sunrises with panoramic views. This unique location includes birds eye views of the Edmonds/Woodway ball fields. Brand new appliances include: frig, range and built in microwave. Lots of in unit storage with an additional secure storage locker. Private covered deck with a right field bleachers feel. The entire complex has received a new roof, wiring and plumbing upgrades recently. Convenient location and near everything Edmonds has to offer.
1/32
$248,950
1 bed1 bath670 sq ft
7924 212th SW #312, Edmonds, WA 98026
Listing provided by NWMLS as Distributed by MLS Grid
Welcome to this secluded home in Shoreline a hub of convenience to downtown Seattle with the link light rail. This gated sanctuary greets you at this unique home surrounded by nature, privacy and solitude yet minutes from everything and the upcoming light rail. Family room, laundry room, office (or bedroom. ) Freshly painted. Huge rec room is a blank slate for your vision with endless possibilities. The flag lot on the right is also being conveyed in the sale. Bring your vision and even look to expand on this already great property by adding bath/shower, completely enclosed 2 car garage and ADU. This move in ready home has lots of possibilities.
1/27
$725,000
4 beds1.5 baths1,920 sq ft0.31 acre (lot)
20043 12th Ave NE, Shoreline, WA 98155
Listing provided by NWMLS as Distributed by MLS Grid
[Artist's Retreat] Beautiful, move in ready 1-level home on a huge lot within walking distance to Lake Ballinger beaches! Freshly painted throughout with vinyl plank floors, stainless steel appliances, crown molding, large picture windows & centerpiece stone fireplace. Open concept interior design w/ easy flow through double sliders to the oversized slate tile entertaining patio, where your incredible backyard oasis awaits! Primary BR w/ updated ensuite bath. Expansive lot for D/ADU potential. Turnaround driveway w/ RV parking & 2 outbuildings (storage shed/shop & hobby room). PRIME location just 3 miles to Edmonds Ferry & less than 1 min to Shoreline. Easy commute t
$799,900
3 beds2 baths1,437 sq ft0.25 acre (lot)
23314 76th Ave W, Edmonds, WA 98026
Listing provided by NWMLS as Distributed by MLS Grid
Great location in the center of all. 2 Bed + bonus room/1.5 Bath townhome style condo closed to golf, shopping, restaurant and Edmonds College. New paint throughout, fenced private back yard. EZ access to Hwy99, park & ride, & I5.
$390,000
2 beds1.5 baths1,019 sq ft
20620 76th Ave W Unit G, Edmonds, WA 98026
Listing provided by NWMLS as Distributed by MLS Grid
This spacious corner, two bed/two bath condo home with excellent features such as openness with sun poring through windows ! Well equipped kitchen w/ sleek quartz counters, SS appliances & breakfast bar. Oversized slider opens to private covered deck set in the trees! Abundance of in-unit storage, laundry, large master suite, parking, & storage in building. This condo caters to all your lifestyle needs! Close to great schools, hospitals, minutes to downtown Edmonds, easy access to main thoroughfares & more! New roof, wiring and plumbing means low maintenance for years to come.
$355,000
2 beds2 baths929 sq ft
7924 212th St SW #214, Edmonds, WA 98026
Listing provided by NWMLS as Distributed by MLS Grid
Enjoy the Brier Lifestyle. Spacious (over 4000 square feet) two story home with 4 bedrooms and utility room upstairs. Home has a brand new Roof, is Freshly painted and has new carpets and new vinyl. 5 plus garages Tons of storage with a 3 car garage, another 1 plus car attached garage and a downstairs heated garage with storage. The backyard is an Oasis with an inground pool. Large Patio and new lawn. Huge entertainment area with wet bar overlooking pool area. The backyard is secluded and fenced. Virtual Tour and Matterport Tour in listing 3 Fireplaces plus indoor barbeque.
$1,500,000
4 beds3.5 baths4,050 sq ft0.59 acre (lot)
3201 228th St NW, Brier, WA 98036
Listing provided by NWMLS as Distributed by MLS Grid
Based on information submitted to the MLS GRID as of Fri Apr 26 2024. All data is obtained from various sources and may not have been verified by broker or MLS GRID. Supplied Open House Information is subject to change without notice. All information should be independently reviewed and verified for accuracy. Properties may or may not be listed by the office/agent presenting the information. Some IDX listings have been excluded from this website.
School data is provided by GreatSchools, a nonprofit organization. Redfin recommends buyers and renters use GreatSchools information and ratings as a first step, and conduct their own investigation to determine their desired schools or school districts, including by contacting and visiting the schools themselves.Redfin does not endorse or guarantee this information. School service boundaries are intended to be used as a reference only; they may change and are not guaranteed to be accurate. To verify school enrollment eligibility, contact the school district directly.
Mountlake Terrace, Washington, offers a variety of transportation options to its residents, including a well-structured public transportation system. The city is served by buses and a Sound Transit light rail station, providing easy access to surrounding areas. For those who prefer to travel by car, traffic levels can vary, with peak hours typically seeing higher congestion. Additionally, Mountlake Terrace is conveniently located near major highways, including Interstate 5, making it a convenient hub for drivers. Learn more on our Mountlake Terrace city guide.
What types of properties are available in Mountlake Terrace?
Mountlake Terrace, Washington offers a variety of single-family home types, including ranch-style homes, split-level homes, and contemporary homes. These homes can be found throughout the city, with ranch-style homes predominantly located in the southern part of Mountlake Terrace, split-level homes scattered throughout the city, and contemporary homes primarily situated in the northern neighborhoods. Most properties feature three to four bedrooms and were built between the 1950s and 1980s. To explore different property types for sale in Mountlake Terrace, Washington, use the 'Home type' filter located above the active listings. Customize your search by selecting options like single-family homes, condos, townhomes, and more.
What is life like in Mountlake Terrace?
Mountlake Terrace, Washington offers a serene and picturesque environment with its lush greenery and stunning views. The landscape is characterized by rolling hills and beautiful parks, providing ample opportunities for outdoor enthusiasts to explore and unwind. The weather in Mountlake Terrace is mild, with cool winters and warm summers, allowing for a variety of recreational activities year-round. The town boasts a range of job opportunities in various industries, ensuring residents have ample options for employment. Additionally, Mountlake Terrace offers a vibrant community with a plethora of local events and activities, providing residents with plenty of entertainment options.
What are the schools and amenities like in Mountlake Terrace?
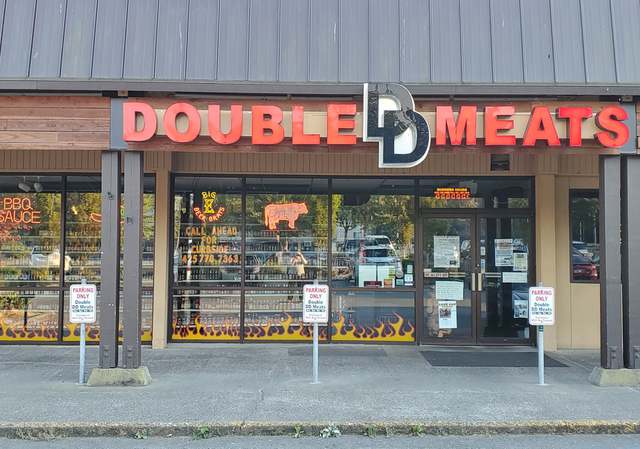
Mountlake Terrace, Washington, boasts a variety of public amenities for its residents. There are numerous restaurants offering a wide range of cuisines for the food lovers. For those who enjoy the outdoors, there are several parks available for leisure and recreation. Grocery stores are conveniently located throughout the town, making everyday shopping easy. Additionally, more amenities such as fitness centers, libraries, and schools are available, enhancing the quality of life in Mountlake Terrace.
In the past month, 5 homes have been sold in Mountlake Terrace. In addition to houses in Mountlake Terrace, there were also 4 condos, 1 townhouse, and 1 multi-family unit for sale in Mountlake Terrace last month. Mountlake Terrace is a moderately walkable city in Snohomish County with a Walk Score of 52. Mountlake Terrace is home to approximately 19,671 people and 5,171 jobs. Find your dream home in Mountlake Terrace using the tools above. Use filters to narrow your search by price, square feet, beds, and baths to find homes that fit your criteria. Our top-rated real estate agents in Mountlake Terrace are local experts and are ready to answer your questions about properties, neighborhoods, schools, and the newest listings for sale in Mountlake Terrace. Our Mountlake Terrace real estate stats and trends will give you more information about home buying and selling trends in Mountlake Terrace. If you're looking to sell your home in the Mountlake Terrace area, our listing agents can help you get the best price. Redfin is redefining real estate and the home buying process in Mountlake Terrace with industry-leading technology, full-service agents, and lower fees that provide a better value for Redfin buyers and sellers.


 REDFIN IS COMMITTED TO AND ABIDES BY THE FAIR HOUSING ACT AND EQUAL OPPORTUNITY ACT. READ REDFIN'S FAIR HOUSING POLICY AND THE NEW YORK STATE FAIR HOUSING NOTICE.
 United States
 Canada