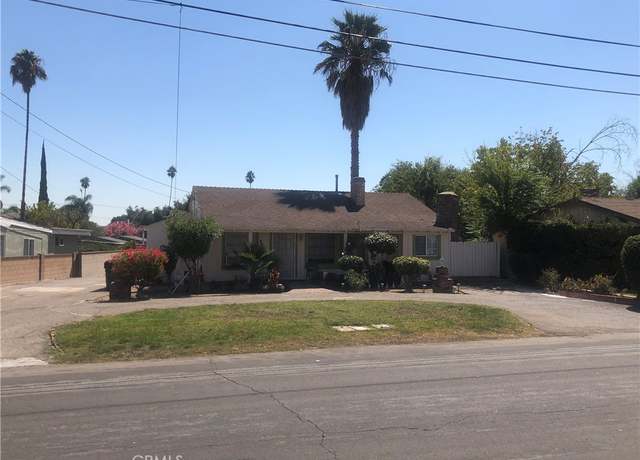
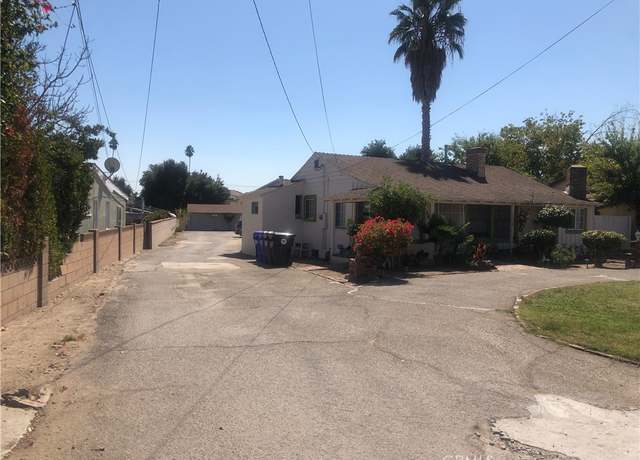
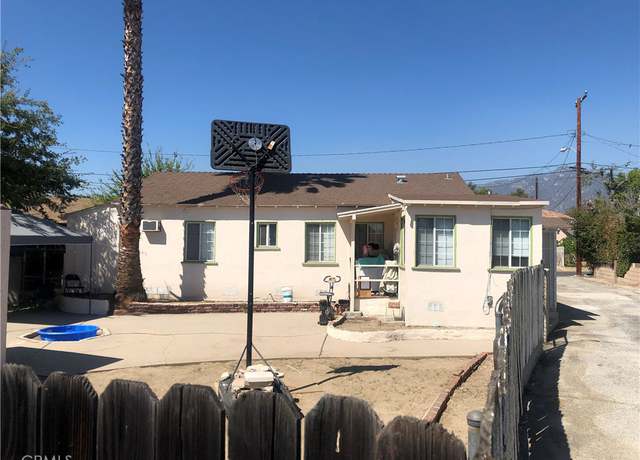
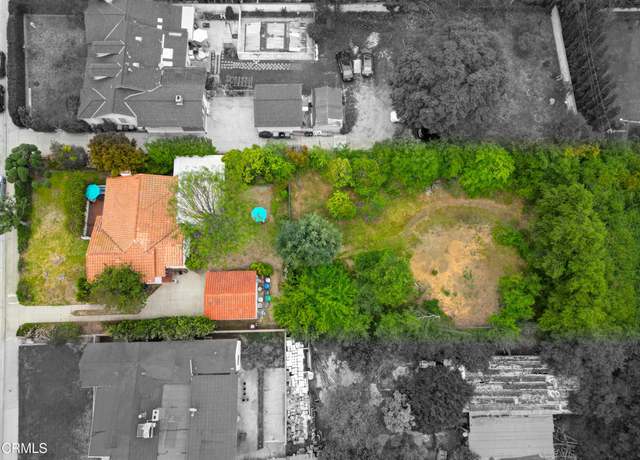
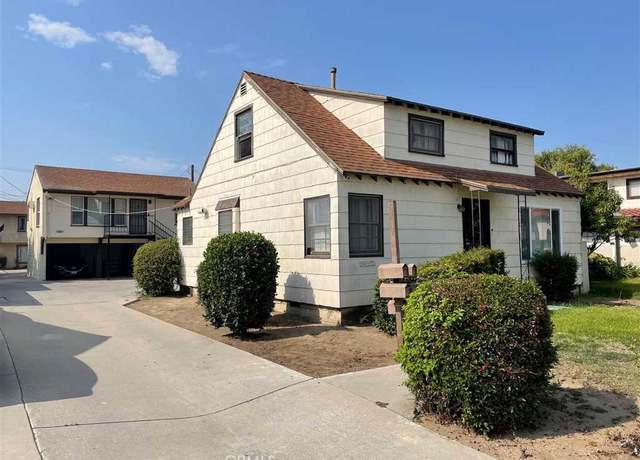
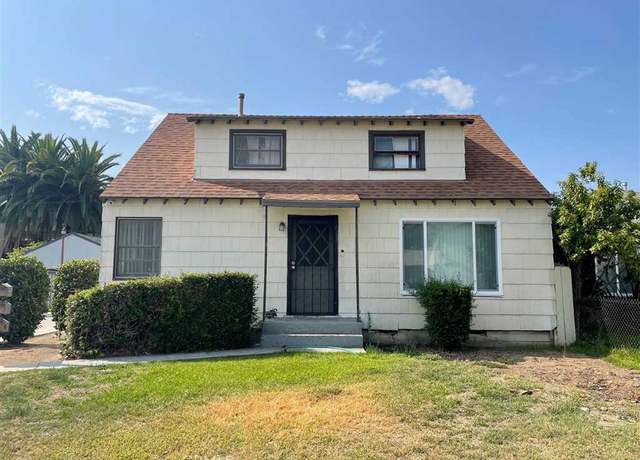
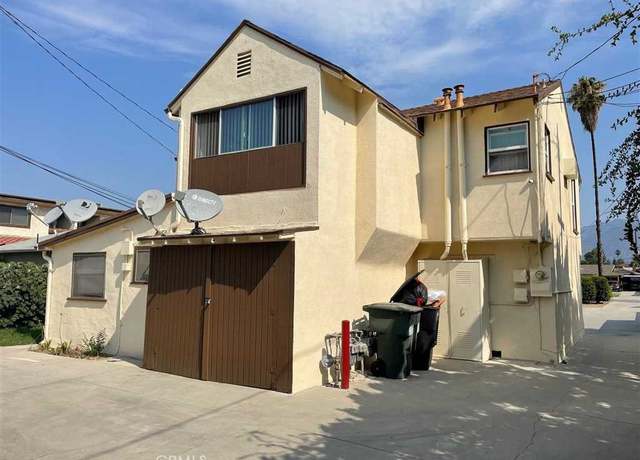
Excellent property in desirable North San Gabriel, just blocks away from Chapman Woods and Arcadia. 3 separate homes. Large 19,194 SF lot is a great investment opportunity for investors and builders. Potential to build 3 single family homes up to 3,000 SF each (Buyer to verify with County). All units currently occupied with stable long term tenants. Each unit has their own gas, electric and water meters and all utilities paid for by tenants. Very conveniently located near supermarkets, restaurants and shopping.
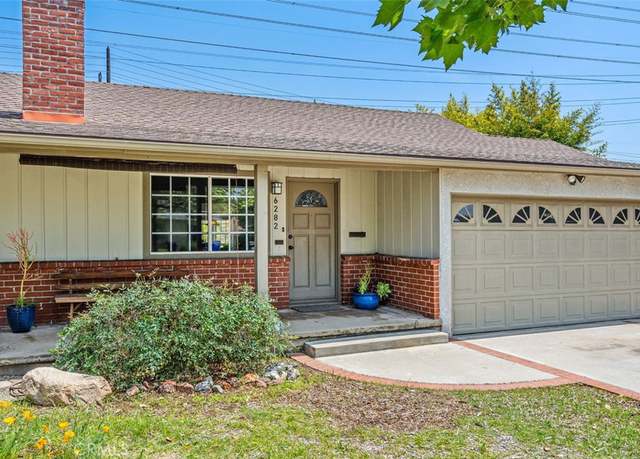
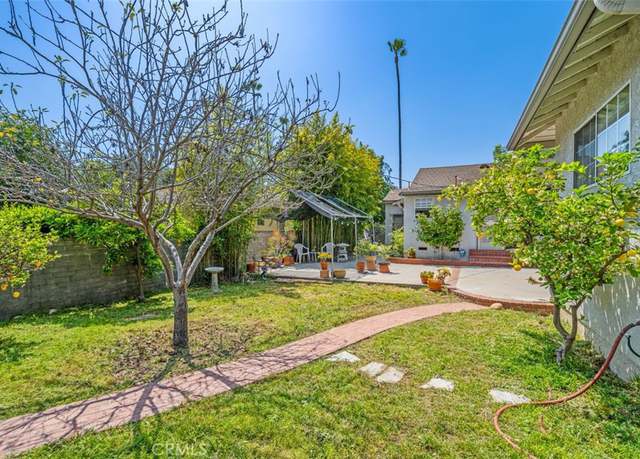
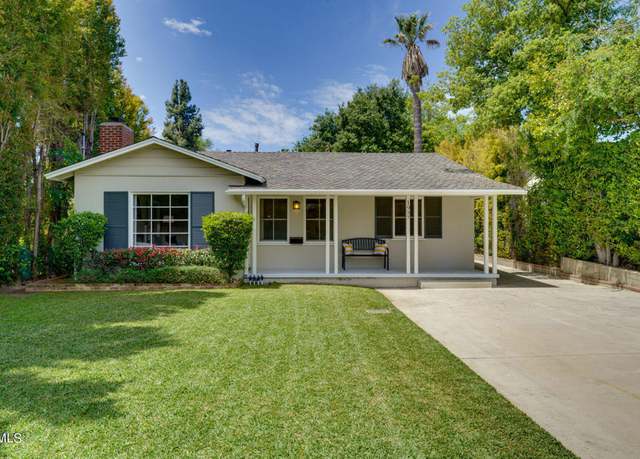
This beloved ranch-style home, cherished by the same family for 50 years, is now available in a highly sought-after East San Gabriel neighborhood near Longden and San Gabriel Boulevard. You'll be greeted by a cozy living room featuring a beautiful fireplace as you enter. The dining room seamlessly connects to a sunlit den, providing the ideal space for relaxation while enjoying the view of the backyard. In addition to the inviting interior, there is a dedicated family room with a convenient wet bar, a private primary suite, and an additional suite that offers a tranquil retreat. Adjacent to the living room, you'll find a bedroom and a full bath, while on the other side of the house, there i
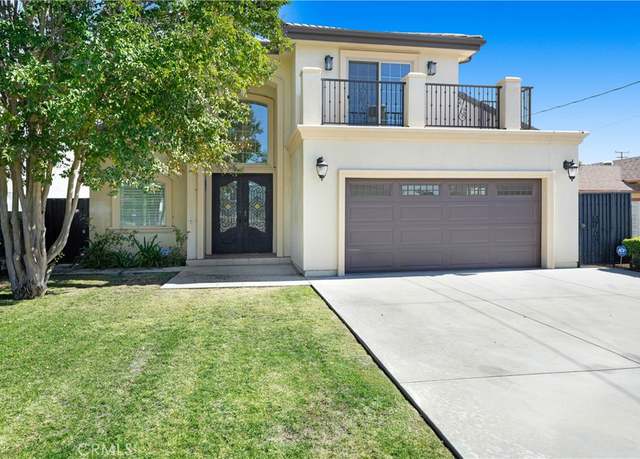
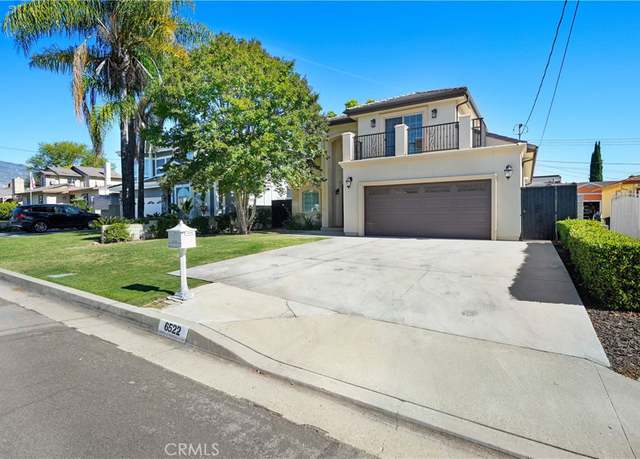
Welcome to this stunning home, nestled in the heart of Arcadia. This newly constructed house has 2230 sqft with 4 bedrooms and 3.5 bathrooms. A grand double-door entrance welcomes guests with a vaulted ceiling, elegant staircase, and great living room. One bedroom suite downstairs, perfect for a guest room or a home office. Upstairs has 3 bedrooms with a lot of nature lights. The master suite has a walk-in closet and double sink bathroom. Convenience is key with this home, as it is within walking distance to award-winning schools and close to shopping centers, restaurants, and freeways, everything you need is just moments away. Don't let this opportunity pass you by—make this your dre
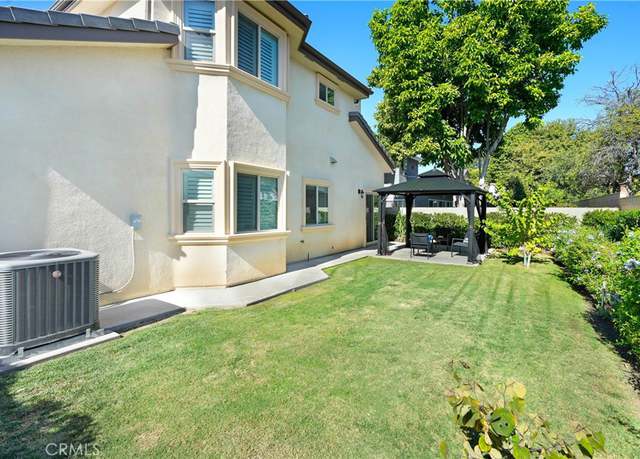
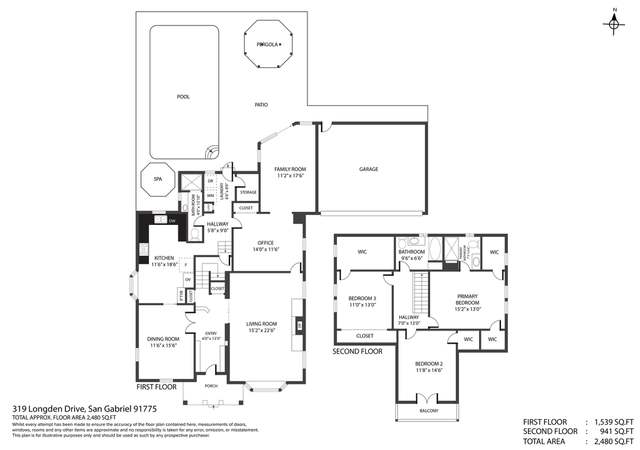
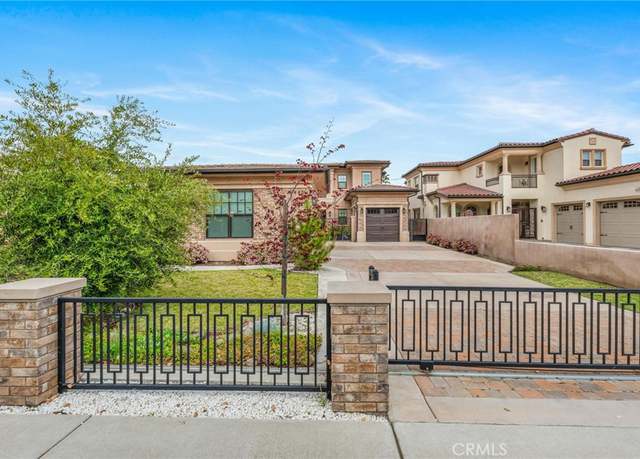
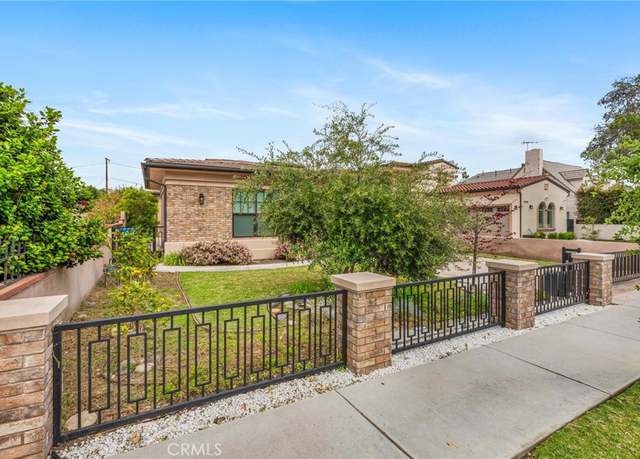
This charming single level home with 4 bedrooms and 3 baths is situated on a vibrant street, providing easy access to amenities such as markets, restaurants, schools, San Gabriel Country Club and transportation. The convenience of single level living makes this home accessible and functional for all family members. Tall privacy hedges with expansive front lawn and covered porch provides for a generous set back from the street. The thoughtfully designed floor plan allows for great flexibility for entertaining and extended family living. The bright and open interior, including a new skylight, features a cozy fireplace in the living room, open to dining/family room area. The kitchen has new ap
Welcome to this charming starter home in San Gabriel. As you enter you are greeted by a spacious and open concept living and dining room. Beyond the living room you will find the kitchen which is equipped with plenty of cabinetry and a conveniently located pantry. Down the hallway you will find the two nice sized guest bedrooms and the large guest bathroom, At the end of the hallway is the primary bedroom which has its on en-suite bathroom, oversized closet and private outdoor patio area. Through the kitchen area you will find the covered patio, manicured backyard and some mature fruit trees. The attached two-car garage is accessible through the backyard and is where you will find ample sto
Good investment property in good location of City San Gabriel, with big lot 19,492sf, total living 3,078sf Front house 2 bed 1 bath Midle house 4 bed 2 bath Rear house 2 bed 1 bath Please do not distub tenant, offer subject to inspection
This newly updated condominium is nestled in the vibrant heart of Arcadia within the esteemed gated community of Vista Colina. Impeccably remodeled, this 2-bedroom, 2-bathroom residence boasts a seamless open floor plan with fresh paint throughout. Step into the brand-new kitchen, a culinary masterpiece featuring pristine quartz countertops including a brand new stove, microwave, and dishwasher, as well as sleek cabinetry. The living room flows effortlessly into the dining area and kitchen, complemented by an enclosed patio—ideal for a den or study (not included in the square footage). Retreat to the master bedroom, complete with an en-suite bathroom showcasing a new countertop, and u
Welcome to the market, E. Lemon Ave. Discover this exceptional triplex, tailored for investors seeking lucrative residential income. Aside from providing tenants with comfortable living spaces each unit generates a stable income. Located in a high-demand area, this property has a strategic location. This triplex presents a golden opportunity to expand your portfolio and secure passive income. Located in a charming neighborhood of Arcadia, the property offers easy access to local amenities and attractions. Conveniently located less than half a mile from local grocery stores and dining options making errands a breeze. Students and their families will appreciate it's proximity to the schools,
Welcome to this stunning, gated residence nestled in the serene northern part of San Gabriel. Meticulously crafted by San Marino homes, inc. for the corporate president and this sqft according to today's standard is no longer approvable by the county. This exquisite home showcases exceptional craftsmanship, top-tier materials, and exquisite details throughout. The adaptable floor plan features a large, open family room with three fireplaces, an opulent master suite with a raised tatomi room, two walk-in closets, and a substantial bonus room that can function as a home office or additional bedrooms. Boasting six spacious bedrooms, this home effortlessly combines elegance and ample room. The
Welcome to this stunning 2,977 square foot residence, nestled on a sprawling 7,375 square foot lot in the heart of San Gabriel. This exquisite home boasts five bedrooms and four bathrooms, offering ample space for comfortable living. With a convenient main floor bedroom and office, this property provides versatility and functionality for various lifestyle needs. Outside, the front gated yard ensures privacy and security, while the backyard offers a tranquil oasis for relaxation and entertainment. Additionally, this property features a three-car garage, providing ample parking and storage space for your convenience. Located in the vibrant community of San Gabriel, this home offers easy acces
Tri-level condo which features 4 bedrooms, 3 bathrooms and plenty of storage. Primary suite features a walk-in closet, separate vanity, 4-piece bathroom and French doors leading to private rooftop patio. Kitchen renovated in 2015 with white cabinets, butcher block countertops and soft close drawers. Living room has high loft-like ceilings adjacent to 4th bed/den with a huge walk-in closet. Small fenced in yard with French doors that open to the patio and a private garage with tons of storage. All new double-pane vinyl windows installed in 2015, new water heater and upstairs carpet in 2022, new HVAC in 2023. Located in a quiet neighborhood at the nexus of East Pasadena, San Marino, San Gabri
Totally 2 units (3 bedrooms and 2 bathrooms + 2 bedrooms and 2 bathrooms) Get ready to be blown away by this stunning single-story gem nestled in the sought-after North San Gabriel area, boasting the coveted Temple City Schools! This beauty flaunts 3 bedrooms and 2 bathrooms, showcasing an inviting open floor plan with a whopping 1,726 sq ft of spacious living area. The previous owner of the seller has added 2-bedroom with 2-bathroom (without permit) next to the house for a big bonus could be as separate rooms or extra rooms for total 2770 sq ft! But wait, there's more! Picture yourself on a generous lot spanning 6,412 sq ft, surrounded by a beautifully landscaped yard. This fabulous home
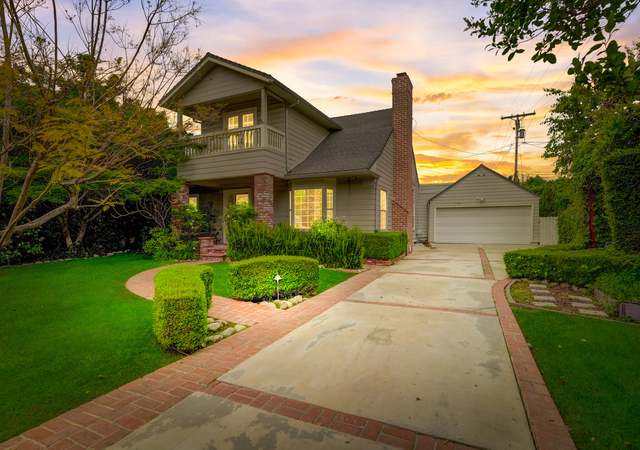
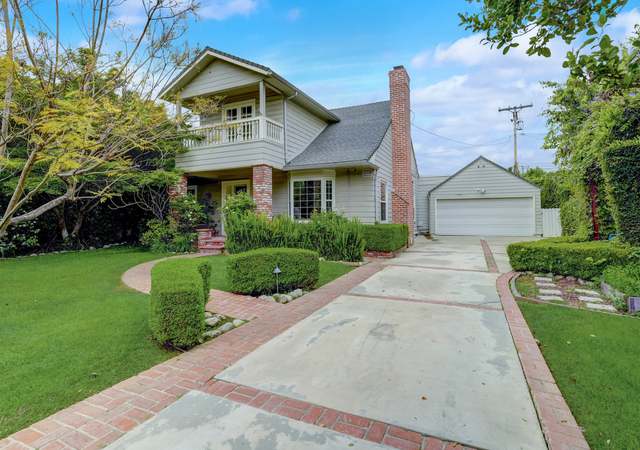
Welcome to your dream colonial-style family home in the heart of North San Gabriel! This stunning two-story residence boasts 3 bedrooms, 3 baths, and a generous 2,438 square feet of living space, providing ample room for both comfort and luxury. Step inside and be greeted by the elegance of hardwood flooring throughout, complemented by the modern touch of granite countertops in the kitchen. The kitchen itself is a chef's delight, featuring ample cabinetry, stainless steel appliances, and a convenient multi-functional pass-through 4th room that can serve as a versatile space for either a bedroom or an office, catering to your family's unique needs. Entertain guests in style in the formal din
* * Welcome to Your New Home at 6440 Oak Ave, Temple City * * Nestled in the desirable area of Temple City, this impressive 5-bedroom, 4.5-bathroom house invites comfort and elegance into everyday living. Spanning an expansive 3,568 square feet, the residence caters generously to both large family gatherings and intimate occasions. Step inside to discover a functional layout that includes two well-appointed kitchens featuring top-of-the-line appliances that promise culinary delights and ease of entertaining. The custom-made cabinets and beautifully crafted stairs add a touch of sophistication throughout the home. Natural light streams through large windows, creating a warm and welcoming
This FIXER UPPER property has endless possibilities! The existing home is located on the front portion of the almost half acre lot. Bring your contractor and your imagination! The back portion of the lot could easily accommodate a large pool and pool house! For buyers looking to build a whole new house - they could locate the house on the back of the lot and have a gated circular drive at the front. The property is in a trust. The trustee has completed a general home inspection & termite inspection. Both reports are attached to the MLS listing. The property is being sold in it's ''AS IS'' condition and the seller will not complete any repairs. See 'Preliminary Title Report' &
We are pleased to present Elm Apartments, a 4+1-unit apartment community in San Gabriel, CA. The property consists of large 2 and 3-bedroom units with 1 non-conforming studio, providing an investor with an additional income stream. The units are spacious with in-unit washer and dryer hookups and have been renovated with vinyl flooring, stainless steel appliances, and granite countertops. With strong in place rents, the property generates a current cap rate of 4%, 6.1%, with market rents, offering an investor roughly 33% upside. Since this property is legally 4 units, an investor can also benefit from favorable residential financing, making it a perfect fit for investors seeking a well-locat
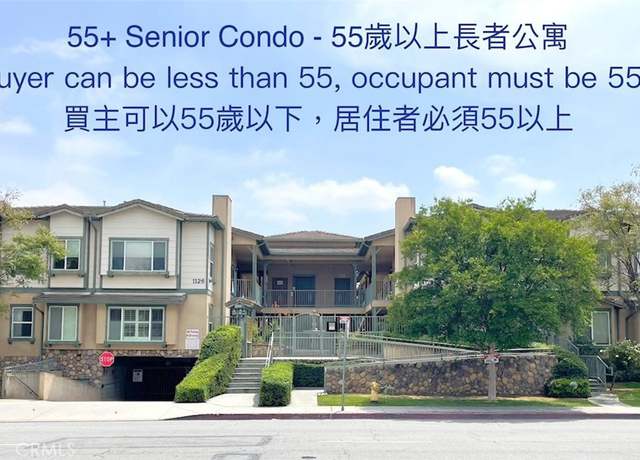
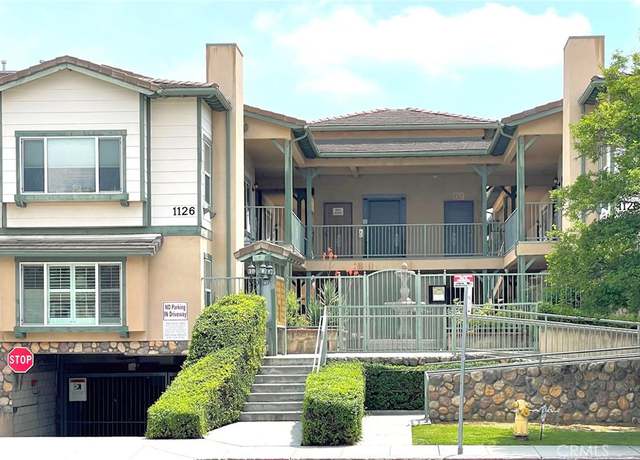
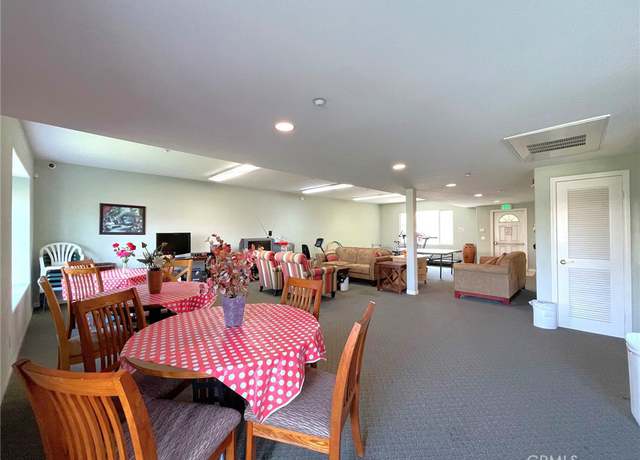
55+ Senior Condo in a gated community. Buyer can be younger than 55, but occupant must be 55 or older. Low HOA dues: $220 per month. Single level property is in move-in ready condition with a private back yard, brand new interior paint, new laminate wood floor in both bedrooms, new garbage disposal, new shower fixtures in master bath, wood shutters, central A/C and heat, in-unit laundry closet with washer and dryer hook ups, dual pane windows, kitchen with granite countertop and lots of cabinets. Spacious living room with fireplace, master bedroom with walk-in closet, and over sized bathrooms. Security system pre-wired, 2 side-by-side parking spaces in secured underground parking lot (space
BEST & LOWEST PRICE ON MARKET. Opportunity is knocking. This single family home features 3 bedroom and 2 bath in the heart of San Gabriel (Title shows 2 bedrooms and 1 bath. Property is physically 3 bedrooms and 2 baths. Permits unknown. Title shows 560 living sf. and property is estimate 743 sf. ). New Exterior and Interior Paint, New Kitchen, Laminated Flooring and Updated 2 Bathrooms. Open floor plan is perfect for families seeking a good size living space. Open Kitchen adjacent great size dining area. Gated long concrete driveway with plenty of parking space. Perfect home for entertaining and excellent location to all major shopping and business areas.
* * Land for Sale * * Opportunity to build your dream home! Located in the highly desirable Chapman Woods enclave of Pasadena. This flat lot spans nearly an acre (30,091 SF) of flat useable land. This expansive gated parcel provides a blank slate for envisioning and creating the perfect residence tailored to your desires, meticulously crafted to reflect your lifestyle and preferences. Enter through a private gate on Huntington Drive with only 3 other homes behind the main gates. A second gate leads to the ultra-private lot that borders 5 city acres, this city parcel can be maintained and used, but cannot have a structure built on that part of it. Close proximity to all that Pasadena/San
Exquisite detached condo boasting a private front and rear yard, with NO H. O. A fees. This newer Temple City home is situated in a highly sought-after locale, within walking distance to Longden Elementary School. Enjoy the convenience of nearby amenities including supermarkets, shopping centers, banks, restaurants, and transportation options. Located within the esteemed Temple City School District, this residence offers 4 bedrooms, 3 baths, plus a loft, spanning 1,962 square feet of living space. Notable features include central air/heat, a grand double door entry with a spiral staircase, custom carpets, a separate laundry room, and a private yard. The spacious formal living room showcases
Nestled in the sought after Santa Anita Village area of Arcadia you'll find this 3 bed 2 bath gem flooded with light, original built-ins, a fireplace, hardwood floors and possibility. Situated on a 7,826 square foot lot awaiting design and transformation. Minutes to Hugo Reid Elementary School, The Shops at Santa Anita, The Arboretum, restaurants, and transportation. Make magic with this limitless canvas of opportunity, where the possibilities are endless!
Nestled on a tree-lined street in prestigious San Marino, this move-in ready exquisitely designed traditional home offers a refined and sophisticated lifestyle. Situated on a generous 9441 sqft rectangular lot, set back from the street and framed by mature trees, this well-maintained property welcomes you w/ a long, gated driveway and a two-car detached garage. The house was extensively renovated, including modernization of kitchen & baths, whole house copper piping & updated electrical wiring. The interior, illuminated w/ natural light & enhanced by abundant picture windows, offers a seamless blend of modern amenities & timeless elegance. Light wood floors, crown mo
Discover the elegance of the PUD townhouse situated in a quiet neighborhood in the heart of Arcadia, enjoys an unbeatable location near Schools, H-Mart, 99 Ranch Market, The Shop at Santa Anita, and the Los Angeles County Arboretum. This detached PUD home built in 2000, it features 3 bedrooms and 2.5 bathrooms spread across 1,880 SqFt of living space with a functional layout offering large principal rooms throughout. The spacious living room welcomes you with a fireplace and high ceilings adorned with a stunning chandelier. Well-located double-paned windows ensure ample natural light throughout the property. The upgraded kitchen boasts granite countertops, dual sinks, a walk-in pantry, and
This Single Family House is located in the heart of Temple City. Great Location! Great Temple City School District ! Total 7 bedrooms and 5 bathrooms. Freshly renovated 3 bedrooms and 1 bathroom a few days ago! Huge lot (8450sqft) has two parcels with zone R-3 which when combined would present a great opportunity for future development that would produce excellent returns. Zoning code may allow up to 3-story construction. Total stable rental income $8,400/month now. Great income property ! Price included 2 parcels: front 5384-016-016 & rear 5384-016-020. Great investment opportunity (guest house with city permits in the backyard. No permits guarantee. Not matching county record)
This is a wonderful Arcadia offering units. There are 3 buildings, Front is house 2BR, 1BA has central air/heat. units A-E are townhouse style 2 story with 2BR, 1.5 BA each. Additional 5 units are 1BR, 1BA. 22 total parking spaces. On-site laundry room. Separate electric and gas meter for each unit. All units have their own water heater. Owner pays water, trash & gardener. Close to everything you need and desire, markets, shops, restaurants, banks, schools, parks, movie theaters, golf course, arboretum, public transportation, and 99 Ranch Market. Buyer to cooperate with the sellers in a 1031 exchange at no expense to the buyers.
Overlooking the San Gabriel Country Club, on one of the best streets in all of San Gabriel, this stunning English Tudor comes to market for the first time in 31 years! Meticulously maintained and thoughtfully updated, this home boasts an abundance of charm and original character throughout. Upon entry, a formal living room with vaulted ceilings, fireplace, and beautiful wood floors, gives a sense of grandeur and sophistication. The single level floorplan offers a tastefully renovated kitchen, formal dining room, and a den that could be used as an office. As you continue down the hall, three spacious bedrooms and three bathrooms (two ensuite) await you. The sprawling lot allows for magical g
Located in the heart of Rosemead, this 4 bedroom, 3 bathroom home features a 2 car garage and a spacious backyard adorned with many fruit trees of which include lychee, guava, tangerine, and many more. The property is situated close to many large grocery centers and markets. The residence has a flat lot which is convenient for an ADU. The home is located in a wonderful and safe neighborhood and is close to Savannah Elementary School and Rosemead High School.
Rare investment and income opportunity in the heart of Temple City. This well maintained Triplex possesses charm, character and strong rental income capabilities. Commercial and Residential zoning flexibility. 3 separate addressed, single story units with no common walls. Each unit is approximately 590 sf and features: 1 bedroom, 1 bathroom, living room, kitchen with eating area. There are 3 total parking spaces, one for each unit in the rear and with alley access. 3 electric meters; 3 gas meters; one water meter. Temple City Schools and centrally located near restaurants, shops and local amenities.
Come in and visit this charming Traditional 2 story Cape Cod pool home in a highly desirable North San Gabriel area. This strikingly traditional has charm with pleasant curb appeal. This spacious home is located very near to the San Gabriel Country Club with proximity to the City of San Marino and exclusive shopping and restaurants. This beautiful traditional entertains three bedrooms and two full bathrooms with the extended primary suite that was combined with an adjoining bedroom. Enjoy family dinners in the light and bright dining room with a frontal view of the manicured landscape. The backyard boasts a spectacular private area and large pool for entertaining with enough space for the f
Welcome to this beautiful TWO units brand new 2024 homes! located in a desirable area in the Temple City! This rare duplex built in one lot, where versatility meets comfort in a truly unique setting. Here, you will discover the extraordinary unique of the homes, offering the stunning blend of independence and connectivity for modern and comfortable living. The two story homes designed with finest craftsmanship! The units breakdown as follows: The Main unit features 2174 sqft of living space with 4 bedrooms and 4.5 baths. The rear unit features 1623 sqft includes 3 bedrooms and 3 baths find seamlessly combines the charm in this cozy home. The elegant wrought iron staircase lead to the se
We are pleased to present for sale this 7 unit condo style apartment building in prime Arcadia. Offered for sale by the original owner/developer of the property, this is an extremely rare opportunity for an investor to acquire a 2004 construction quality asset in a thriving rental market. Situated on a 15,766 square foot lot, the building is approximately 11,486 square feet and features a unit mix of six 3 bedroom 2.5 bath units and one 3 bedroom 2 bath unit. The property is extremely well parked with a total of 18 parking spaces: (8) 2 car garages, (1) single car garage and 1 additional open parking space. All units are two-story townhouse style with central a/c and heat, dishwashers, indi
This area's enrollment policy is not based solely on geography. Please check the school district website for more information.
Elementary schools
Middle schools
High schools
GreatSchools Summary Rating
9/10
Temple City Alternative School
Public, K-12
8/10
Carver Elementary School
Public, K-5
8/10
Emperor Elementary School
Public, K-6
7/10
La Rosa Elementary School
Public, K-3
7/10
Cloverly Elementary School
Public, 4-6
Only showing 5 of
8 elementary schools.
School data is provided by GreatSchools, a nonprofit organization. Redfin recommends buyers and renters use GreatSchools information and ratings as a first step, and conduct their own investigation to determine their desired schools or school districts, including by contacting and visiting the schools themselves.Redfin does not endorse or guarantee this information. School service boundaries are intended to be used as a reference only; they may change and are not guaranteed to be accurate. To verify school enrollment eligibility, contact the school district directly.
East San Gabriel, California, offers a variety of transportation options, including public transit. The region is serviced by Metro buses and light rail, providing residents with alternatives to car travel. For those who prefer to drive, traffic levels can range from moderate to heavy, especially during peak commuting hours. Additionally, East San Gabriel is conveniently located near several major highways and freeways, facilitating easy access to surrounding areas.
What types of properties are available in East San Gabriel?
East San Gabriel, California offers a variety of single-family home types, including ranch-style homes, contemporary homes, and Mediterranean-style homes. These homes can be found throughout the neighborhood, with many located on tree-lined streets and in well-established communities. Most properties in East San Gabriel, California feature 3 to 5 bedrooms and were built in the past few decades. To explore different property types for sale in East San Gabriel, California, use the 'Home type' filter located above the active listings. Customize your search by selecting options like single-family homes, condos, townhomes, and more.
What is life like in East San Gabriel?
Living in East San Gabriel, California offers a serene and picturesque environment with a diverse range of landscapes. The region experiences a mild Mediterranean climate, characterized by warm summers and cool winters. The area provides ample job opportunities across various industries, with a focus on technology, healthcare, and education. Residents can engage in a multitude of recreational activities, including hiking, biking, and exploring local parks. Additionally, the community hosts numerous cultural events and festivals that celebrate the rich heritage of the region.
What are the schools and amenities like in East San Gabriel?
East San Gabriel, California offers a variety of public amenities for residents to enjoy. The region boasts a selection of restaurants, offering a range of culinary experiences. Outdoor enthusiasts will appreciate the presence of numerous parks, perfect for leisurely strolls or picnics. For everyday necessities, several grocery stores are conveniently located throughout the area. Additionally, other amenities such as libraries, fitness centers, and retail shops are also readily available in East San Gabriel, California.
In the past month, 8 homes have been sold in East San Gabriel. In addition to houses in East San Gabriel, there were also 6 condos, 1 townhouse, and 4 multi-family units for sale in East San Gabriel last month. Find your dream home in East San Gabriel using the tools above. Use filters to narrow your search by price, square feet, beds, and baths to find homes that fit your criteria. Our top-rated real estate agents in East San Gabriel are local experts and are ready to answer your questions about properties, neighborhoods, schools, and the newest listings for sale in East San Gabriel. Our East San Gabriel real estate stats and trends will give you more information about home buying and selling trends in East San Gabriel. If you're looking to sell your home in the East San Gabriel area, our listing agents can help you get the best price. Redfin is redefining real estate and the home buying process in East San Gabriel with industry-leading technology, full-service agents, and lower fees that provide a better value for Redfin buyers and sellers.


 REDFIN IS COMMITTED TO AND ABIDES BY THE FAIR HOUSING ACT AND EQUAL OPPORTUNITY ACT. READ REDFIN'S FAIR HOUSING POLICY AND THE NEW YORK STATE FAIR HOUSING NOTICE.
 United States
 Canada