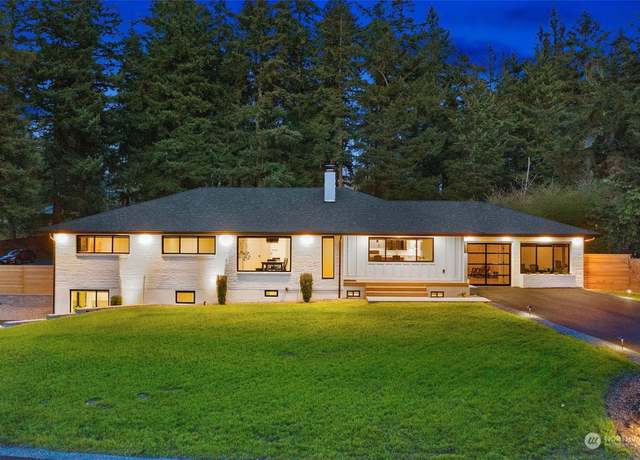
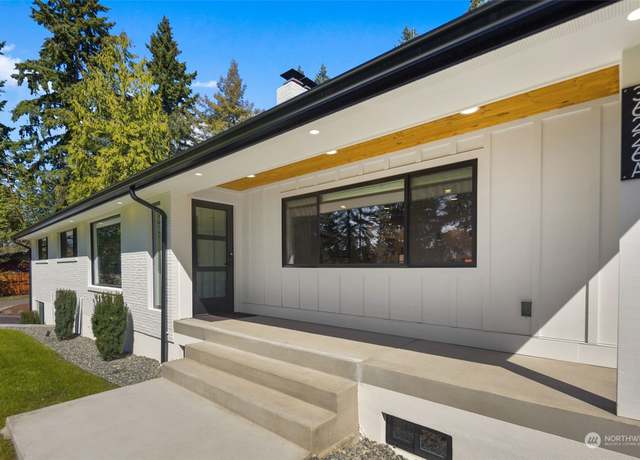
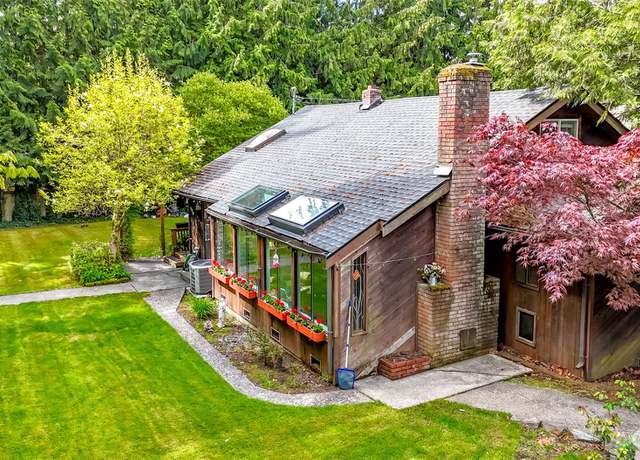
Nestled in the heart of Federal Way, this custom remodeled home offers serene seclusion with a double gated entrance. Its elegant curb appeal captivates, while the oversized 8-car shop, complete with RV hook-up, caters to outdoor enthusiasts and hobbyists. The home has an open-concept layout that provides a seamless flow between the custom kitchen, living and dining room. Flex space features a state-of-the-art sauna and outdoor shower, offering a rejuvenating retreat within the comforts of home. Completing this exceptional offering is an accessory dwelling unit (ADU) boasting its own private entrance, providing additional living space or rental income potential. With R4 zoning, it's not jus
1/39
$1,595,000
5 beds3 baths4,440 sq ft1.81 acres (lot)
36226 28th Ave S, Federal Way, WA 98003
Listing provided by NWMLS as Distributed by MLS Grid
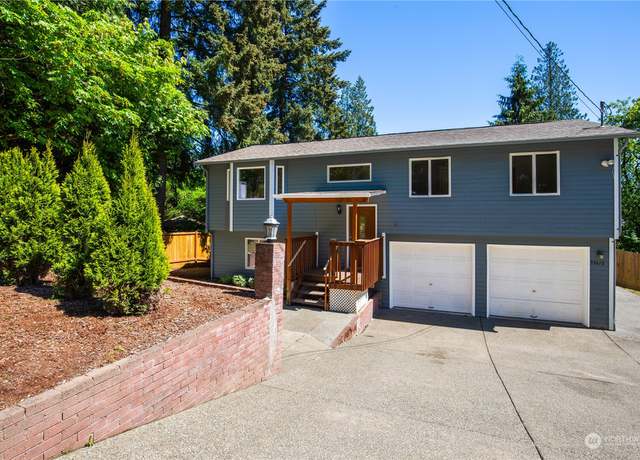
Welcome to your dream home in Auburn! Fully remodeled, located on a quiet street, this 3bd/2br home features AC on both floors, new kitchen with an island and stunning living room. Lower floor has its own entrance, full bathroom, and has a range outlet installed - can be easily converted into a self-contained rental or guest unit. 16,001 sq ft rectangular lot with huge private backyard. Grill and relax on the wood deck on the upper floor. Put hot tub or gym on the patio on the ground level with direct access to 2nd living room. Garage is spacious enough to fit two cars, plus you can park few more on the driveway. Large parking spot to store your RV or boat. New septic pump designed for 30 y
1/18
$590,000
3 beds2 baths1,540 sq ft0.37 acre (lot)
33616 55th Ave S, Auburn, WA 98001
Listing provided by NWMLS as Distributed by MLS Grid
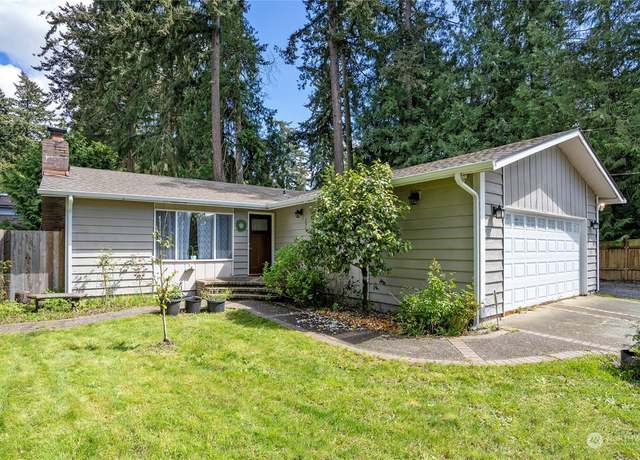
Move in ready rambler home in prime Jovita neighborhood: less than a mile from two parks with nearby access to all major freeways. This home offers 3 bedrooms, 2 bathrooms, with a bonus room converted in garage, PLUS a detached studio with a half bath. A quarter acre fully fenced yard with a covered BBQ area for all your future gatherings. ALL stainless steel appliances convey. Come take a look and make this your new home!
1/26
$530,000
3 beds2 baths1,312 sq ft0.23 acre (lot)
35020 Military Rd S, Auburn, WA 98001
Listing provided by NWMLS as Distributed by MLS Grid
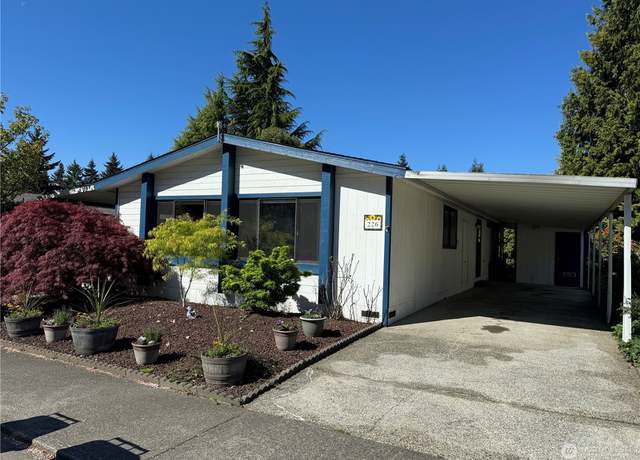
Welcome to Kloshe Illahee, the perfect blend between comfort and community! Clean and ready for you to call it home, spacious 2 bedroom, 2 full bath (shower and soaking tub in primary), seperate laundry area and circular kitchen into dining room! 2 carport with storage shed, private backyard and perfect park location. Enjoy everything offered at this active 55+ adult community, pool, club house, courts, trails, library, fitness center, RV/Boat storage lot (additional monthly fee) and so much more! Financing options available - please ask your agent for more details.
1/20
$99,000
2 beds2 baths1,344 sq ft
2500 S 370th St #226, Federal Way, WA 98003
Listing provided by NWMLS as Distributed by MLS Grid
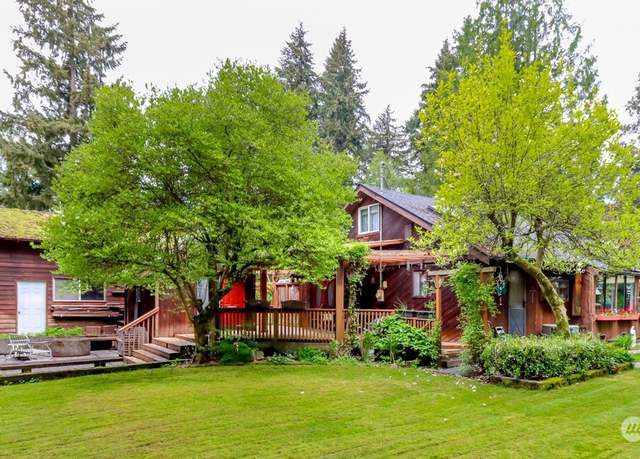
This charming spacious country home sits on almost . 50 acre offering a serene retreat. Bright and open entry which goes into living and open country kitchen that includes eating space along with your dining area. Enjoy the cooler evenings with your wood pellet stove. Main bedroom on main floor and 2 bdrms. upstairs. Outstanding 3 car garage and workshop. Fully fenced property with ample parking for RV or toys. Substantial oversized deck including a separate structure. On a private road. Garage also includes 2 extra finished rooms. You will have the instant feel for the perfect quality lifestyle! Enjoy your days with serenity or the right home for entertaining. Close to freeway access, shop
1/40
$625,000
3 beds1 bath1,430 sq ft0.42 acre (lot)
5025 366th St S, Auburn, WA 98001
Listing provided by NWMLS as Distributed by MLS Grid
Pride of ownership in this gorgeous one owner move-in ready 5 bed Norris resale, in the highly desired Enchanted Meadows neighborhood. Upon entering you will be greeted with high ceilings and hardwood floors. Main floor boasts an open floor plan with one main floor bedroom and full bath. Tons of windows allow for an abundance of natural light. The kitchen features SS appliances and fabulous views of the lovely stamped concrete back patio with artificial turf for easy maintenance of your fully fenced backyard. Upstairs you will find the Oversized primary suit with vaulted ceilings and massive soaking tub plus 2 walk-in closets. Plus another 3 bedrooms and full bath. Minutes to I-5, SR 167 an
1/38
$785,000
5 beds3 baths2,590 sq ft6,266 sq ft (lot)
3101 S 381st Way, Auburn, WA 98001
Listing provided by NWMLS as Distributed by MLS Grid
Welcome to your dream home in Federal, Way! This captivating two-story residence offers elegance and comfort throughout. Inside, you'll find spacious living and dining areas, a large kitchen with an island, oak cabinets, gleaming hardwood floors, and plush new carpeting. Upstairs, the master bedroom features a vaulted ceiling and a well maintained five-piece bath. Located on a corner lot, this property comes with a sweet backyard for barbecue & social gatherings. Featuring a charming garden and plenty of room for parking your RV or boat, this setup invites you to soak up the best of outdoor living. Don't miss out—schedule a showing today and step into the life you've always drea
1/40
$725,000
4 beds2.5 baths2,460 sq ft9,710 sq ft (lot)
3022 S 367th Ct, Federal Way, WA 98003
Listing provided by NWMLS as Distributed by MLS Grid
Style meets functionality in this superb residence in Killarney Ridge. Upon entry, be greeted by the inviting sunken living room featuring a wood-burning fireplace, seamlessly flowing into the formal dining area. The kitchen, adorned w/ stylish shaker cabinets, SS appliances, & granite, opens to the family room, & convenient powder bath. Retreat upstairs through the double doors to discover the owner's suite, complete w/ a private bath, providing a refuge for rest & rejuvenation. 2 add’l bedrm & bath offer versatility, suitable for guests or home office. Step outside to the fenced backyard, offering an ideal setting for outdoor entertainment. With fresh interior
1/40
$638,000
3 beds2.5 baths2,130 sq ft7,703 sq ft (lot)
2522 S 357th St, Federal Way, WA 98003
Listing provided by NWMLS as Distributed by MLS Grid
Come and watch spectacular sunsets!. .. from this beautiful 5 bedroom 2 story home in desirable West Hill Auburn. Home features a huge island kitchen, dining area and living room all looking at the view. Enjoy the gas log fireplace and Brazilian hardwood floors too. Bedroom on the main also used as a den, 4 bedrooms up include lovely primary suite w/ 5 piece bath & biggest closet you'll find - another bedroom so large it can be your recreation/family room. Formal dining room. Big 2 car garage and more storage in the outside shed. 2023 Bosch heat pump, new interior paint, outside painted in 2022, storage racks in garage, new hot water heater too. Walking trails and a private park too.
1/24
$749,950
5 beds2.5 baths2,880 sq ft5,485 sq ft (lot)
37531 32nd Pl S, Auburn, WA 98001
Listing provided by NWMLS as Distributed by MLS Grid
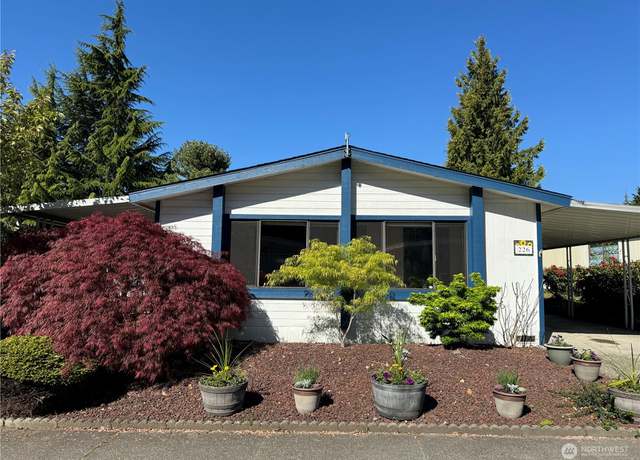
Great opportunity to retire in the very desirable age approved community of Kloshe Illahee. The community offers an impressive clubhouse, amenities include pool, spa, fitness center, game rm, theater rm, social events, RV storage and so much more! The community is also pet friendly. Among the nicest homes here with open concept, 1,664 sq ft, 2 bdrms, 1.75 bths, lrg office. Living room w/ vaulted ceilings, full of windows providing an abundance of natural light. Kitchen w/ breakfast bar and plenty of counter space. Huge Primary suite plus sitting room, bathroom and sliding glass door to an amazing sunroom with exterior entry. Great landscaping, shed, heat pump, new hot water tank, easy acces
1/36
$225,000
2 beds2 baths1,664 sq ft
2500 S 370th St #261, Federal Way, WA 98003
Listing provided by NWMLS as Distributed by MLS Grid
Room to Roam! Exceptional and Spacious, almost 2900 sq. ft. , 2 Story with 9ft. ceilings, Formal living room and Formal dining room with Wainscoting, appx. 15 ft. by 20 ft. family room with gas fireplace and ceiling fan, upgraded water resistant floating wood laminate floors, on 1st floor, Upgraded kitchen with stainless steel appliances, new stove and fireplace, upgraded granite countertops and tiled backsplash. Upstairs offers wonderful primary suite with recessed ceilings, gas fireplace, ceiling fan and deluxe primary bathroom with jacuzzi tub, quartz counters and porcelain tile floors. Other bedrooms are equally spacious with one with vaulted ceilings. Plus large garage. Fenced backya
1/37
$755,000
4 beds2.5 baths2,880 sq ft6,122 sq ft (lot)
38062 36th Pl S, Auburn, WA 98001
Listing provided by NWMLS as Distributed by MLS Grid
Welcome to your new home nestled in a serene and friendly neighborhood! This charming split-entry house boasts a spacious and fully-fenced backyard, providing a safe haven for pets to play to their heart's content. Imagine hosting gatherings on the expansive lower level deck, creating memories that will last a lifetime. The original owners have filled this home with light, warmth, and care from the living room with a vaulted ceiling and ensuite primary bedroom, to the finished basement complete with a family room, full bathroom, and dedicated laundry room. Enjoy the convenience of easy access to freeways, neighborhood shops, schools, and an array of amenities, making everyday living a breez
1/27
$595,000
3 beds3 baths1,800 sq ft8,645 sq ft (lot)
2619 S 379th Pl, Federal Way, WA 98003
Listing provided by NWMLS as Distributed by MLS Grid
Wow, bring your OFFER and a few tools to freshen up this fabulous Rambler located on this spacious lot for plenty of outdoor fun. It's perfectly located near plenty of restaurants and shopping for your convivence. Three bedrooms and a centrally located laundry room for easy access for chores. Attached covered carport that makes it easy to get to the front or back door. Backyard is fully fenced and plenty of room for games this Summer.
1/15
$539,950
3 beds1.5 baths1,460 sq ft9,600 sq ft (lot)
34906 Military Rd S, Auburn, WA 98001
Listing provided by NWMLS as Distributed by MLS Grid
Welcome to Mason Heights in Federal Way. You'll love the open concept living as you cozy around the gas fireplace for movie night or just to relax! Designer features such as quartz counters throughout kitchen & bathrooms give an elegant touch. Luxury Vinyl Plank Flooring, White Painted Millwork & Doors, & Stainless Appliances along w/ Covered Rear Patio, Fenced & Landscaped Front & Rear Yards finish off the outdoor living space. EV charging in garage. Still time to for personalization of interior through the Design Studio to make this your unique & one-of-a-kind home. Heat Pump for efficient heating & A/C is also included in this energy star certifie
1/14
$769,410
4 beds2.5 baths2,330 sq ft7,175 sq ft (lot)
37471 29th Ave S #7, Federal Way, WA 98003
Listing provided by NWMLS as Distributed by MLS Grid
One of the last best kept secrets in south King County. This 3 bed, 1.75 bath rambler sits in a quiet neighborhood that boarders Federal way. Multiple entrances for hwy 18, I-5, & 167 makes commuting a little easier. Inside roads can lead you into the heart of the Federal way food scene w/ in 15 minutes-even during prime time traffic. Light rail being constructed in FW as well! Fully turnkey, ready for the next owners to make the house a home. New roof, water heater, floors, closet systems, kitchen cabinets and appliances. New furnace(2022), new paint inside and out, freshly landscaped over a brand new 1000 gallon septic system. Home feels bigger than square footage. No stones left un
1/37
$570,000
3 beds2 baths1,150 sq ft9,559 sq ft (lot)
34914 45th Ave S, Auburn, WA 98001
Listing provided by NWMLS as Distributed by MLS Grid
Darling Mid-Century Rambler that provides for easy living, fantastic storage options and a large lot (. 37 acres) to purpose for your outdoor style. Many newer features include hot water heater, furnace, dishwasher, septic system, roof, paint and trim - this is a well cared for home! Plenty of off street parking - oversized driveway, covered carport, 2-car garage and plenty of overflow parking for an RV or boat if needed. Truly the gem you've been waiting for!
1/21
$470,000
3 beds1 bath920 sq ft0.37 acre (lot)
3927 S 343rd St, Auburn, WA 98001
Listing provided by NWMLS as Distributed by MLS Grid
* * * New and Improved Price! * * * Welcome home to the wonderful home, located in the Kloshe/Illahee 55 and older community. This 1600+sq/ft home with a brand new roof is in a wonderful cul-de-sac. Freshly painted! It includes 3 nice sized bedrooms, with 1 and 3/4 baths with plenty of space and room for everyone. This home also has a Dakin Split Air Conditioning Unit as well. Covered carport with a spot for outdoor entertaining. Also includes a good sized shed for storage~ All appliances stay so this is a move in ready opportunity! Easy access to HWY 18, I-5 and shopping. Home being Sold As Is
1/17
$89,990
3 beds2 baths1,620 sq ft
2500 S 370th St #36, Federal Way, WA 98003
Listing provided by NWMLS as Distributed by MLS Grid
Experience tranquil lakefront luxury living at its finest! This remarkable estate presents unmatched opportunities for recreational activities like boating, fishing, kayaking & many other amenities. Expansive property boasts 8000+sqt of exquisite living space & multi-generational living w/ easy access and mins away to urban amenities. All designs of this estate are customized n built on a grand scale; from sweeping lake view from virtually most rooms and all 3 levels to spectacular works of art through a visually appealing blend of Mediterranean, & Victoria styles with/ intricate detailing. Indoor/heated swimming pool, home theatre, basketball court etc. Priced below the co
1/40
$1,795,000
7 beds5.5 baths8,300 sq ft0.52 acre (lot)
34520 38th Ave S, Auburn, WA 98001
Listing provided by NWMLS as Distributed by MLS Grid
Charming Tri-Level Home on Cul-de-Sac. Discover this inviting tri-level residence, ideally situated on a serene cul-de-sac and just moments from schools. Step inside to find a seamless layout with a cozy living room, formal dining area, and a chef's kitchen boasting high-end appliances and marble countertops. The lower level offers a relaxing family room, bedroom, and bath, while the top floor features three additional bedrooms including a tranquil primary suite with a private balcony. Outside, enjoy the spacious yard and storage room above the garage. Don't miss out on this delightful home—schedule your showing today!
1/34
$700,000
4 beds3 baths2,970 sq ft0.31 acre (lot)
35149 38th Ave S, Auburn, WA 98001
Listing provided by NWMLS as Distributed by MLS Grid
Step into a world of comfort with this well-maintained gem that has recently undergone a remodel. Boasting a spacious backyard and generous side yard, this home offers ample outdoor space for relaxation and entertainment. The thoughtful updates provide a modern touch while retaining the warmth and character of the home. Perfect for those who cherish both indoor elegance and outdoor serenity. Make this your personal haven today!
1/28
$475,000
3 beds1 bath920 sq ft9,812 sq ft (lot)
34215 40th Ave S, Auburn, WA 98001
Listing provided by NWMLS as Distributed by MLS Grid
Home Site backs to protected area. You'll love the 9' ceilings & open concept living as you cozy around the gas fireplace for movie night or just to relax! Designer features such as Quartz counters throughout give an elegant touch. Engineered hardwood Flooring, White Painted Millwork & Doors, & Stainless Steel Appliances, Covered Rear Patio, Fenced & Landscaped Front & Rear yard. Still time for personalization of interior at Design Studio to make this a one-of-a-kind home. Heat Pump for efficient heating & A/C is also included in this energy star certified home.
1/3
$693,420
3 beds2.5 baths1,758 sq ft3,819 sq ft (lot)
37462 29th Ave S #18, Federal Way, WA 98003
Listing provided by NWMLS as Distributed by MLS Grid
1870 plan backing to protected area. featuring 3 Bedroom + Loft/Bonus Room home greats you w/ a nice open feeling & high 9' ceilings. You'll love the open concept living as you cozy around the gas fireplace for movie night or just to relax! Designer features such as Quartz counters throughout kitchen & bathrooms give an elegant touch. Luxury Vinyl Plank Flooring, White Painted Millwork & Doors, & Stainless Appliances along w/ Extended Covered Rear Patio, Fenced & Landscaped Front & Rear Yards finish off the outdoor living space. Still time to for personalization of interior through the Design Studio to make this your unique & one-of-a-kind home. Heat
1/15
$738,150
3 beds2.5 baths1,870 sq ft3,888 sq ft (lot)
37464 29th Ave S #17, Federal Way, WA 98003
Listing provided by NWMLS as Distributed by MLS Grid
Discover the epitome of luxury living in this stunning 4 bed, 2.5 bath home located in the charming neighborhood of Auburn. Boasting exquisite craftsmanship throughout, this home features a spacious master bedroom & bathroom complete with a jetted deep tub & tile shower. The added closed porch, or sunroom, offers a cozy retreat w/ a brick fireplace perfect for relaxing evenings. The updated kitchen is a chef's dream w/ spacious island, gas stove, oven, & stainless steel appliances of the highest quality. The open concept layout, lit staircase, & tucked away location make this home a true oasis. Plus, enjoy the serene backyard w/ no homes behind, just a peaceful wooded
1/40
$839,000
4 beds2.5 baths2,537 sq ft5,750 sq ft (lot)
35517 56th Ave S, Auburn, WA 98001
Listing provided by NWMLS as Distributed by MLS Grid
Welcome to this wonderful home located in a highly desirable 55+ community of Kloshe Illahee Park! This beautiful & affordable 3-bedroom 1.75 bath home will win you over as soon as you see it. Natural light floods the living room consistently. Spacious primary bedroom with huge closet. Remodeled kitchen & bathrooms; new carpet. Heat pump with AC & lots of appliances included (washer, dryer, refrigerator, dishwasher, stove & m/w). 2015 roof, interior freshly painted. Spacious patio with cover and large shed for ample storage. Unique amenities at Clubhouse: pool, spa, sauna, exercise room, trail & fun social events. It’s close to restaurants, shopping, free
1/39
$125,000
3 beds2 baths1,536 sq ft
2500 S 370th St #217, Federal Way, WA 98003
Listing provided by NWMLS as Distributed by MLS Grid
This Beautiful home is custom built 4bed /2.5 bath 3000+ sq ft home is waiting for you! Vaulted ceilings on main level with luxurious laminate throughout, walk-in closets in each bedroom, Primary bedroom with a 5 piece, fully fenced back yard, with custom deck and patio! The freeway is minutes away from the home. Come check out this home won't last long!!
1/27
$855,000
4 beds2.5 baths3,050 sq ft5,831 sq ft (lot)
2803 S 368th, Federal Way, WA 98003
Listing provided by NWMLS as Distributed by MLS Grid
2070 SqFt. featuring 3 bedrooms + Loft/Bonus Room. Home Site backs to protected area. Beautiful modern looking exterior elevation with expansive brick masonry. You'll love the 9' ceilings & open concept living as you cozy around the gas fireplace for movie night or just to relax! Designer features such as Quartz counters throughout give an elegant touch. Engineered hardwood Flooring, White Painted Millwork & Doors, & Stainless Steel Appliances, Covered Rear Patio, Fenced & Landscaped Front & Rear yard. Still time for personalization of interior at Design Studio to make this a one-of-a-kind home. Heat Pump for efficient heating & A/C is also included in thi
1/3
$762,360
3 beds2.5 baths2,070 sq ft4,141 sq ft (lot)
37518 S 29th Ave S #15, Federal Way, WA 98003
Listing provided by NWMLS as Distributed by MLS Grid
2755 Sq. Ft. featuring 5 Bed/3 Bath+ Loft/Bonus Room w/ Bed & full bath on main. Big and private lot backing to protected wetlands w/ large extended covered patio in back. High 9' ceilings. Open concept living as you cozy around the gas fireplace. Designer features such as Quartz counters throughout kitchen & bathrooms give an elegant touch. Luxury vinyl plank flooring, White Painted Millwork & Doors. Stainless Appliances, fully fenced & Landscaped Front & Rear Yards. Heat Pump for efficient heating A/C included in this energy star certified home. Still time to for personalization of interior through the Design Studio to make one-of-a-kind home. Incredible loca
1/3
$860,135
5 beds3 baths2,755 sq ft7,716 sq ft (lot)
37410 29th Ave S #23, Federal Way, WA 98003
Listing provided by NWMLS as Distributed by MLS Grid
Custom luxury home. 4 bed 2.75 bath on 1.89 acres. Grand entry w/ curved staircase, floor to ceiling windows, office, sauna, hardwoods, custom tiling & crown-molding throughout! Large kitchen next to family room w/ granite counters, stainless steel appliances & plenty of storage space. Two decks to enjoy for year-round entertainment. Master has gorgeous 5-pce bath with a double closet. Close to major highways & plenty of shopping! Lot could potentially be subdivided. Zoning R4, Four DU per acre. Check with City.
1/8
$1,200,000
4 beds3 baths3,930 sq ft1.89 acres (lot)
36058 21st Ln S, Federal Way, WA 98003
Listing provided by NWMLS as Distributed by MLS Grid
Very adorable home situated on an over half-acre lot w/ territorial views feeling like living in a countryside, but close to all amenities: freeways, shopping, and restaurants. .. House is facing few nice large custom-built homes in the neighborhood. The lot is huge included fruit trees, mature landscaping & gazebo created a lovely setting surrounding the home. You will enjoy your outdoor activities and entertainment for the Summer BBQ right in your own backyard. Check out a large shop in the back for your storage. There is also a big bonus room in the basement. Home featured 3 bedrooms, 1 full bathroom, 1,330SqFt. In the Living room has fire place, open space and large windows. Don&
1/10
$549,750
3 beds1 bath1,330 sq ft0.55 acre (lot)
4320 S 384th St, Auburn, WA 98001
Listing provided by NWMLS as Distributed by MLS Grid
Welcome to this beautifully updated home in Kloshe Illahee (55+) park. With 2 generous bedrooms & 2 full bathrooms, it offers comfort & convenience. The primary bedroom features 2 large closets & a spacious bath with a walk-in shower & soaking tub. The guest bedroom & bath offer privacy & complete separation. Enjoy mature landscaping & a PNW deck for entertaining. Recent updates include new floors, interior & exterior paint, kitchen cabinets, lighting, plumb fixtures & appliances, enhancing functionality & aesthetics. Kloshe Illahee boasts a clubhouse with pool, spa, & activities and so much more. Welcome to your next home! Th
1/29
$144,999
2 beds2 baths1,440 sq ft
2500 S 370th St #37, Federal Way, WA 98003
Listing provided by NWMLS as Distributed by MLS Grid
Come see your future home, beautifully finished home with custom metal gate and stair railing. Fresh paint, all new floors, all new kitchen and appliances, new basement bath, new gas furnace with media cleaner, new gas water heater. Dining room off kitchen, laundry on top floor, bonus room with vaulted ceilings. Views from kitchen and primary bedroom. Second electrical panel in fully finished basement, great location for MIL, studio, craft room or whatever you need extra space for. Vacant lot behind home is listed by a sibling. Don't live with regrets, see it before it's gone.
1/30
$860,000
4 beds3.5 baths3,040 sq ft0.40 acre (lot)
34822 56th Ave S, Auburn, WA 98001
Listing provided by NWMLS as Distributed by MLS Grid
Welcome to this wonderful home located in a highly desirable 55+ community of Kloshe Illahee Park! This beautiful & affordable 2-bedroom 2 bath home will win you over as soon as you see it. Retirement living at its best! Spacious primary bedroom & bath, Open living room and dining area for entertaining. Spacious kitchen offer plenty of storage. Newer furnace with AC. New electrical panel! Appliances include washer, dryer, refrigerator, dishwasher, stove. Large covered patio & shed. You can bring your pets (cats/dogs) with you. Amenities at Clubhouse: pool, spa, sauna, exercise room, trail & fun social events. It’s close to restaurants, shopping, freeways &
1/17
$89,000
2 beds2 baths1,248 sq ft
2500 S 370th St #61, Federal Way, WA 98003
Listing provided by NWMLS as Distributed by MLS Grid
Welcome to the coveted Pepper Hill Community! The journey begins with a grand entrance through a custom glass door, leading you to the heart of this home the gourmet kitchen & the expansive great room with an inviting outdoor oasis. Upstairs boasts a spacious Primary Bedroom with a 5 piece bath & dual dressing rooms; a true retreat within your home. Four Guest Bedrooms have their own en-suite bath & walk-in closets. Large Pantry, Mudroom, 3 Car Garage, EV Charging Hookup, Generator, & A/C. This is an embodiment of style & functionality. Elevate your lifestyle in this modern masterpiece where every detail has been carefully curated & thoughtfully designed t
1/40
$999,950
4 beds4.5 baths3,896 sq ft6,650 sq ft (lot)
35535 56th Ave S, Auburn, WA 98001
Listing provided by NWMLS as Distributed by MLS Grid
Spacious master bedroom features a jetted tub, separate shower, two skylights, garden window, walk-in closet. Large living room, bright dining room with bay window. Kitchen has island w/ Jenn-Air cooktop, pantry, eating bar, oak cabinets. Family room with new carpets, gas fireplace, 1/2 bath. Huge finished basement w/ game room, rec room, half bath, fireplace, easy conversion to 4th bedroom. Pool table stays. Large deck overlooks peaceful, wooded, fenced backyard & storage shed. New carpet and paint throughout the house.
1/40
$755,000
3 beds3 baths2,950 sq ft0.48 acre (lot)
36529 32nd Ave S, Auburn, WA 98001
Listing provided by NWMLS as Distributed by MLS Grid
Remodeled 3 beds 2 baths rambler conveniently located close to I-5, 18 and 167 freeway. Walk in this home w/ sunlight shining through and home features spacious living room & Nicely remodeled kitchen w/ dining space. Engineered Hardwood flooring throughout. Roomy primary bedroom & full bath w/ tiled surround. Former garage has been switched to the 4th room for extra living space. This home overlooks the beautiful woods view all around the year, and tons of parking spaces. Over 1.5 Acres of Land on Auburn's West Hill zoned R-4, available for up to 4/acre. This could be your home sweet home, short term rental or new development. No wetlands & topograghic done. * Buyer to ver
1/18
$629,900
3 beds2 baths1,560 sq ft1.56 acres (lot)
3724 S 360th St, Auburn, WA 98001
Listing provided by NWMLS as Distributed by MLS Grid
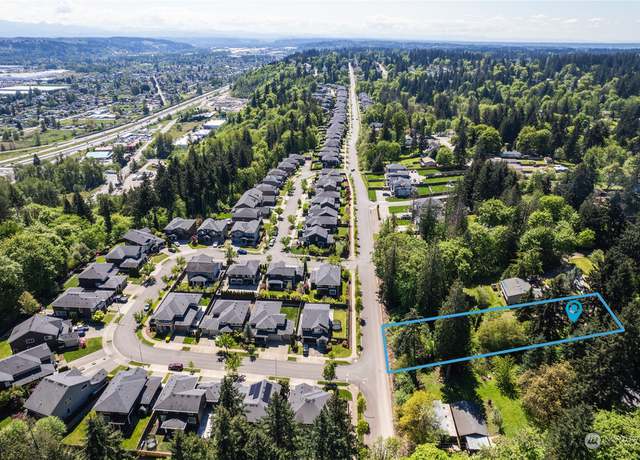
Land Bank opportunity in the beautiful Jovita community. This land is raw 110x80 and surrounded by private and lush trees giving you the privacy to build your dream home. R-4 zoning is residential in nature. Easy access to major freeways. No studies performed and access is via a public right of way that is heavily treed and needs to be cleared. Water and electrical available in the street. Call your agent today for this low priced land. Use the Regrid app to observe property boundaries while walking.
1/4
$39,950
— beds— baths8,800 sq ft (lot)
37000 44th Ave S, Auburn, WA 98001
Listing provided by NWMLS as Distributed by MLS Grid
Based on information submitted to the MLS GRID as of Fri May 03 2024. All data is obtained from various sources and may not have been verified by broker or MLS GRID. Supplied Open House Information is subject to change without notice. All information should be independently reviewed and verified for accuracy. Properties may or may not be listed by the office/agent presenting the information. Some IDX listings have been excluded from this website.
School data is provided by GreatSchools, a nonprofit organization. Redfin recommends buyers and renters use GreatSchools information and ratings as a first step, and conduct their own investigation to determine their desired schools or school districts, including by contacting and visiting the schools themselves.Redfin does not endorse or guarantee this information. School service boundaries are intended to be used as a reference only; they may change and are not guaranteed to be accurate. To verify school enrollment eligibility, contact the school district directly.
Lakeland South, Washington, offers a variety of transportation options, including a well-structured public transportation system. The area is serviced by a network of buses, providing residents with an alternative to driving. For those who prefer to use a car, traffic levels can vary, but generally, the area experiences moderate traffic. Additionally, Lakeland South, Washington, is conveniently located near several major highways and freeways, providing easy access to surrounding areas.
What types of properties are available in Lakeland South?
Lakeland South, Washington offers a variety of single-family home types, including ranch-style homes, split-level homes, and contemporary homes, among others. These homes can be found throughout the neighborhood, with many located on quiet residential streets and cul-de-sacs. Most properties in Lakeland South, Washington feature three to four bedrooms and were built within the last decade. To explore different property types for sale in Lakeland South, Washington, use the 'Home type' filter located above the active listings. Customize your search by selecting options like single-family homes, condos, townhomes, and more.
What is life like in Lakeland South?
Living in Lakeland South, Washington offers a serene and picturesque environment with a diverse range of landscapes. The region experiences a mild climate, with pleasant summers and cool winters. Job opportunities in the area are abundant, with a variety of industries to choose from. Lakeland South provides a multitude of recreational activities and amenities, catering to various interests and hobbies. Residents can explore numerous parks, engage in outdoor sports, and enjoy the vibrant local arts and culture scene.
What are the schools and amenities like in Lakeland South?
Lakeland South, Washington provides a variety of public amenities for its residents. You can enjoy a meal at a local restaurant or purchase your essentials at a nearby grocery store. If you're a nature enthusiast, the region boasts several parks for your leisure and relaxation. Additional amenities include a public library, fitness centers, and a post office. These facilities contribute to the convenience and quality of life in Lakeland South, Washington.
In the past month, 5 homes have been sold in Lakeland South. In addition to houses in Lakeland South, there were also 0 condos, 0 townhouses, and 1 multi-family unit for sale in Lakeland South last month. Find your dream home in Lakeland South using the tools above. Use filters to narrow your search by price, square feet, beds, and baths to find homes that fit your criteria. Our top-rated real estate agents in Lakeland South are local experts and are ready to answer your questions about properties, neighborhoods, schools, and the newest listings for sale in Lakeland South. Our Lakeland South real estate stats and trends will give you more information about home buying and selling trends in Lakeland South. If you're looking to sell your home in the Lakeland South area, our listing agents can help you get the best price. Redfin is redefining real estate and the home buying process in Lakeland South with industry-leading technology, full-service agents, and lower fees that provide a better value for Redfin buyers and sellers.


 REDFIN IS COMMITTED TO AND ABIDES BY THE FAIR HOUSING ACT AND EQUAL OPPORTUNITY ACT. READ REDFIN'S FAIR HOUSING POLICY AND THE NEW YORK STATE FAIR HOUSING NOTICE.
 United States
 Canada