Enjoy the best of Santa Cruz living with this exceptional property! Premier location just minutes to Twin Lakes Beach and the Crow's Nest. The stunning 2 story home, just 6 years old, offers top-of-the line modern features including solar, smart thermostat, upgraded dual pane windows for improved insulation and low maintenance landscape. Bright and open floor plan with 9 ft ceilings, gorgeous LVT flooring and French doors to the patio with a double screen for true indoor/outdoor living. The fabulous chef's kitchen features quartz countertops, ample cabinet storage with new hardware and center island for breakfast seating. High-end stainless steel appliances including Wolf induction range ov
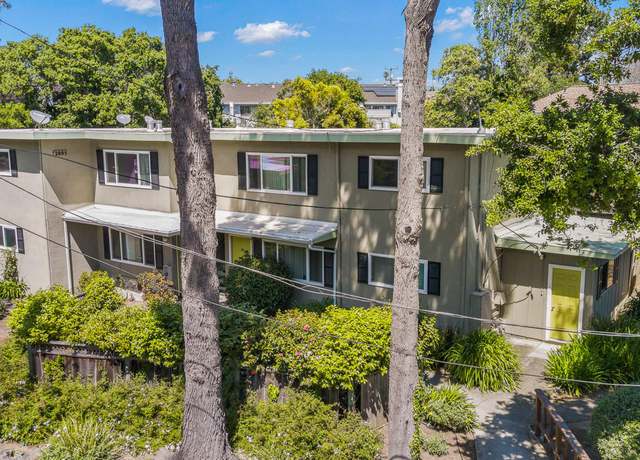
Upgraded and clean 4-plex in coveted Santa Cruz location. Near Capitola Mall, shopping, beaches on bus line for tenants. Rare to find 4-plex with two 3Br and two 2BR units. All have been nicely updated by current owner. Upgrades include all doublepane windows, plank flooring, paint, carpets, updated bath room with tile shower. Kitchen upgrades include shaker style cabinets, gas cooktop, updated quartz countertops. The heavy lifting of updating units and getting rents to market has been done. Solid investment. Must see for any Santa Cruz investors.
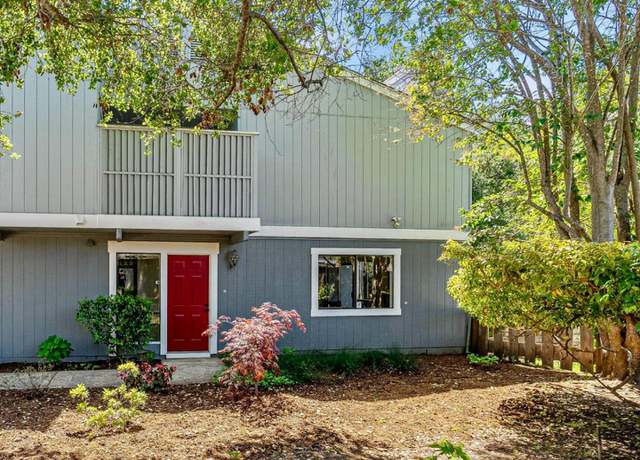
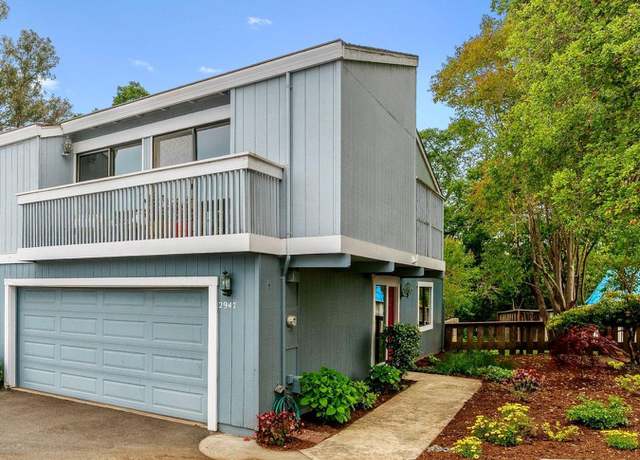
2947 Leotar Circle is a charming 3 bd/2.5 bath home nestled in a prime location in Santa Cruz. This 2 story end unit boasts 1,448 sq. ft. of comfortable living space with 2 fireplaces, offering a blend of modern convenience & coastal tranquility. Step inside & discover a spacious layout highlighted by a large living/dining rooms with a fireplace for cozy nights. The interior has been thoughtfully updated with new carpets, fresh paint, & modern lighting, creating a welcoming ambiance. The heart of the home is the well-appointed kitchen, complete with ample cabinetry, breakfast bar, new range & microwave, perfect for casual dining or entertaining guests. Upstairs the la
Enjoy life in the wonderful community of Rodeo Estates in Sunny Soquel! This terrific 3BR/2BA 1494SF home has lots of room for inside and outside living - entertaining, hobbies, music, pets, grandkids and more! Located on an end lot on one of the coveted finger lanes with mountain and distant tree views this spacious home has a sizable dining room, eat in kitchen, gracious living room, 3 good sized bedrooms, including primary bedroom with huge walk in closet and large bathroom. Beautiful laminate floors in living areas and bedrooms. The laundry room has a large sink, washer/dryer and overhead cabinets. Very clean kitchen with lots of storage, all appliances and pretty distant view from the
Have you been to the secluded and serene setting of this quiet Santa Cruz neighborhood? Its cul-de-sac location lined with quality homes is worth experiencing. The welcoming and beautifully maintained hilltop 4br, 3 ba, 2,750 sf home with stunning canyon views is thoughtfully designed for separation of space, relaxation, time-off living, and year-round entertaining, it is perfectly placed for neighborhood privacy and amenity access. The kitchen, family room, dining room and sunroom open to an expansive deck with outdoor kitchen and the perfect Santa Cruz warm belt locale to gather while enjoying the privacy of the lush canyon. Hard to believe this beautiful home is less than 4 miles to toes
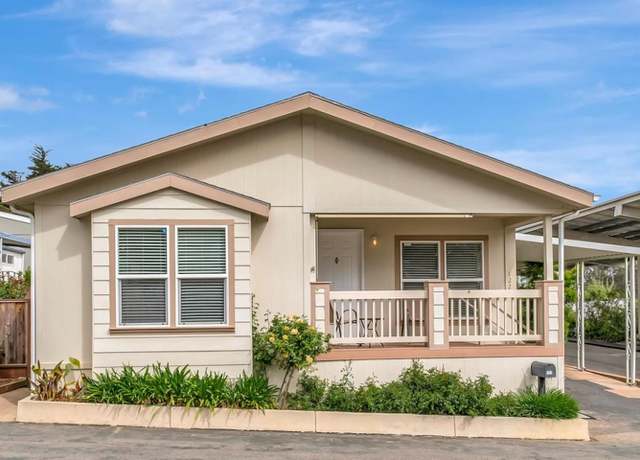
Nestled in the highly coveted Sorrento Oaks resident-owned, +55 senior park, this 2BR/2BA manufactured home offers the perfect blend of vintage charm and modern convenience. Lovingly maintained with original details that exude warmth and character, this home is a true find. Situated in a prime location that offers unparalleled access to some of Santa Cruz's most sought-after destinations. Just moments away, you'll find the Santa Cruz Yacht Harbor, Arana Gulch, Twin Lakes Beach, ocean-front dining, and much more. But the allure of this property extends far beyond its prime location. Within the Sorrento Oaks community, you'll discover a vibrant and welcoming atmosphere that caters to an activ
We are excited to present to you 2035 Sequoia Drive, located in the desirable Santa Cruz Gardens neighborhood. This charming single-level home offers an ideal blend of functionality and comfort. Upon arrival, you will be greeted by a spacious, covered front porch, perfect for enjoying the serene surroundings. Inside, the open floorplan seamlessly connects the living, dining, and kitchen areas, creating an inviting space for both relaxation and entertainment. Featuring 3 bedrooms and 2 bathrooms, this residence provides ample accommodation for families or those seeking extra space for guests or home office needs. Tasteful upgrades throughout the home ensure modern convenience while maintaini
Rarely does an opportunity like this present itself on this tranquil street. Nestled in a serene dead-end, yet conveniently situated in a sought-after midtown locale, this property provides easy access to local beaches, the Harbor, & all essential amenities. Step into single-level living, recently enhanced with tasteful upgrades including refinished hardwood floors, new carpeting, & fresh paint throughout. Enjoy an abundance of natural light streaming in through numerous skylights & windows, illuminating the spacious interiors. The kitchen area features an inviting eat-in dining space & ample pantry storage, while an adjacent area serves perfectly as a home office. Dis
ATTENTION OWNER BUILDERS / CONTRACTORS / DEVELOPERS / INVESTORS / THE HOSIER FAMILY TRUST IS SELLING A RARE MULTI-RES OPPORTUNITY / CENTRALLY LOCATED WALKING DISTANCE TO SANTA CRUZ YACHT HARBOR AND BEACHES / PROPERTY IS ( 23,217 SQ FT ) ZONED MR-4 / DO THE MATH, POTENTIAL MULTI-RES ENTITLEMENTS ABOUND / * * * CAUTION * * * ALL EXISTING STRUCTURES ARE DEEMED UNSAFE AND SHALL NOT BE ENTERED / TRUST SALE EXEMPT / NO SELLER OR AGENT WARRANTIES EXPRESSED
Rare opportunity to own a 3-bedroom townhome in Harbor Oaks! Nestled among garden like grounds and beautiful trees, you'll find an incredible property waiting for you to transform into the cozy home of your dreams. Downstairs, discover a private patio yard area that flows from your dedicated, covered two car parking and storage area. Picture the vegetables and flowers you'll grow! Inside delight at the possibilities where an open concept kitchen awaits along with a half bath for convenience. A few updates will make this kitchen sparkle! Under the staircase, consider this area for your work from home needs or as a mudroom space. The downstairs layout can accommodate many ideas! Upstairs, cel
Welcome to Homestead Park #13 in the heart of Santa Cruz a 55+ community in a share owned park. You will love this end unit with a vintage flare. It has LVP floors throughout, Kitchen and both bathrooms updated. Fresh white exterior paint and custom exterior window shades. This is one of the best park locations in all of Santa Cruz County. Enjoy weekends at Santa Cruz top beaches. About a mile to Capitola Mall, close to restaurants and Santa Cruz Harbor.
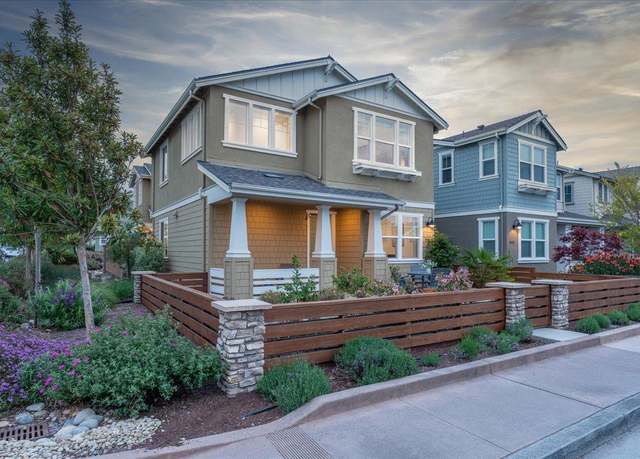
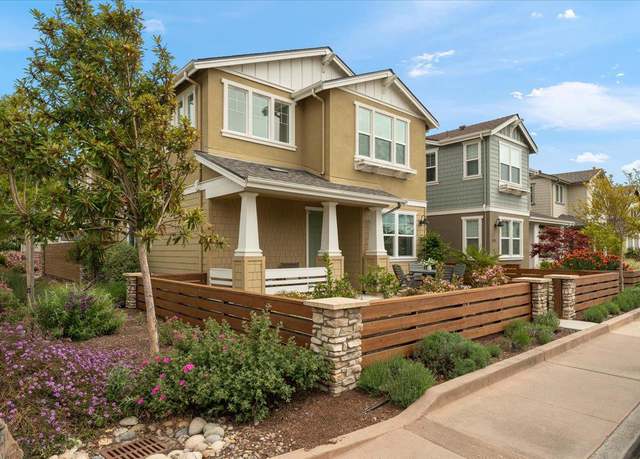
This incredible single-level home was completed in 2020, & the property features a detached second unit. From the moment you enter the front door, you'll immediately recognize the unique & beautiful design elements that make this home so special. Ideal for entertaining, or simply relaxing with the ones you love the most, the spacious floor plan flows seamlessly between the living spaces & out into the immaculately landscaped private backyard. A chefs dream come true, the gourmet kitchen has an abundance of workspace, storage, & style. The luxurious primary suite includes a generous walk-in closet, & stunning en-suite bathroom with both a soaking tub and separate
Delightful Village of 6 Residences, with 3 stand-alone Homes plus 3 Townhome-style units and 2 Outbuildings. All this on a large garden parcel with ample yards and plenty of off-street parking on a prime Mid-County location! The Original 3 BR/1.5 Bath Home sits back from Mission Dr behind a charming entry pergola and picket-fenced front yard with lush garden. In its large back yard is an outbuilding with potential for conversion to an ADU. Next down the driveway are 3 Townhome-style units, each with private back yards: Two have 2-story 2/1.5 985 SF floorplans and the third has a 2/1 single-level 830 SF floorplan with an adjacent garage that offers potential to expand to a 3/2 of 1030 SF. At
Are you 62 or older, living locally & on a moderate income? Would you like to own an affordable, single level condo in mid-county? This upstairs cutie has one bedroom, one bathroom, a good size kitchen, large pantry closet, and a view of a large, beautiful redwood tree. The building offers coin-op laundry, mail delivered to your mailbox downstairs in the front lobby, a community room, a sun room, assigned parking spot, and a limited number of garden plots in the back. Vista Prieta is centrally located off 17th Ave in Live Oak, making it convenient to get to so much of what mid-county has to offer. Please note: This unit is reserved for a buyer(s) who is 62 or older AND qualifies to pu
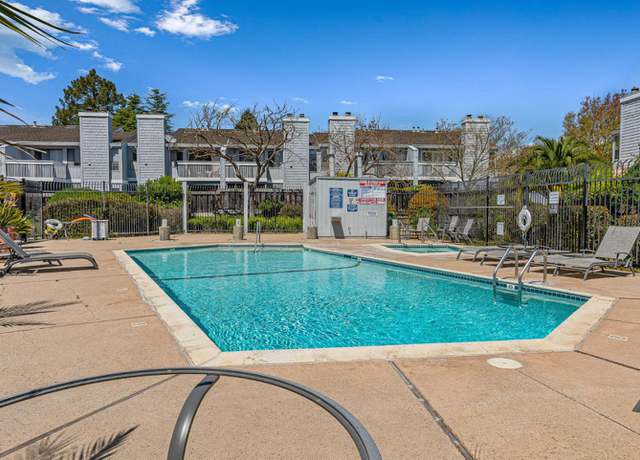
Brand new 3 bedroom 2 bath manufactured home in the best Soquel senior community! Stainless steel appliances, granite countertops, laminate floors throughout and 9 foot ceilings. Community has a clubhouse and pool area.
Savor the serene and peaceful lifestyle that awaits you in Sorrento Oaks, a highly sought-after, resident-owned senior park. This bright, south-facing home is a rare opportunity to enjoy the tranquility of park living. As you step inside, you'll be greeted by soaring vaulted ceilings and a cheery open floor plan that integrates a spacious, updated kitchen with ample counter space, a gas stove, stainless fridge, bar/counter, and Maple cabinetry into the dining and living space. Natural light floods the home, creating the perfect environment for your cherished houseplants. The primary bedroom is a haven of comfort, offering a private entrance to a secluded yard, an adjoining bathroom, and a w
Highly desirable 55+ senior community close to downtown Soquel. New in 2000, this double wide, modern manufactured home looks like new inside with attractive finishes. There is abundant space and light with vaulted ceilings, large living room and a family room with granite counter tops and stainless appliances in the kitchen and a large primary suite with tub and shower plus a separate laundry room inside and exterior carport. Sunshine all day long from the exterior deck with small garden area. Enjoy the community clubhouse and pool. Close to everything in Santa Cruz and the beaches.
One of the true Gems of the Quality Homes Luxury Portfolio and a must see! Built in 2015 this beautiful 1365SF, 2BR+Den home is in wonderful, move in ready condition. The rare perimeter lot has a backdrop of trees at the rear, a wonderful, private concrete patio, large shed/workshop, huge side yard for plants and pets and a spacious front deck with a beautiful view of the mountain. Inside, you will find excellent Quality throughout, a unique floor plan design with large rooms, wide doorways and hallway, tons of closet and cabinet space and pantry storage, beautiful kitchen, baths and gorgeous counters and floors. Large windows, skylights and solar tubes flood the house with light and the o
Approved project is at 3212 Mission, Santa Cruz. 21 units, 10 duet homes and one single family. Plans and Conditions of Approval. Construction docs submitted, buyer will have to record final map prior to permits being issued. Market Rate Units as proposed 18 market rate units, plus two moderately affordable units and one low income unit. Best of modern living located at Mission Dr. and Thurber Ln. near Dominican Hospital. Striking modern lines express a clean, minimalist style. Exceptional natural lighting, metal framed windows, and modern finishes combine to create an ambiance of sophisticated style. The high-performance energy efficient solar homes feature 3 bedrooms and 2.5 Baths, approx
Charming ground unit Condo located in a quaint complex with only 20 units. Well appointed floorplan with lots of natural light; Large Family room, 2 large bedrooms, 1.5 bathrooms, indoor laundry and front and back patios. Situated in the desirable live oak community. Walking and biking distance to multiple beaches, Crows Nest, Harbor Cafe, Capitola Mall, and many more local favorites. Easy Commute access with Capitola road , Soquel Ave and and Highway 1 nearby. A wonderful and affordable option for those looking for the perfect Santa Cruz work-Life balance.
Location, location, location! Vista Prieta is a senior, Measure J condo complex situated in a VERY convenient spot for getting around mid county. This clean, upstairs 1 bedroom, 1 bathroom unit is in great shape and ready to sell. Coin-op laundry rooms are available on each floor of the building, your mail is delivered to the mailboxes in the front lobby, and you have your own assigned parking spot. Use the community room to work on a puzzle or play cards with a friend. PLEASE NOTE: This unit is reserved for a buyer(s) who is 62 or older AND qualifies to purchase under the current Measure J requirements. PLEASE CAREFULLY REVIEW THOSE REQUIREMENTS WITH YOUR REALTOR AND LENDER PRIOR TO VIEWIN
Start Your New Year in this Never Lived in Beautiful New Home. 3 bedrooms. 2 full baths. Enjoy an energy efficient, well insulated, everything has a warranty, Home. there is an extra Large - New Carport with an Insulated Carport awing. Top of the line everything. A must see. The views of the Mountains are beautiful. Sometimes there are lama's and other critters to look at. The best location in this community that is for the young of 55 yrs old or better, park. Pets on approval.
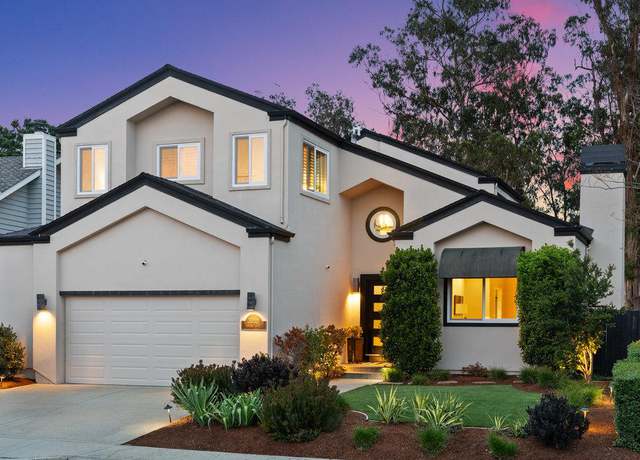
Big, Beautiful & Remodeled! Come check out this squeaky clean 4 Bedroom 3 1/2 bath home with distant ocean views! Three levels allows separation yet all can come together on the middle floor! Centrally located near excellent schools, easy freeway access, shopping, hospitals and more! Granite counters in kitchen, primary bathroom and half bath! Imagine unwinding after a tough day in the jacuzzi tub and enjoying the ocean view and perhaps your favorite spirit! Remodeled in 2017! This home has a oversized (tall) one garage, a full sized F350 will fit in here! Low maintance yard makes for easy care and a planter box in back yard if you want to have a garden! They've grown pumpkins, fr
Price slashed $200k+ to sell. Seller also may carry up to $1,000,000 for 2 yrs. Rare BRAND NEW 4+ Br/2.5bth-1815 sq ft main house and an attached but very private , legal 2Br/1.5 BTh- 800 sq ft ADU. Sq ft included ADU. The layout works for multiple living arrangements and provides many options to produce income to defer housing expenses. Live in either side and rent other side or rent both to maximize income and invest in rare newly constructed home. Both house and ADU have individual, fenced and private rear yards that extend living area and to enjoy outdoor space. The heigh ceilings throughout and sparkling new appliances etc invite this homes first owner. Downstairs is an extra room eith
This terrific buy is a beautiful home in a great location on a large lot with a mature garden. You must see it to believe it. Major concerns about an older mobile home do not apply here. The Owners renovated it for their own security; upgraded electrical, a new furnace and automatic thermostat, new hot water heater, stove, microwave/oven combo built in, bathroom features and fixtures (ADA compliant, low flow), doubled paned custom treated windows, animal proofing underneath, new paint, and a gorgeous custom designed redwood porch as an extra space for sitting/plants - all no more than 7 years old! Sorrento Oaks is an over 55 community within walking distance of the Harbor, beach and restau
62 or older and on a tight budget? This condo might just be a great fit for you! Vacant, ready to show and sell, this upstairs, one bedroom, one bathroom condo in Live Oak has a nice kitchen, large pantry closet, fresh paint, new carpet, new blinds, new faucets, and new water heater. The unit is light and bright, with an upstairs view out the back. The building offers coin-op laundry, mailboxes in the front lobby, a community room, sun room, and a select number of garden plots on site. Vista Prieta is centrally located off 17th Ave in Live Oak, making it close to so much of what mid-county has to offer. PLEASE NOTE: This unit is reserved for a buyer(s) who is 62 or older AND qualifies to pu
With its prime location near beaches and desirable features like attached garages, fenced yards, and laundry hook-ups, this fourplex offers both convenience and comfort. It provides newer furnaces, water heaters, and windows. The floorplans are spacious and bright. With the potential for further improvement, this fourplex presents a great opportunity for investors looking for a multi-unit property with upside potential.
School data is provided by GreatSchools, a nonprofit organization. Redfin recommends buyers and renters use GreatSchools information and ratings as a first step, and conduct their own investigation to determine their desired schools or school districts, including by contacting and visiting the schools themselves.Redfin does not endorse or guarantee this information. School service boundaries are intended to be used as a reference only; they may change and are not guaranteed to be accurate. To verify school enrollment eligibility, contact the school district directly.
Live Oak, California boasts a convenient transportation system with several options for residents. For those who prefer to drive, traffic levels are typically moderate, providing a relatively smooth commute for car owners. Public transportation is also available, offering a viable alternative for those without access to a car. Additionally, Live Oak is conveniently located near several major highways, making it easy for residents to travel to nearby cities and towns.
What types of properties are available in Live Oak?
Live Oak, California offers a variety of single-family home types, including ranch-style, contemporary, and modern designs. These homes can be found throughout the town, with some located in established neighborhoods and others in newer developments. Most properties feature 2-4 bedrooms and were built within the last 10-20 years. To explore different property types for sale in Live Oak, California, use the 'Home type' filter located above the active listings. Customize your search by selecting options like single-family homes, condos, townhomes, and more.
What is life like in Live Oak?
Live Oak, California offers a serene and picturesque environment with stunning natural beauty. The region boasts a diverse topography, ranging from rolling hills to lush farmlands. The weather is characterized by mild winters and warm summers, providing an ideal climate for outdoor activities. The area presents a range of job opportunities, particularly in agriculture, manufacturing, and education sectors. Residents can enjoy a variety of recreational pursuits, such as hiking, fishing, and exploring local parks and trails.
What are the schools and amenities like in Live Oak?
Live Oak, California offers a variety of public amenities to its residents. The town boasts a selection of restaurants for dining options. For outdoor enjoyment, there are parks available for public use. Grocery stores are also present in the area, providing convenient access to daily necessities. Additionally, more amenities such as schools, libraries, and retail stores are available within the town's boundaries.
In the past month, 8 homes have been sold in Live Oak. In addition to houses in Live Oak, there were also 7 condos, 2 townhouses, and 1 multi-family unit for sale in Live Oak last month. Live Oak is a moderately walkable city in Santa Cruz County with a Walk Score of 56. Live Oak is home to approximately 16,966 people and 6,734 jobs. Find your dream home in Live Oak using the tools above. Use filters to narrow your search by price, square feet, beds, and baths to find homes that fit your criteria. Our top-rated real estate agents in Live Oak are local experts and are ready to answer your questions about properties, neighborhoods, schools, and the newest listings for sale in Live Oak. Our Live Oak real estate stats and trends will give you more information about home buying and selling trends in Live Oak. If you're looking to sell your home in the Live Oak area, our listing agents can help you get the best price. Redfin is redefining real estate and the home buying process in Live Oak with industry-leading technology, full-service agents, and lower fees that provide a better value for Redfin buyers and sellers.


 REDFIN IS COMMITTED TO AND ABIDES BY THE FAIR HOUSING ACT AND EQUAL OPPORTUNITY ACT. READ REDFIN'S FAIR HOUSING POLICY AND THE NEW YORK STATE FAIR HOUSING NOTICE.
 United States
 Canada