Single Family Home nestled in a prime location, this property boasts everything you've been searching for -- 4 spacious bedrooms, 2.5 baths, 2 car garage (attached). A private pool in the backyard, hosting gatherings will be a breeze with ample space for entertaining, both indoors and out. Situated near top-rated schools, picturesque parks, trendy shopping destinations, and delectable dining options, you'll have everything you need right at your fingertips. Plus, easy access to major freeways ensures that your daily commute is a breeze. Don't miss out on the opportunity to make this your forever home.
Prepare to be impressed by this meticulously maintained home, where a series of thoughtful upgrades have been carefully implemented in recent years, ensuring both modern comfort and timeless appeal. Upon entry, you'll immediately appreciate the seamless fusion of contemporary convenience and classic charm. Throughout the interior, newer flooring adds a touch of elegance while offering durability for everyday living. Every room is adorned with double pane windows, not only enhancing insulation but also ensuring a tranquil atmosphere by reducing outside noise. The heart of the home, the kitchen, has been completely revitalized with new tiles, cabinets, and countertops, creating a culinary hav
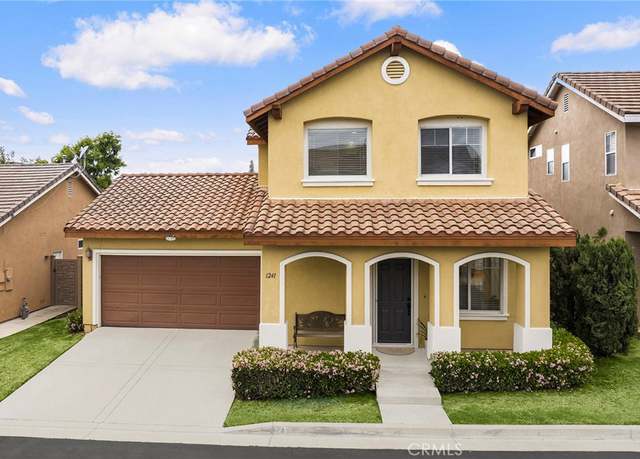
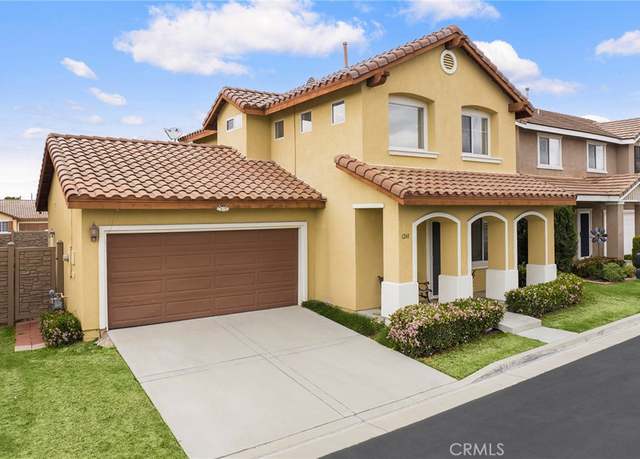
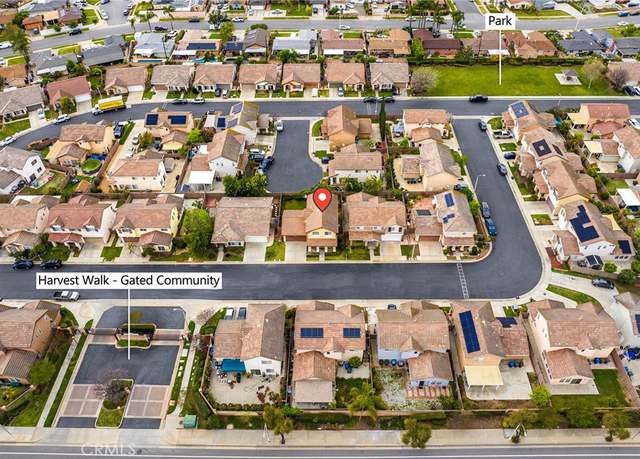
Stunning 2 Story Home in desirable Gated Community. This adorable home built in 2000, titled as detached condo (No Common Walls) comes turnkey with a designer's touch and lot upgrades. Step through the front door and enjoy this bright and airy open floor, Cozy Living Room with fabulous fireplace, large sliding door leads to the neat backyard. This wonderful home offers Upgraded SPC floor throughout/ Remodeled kitchen and Bathrooms with Quartz Counter Tops and Self-closing Cabinets/ Newer Stainless Appliances/ Walk-in Closet/ Recessed Lights /Dual pane windows /Water purifier system /Newer paint throughout and so much more to offer! Super Convenient location! Super FWY access. Must SEE!! *
Great home for first time homebuyer or investor, located in Valinda, border with West Covina. Living room with fireplace. Convenient location, close to shopping and transportation.
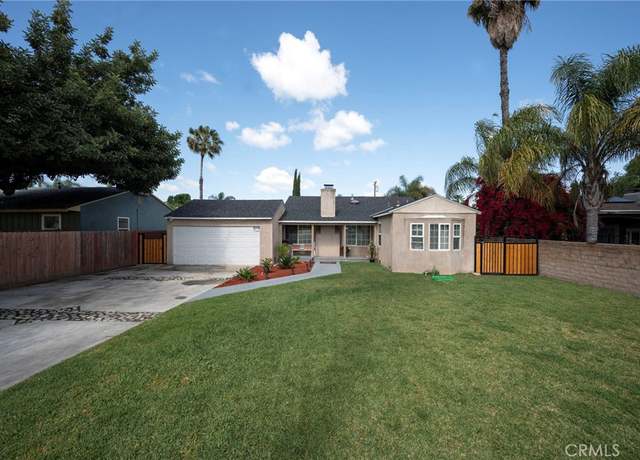
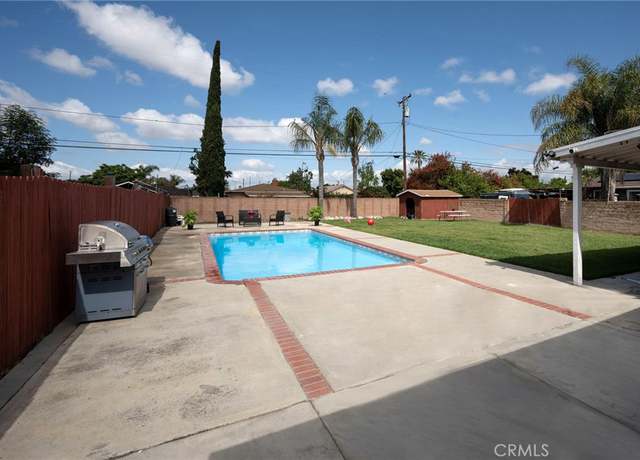
Entertainer’s Delight! This 4 bedroom, 2 bath single level home in West Covina features a living room entry with fireplace and kitchen with eating area that leads to two large covered patios. Fully gated backyard with fruit trees is private and a safe place for the kids and pets to play. Plenty of parking on the driveway and inside the oversized 2-car garage. There is also a detached ADU with small kitchen in the backyard, perfect for visiting guests, in-laws, or to rent out for extra income (Buyer to verify permits directly with the city). Great location. Residential neighborhood but also conveniently located near shopping centers, schools, Pacific Palms Resort, the 60 and 10 freeway
Incredible Investment Opportunity in Prime Location Welcome to your next lucrative venture! This fantastic property is now gracing the market, offering an unparalleled opportunity for savvy developers and investors alike. Nestled in a coveted location, this gem boasts not only a spacious 4-bedroom, 2-bathroom main residence but also a detached 1-bedroom, 1-bathroom casita, all situated on an expansive lot spanning 14,571 square feet. And that's not all! Surrounding lots in the area have been recently subdivided, hinting at the burgeoning development opportunities that await. Capitalize on this trend and unlock even greater potential for growth and profit. Don't miss out on this golden oppo
Orignal stucco, was well kept from original owner, there is back unpermitted structure, buyer shall do their own due diligent. Very conveniently located in the heart of La Puente and easy access to most major supermarkets within 5 minutes driving. Property is occupied by TENANT, DRIVE BY ONLY. Major price reduction for quick sale, it is fully rented with $4100 monthly. Best for 1031 exchange investor, and big lot for long term potential. Possibility of apply for ADU with County of Los Angeles, buyer do their own diligent, good for raise big family.
Wonderful Single Level Home w/ Excellent Business Opportunity! Nestled in a prime location this one of a kind floor plan offers 8 bedrooms plus an office & 4 bathrooms, appx. 2,550 sq ft of abundant living space on appx. 10,257 sq ft lot! This home is being sold with a Licensed Adult Day Care business! Great as an owner occupied residence / business opportunity & more! Bonus features inc: New Roof, New Water Heater, Central AC, Ceiling fans & more! Oversized driveway & Carport for ample parking. Centrally located near shopping, parks, grocery stores, dining, entertainment, schools & easy 10/60 freeway commute! Don't miss the Once in a Lifetime Investment Opport
Prime vacant lot nestled in a thriving, well-established neighborhood of West Covina. Surrounded by schools, convenient shops, major freeways, and enticing restaurants, this parcel offers an ideal canvas for your dream home or investment opportunity. With its central location and abundant amenities, seize the chance to create your own oasis in this coveted community.
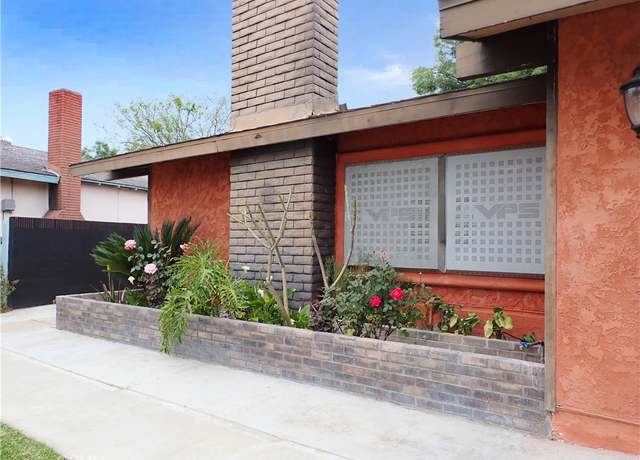
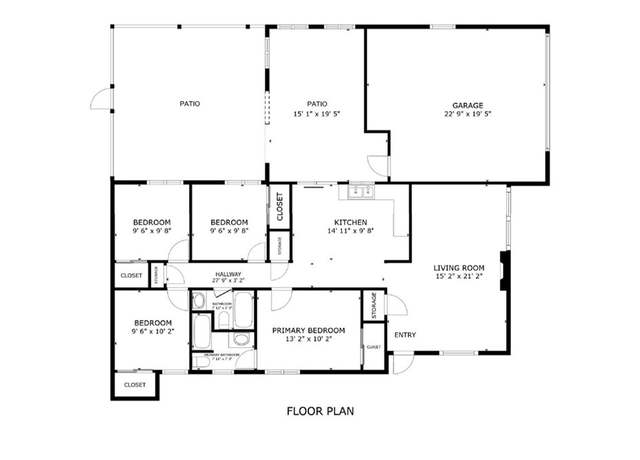
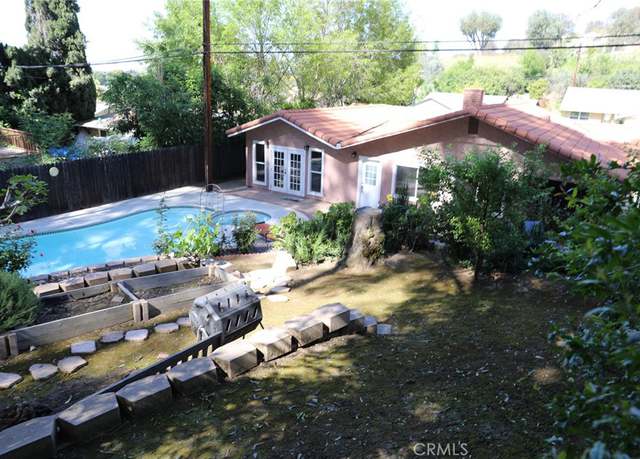
Coming Soon. First open houses Saturday May 4th and Sunday May 5th. First time on the market since 2007 and has everything you want. Arguably the nicest house on the street and situated on a lot that won't disappoint that backs up to a wooded hillside. In the backyard is a swimming pool that was newly resurfaced. Pool also has hot tub that cascades into pool. Everything in the home has been updated. You won't see a master bedroom in a 1956 built home that rivals this one. In 2015 a new addition was added that doubled the size of the master bedroom that overlooks the pool as well as a modern 3rd full bath was built into the master bedroom. The shingled roof was upgraded to a tiles. Two bedro
Discover the epitome of luxury living in West Covina with this meticulously remodeled 3-bedroom, 2-bathroom home. From the moment you step inside, you'll be captivated by the modern finishes and the beautifully renovated pool. Prepare to be enchanted by the elegance of marble quartz countertops in the kitchen and bathrooms, elevating the space with a touch of opulence. With a modernized electrical panel boasting 200 amps and solar readiness, efficiency and sustainability are seamlessly integrated into your everyday life. The abundance of recessed lighting casts a soft glow that enhances the atmosphere in every room. The bathrooms have been thoughtfully upgraded with stand-up showers and van
Introducing a remarkable investment opportunity at 2453 South Ridgewood Dr. in the vibrant community of West Covina. This exclusive property consists of four townhome-style units, offering a unique blend of style and functionality, perfect for prospective tenants or as an income-generating asset. * * Location and Accessibility: * * - * * Schools: * * The property is in close to top-rated local schools, including options for K-8, enhancing appeal for families. - * * Shopping and Dining: * * Just a short drive from Plaza West Covina, a premier shopping and dining destination with over 185 stores and restaurants, including Nordstrom Rack and Bath & Body Spas. Conveniently loc
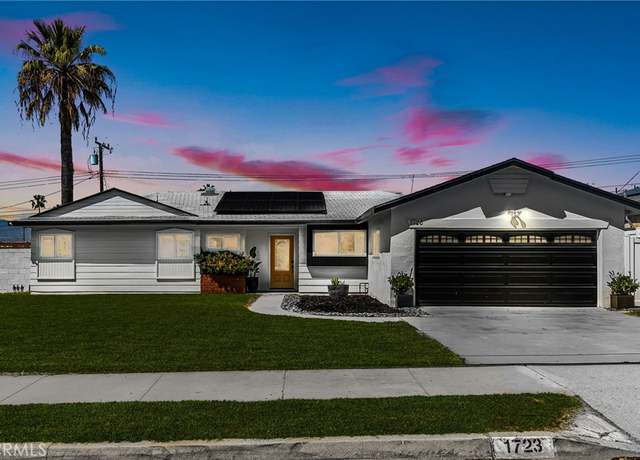
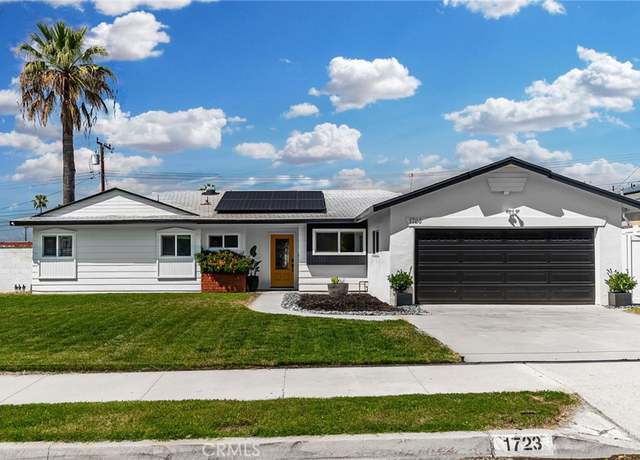
Exceptionally Captivating, Entertainment friendly, One level Home with Owned Solar, EV Car Charger and Huge Backyard! Centrally located in a sought-after area just moments from schools and restaurants, this 3BR/2BA, 1,400+sqft residence emanates an upscale aesthetic with picturesque landscaping, recently painted exterior, and a vibrant front door. Beautifully fashioned for contemporary lifestyles, the immaculate interior features an openly flowing layout, beautiful flooring, crown molding, attractive interior paint hues, and a spacious living room with double sliding glass doors that lead out to the gorgeous backyard. The thoughtfully updated gourmet kitchen dazzles with stainless-steel app
Beautiful house on the top of Hillcrest Community, no common wall, city view from most of the rooms, overlook the community swimming pool and the greens, very quiet and safe community, largest model in this community with 4 bedrooms & 2 full baths upstairs, one half bath with laundry area downstairs, large room concept with family room, breakfast nook & kitchen connected together so you can cook & be with the family at the same time, fireplace in family room for you to enjoy, huge size patio to view the pool area, city view and the greeneries. 2 cars garage with lots of storage cabinets, indoor laundry for your convenience. Easy access to I-10 & I-60; closed to schoo
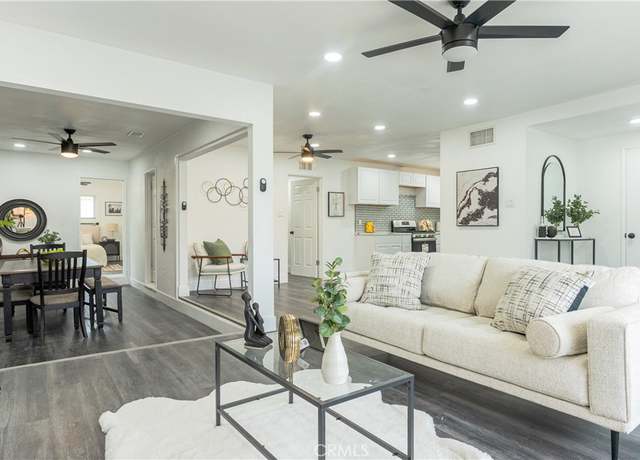
Come home and unwind to this amazing 3 bedroom 2 full bath turn key property. A true gem, one of a kind meticulously upgraded home awaits you. As you step into the living room enjoy the high ceilings with exposed wood beams & wood burning fire place and cozy dining room area. Entertain family and friends with this beautiful modern kitchen with all new quartz counter tops, new cabinetry with self closing drawers & custom built floating shelves. All stainless steel appliances are included. Step out onto your private 'backyard retreat' with a covered patio excellent to relax and entertain making new memories. New laminate flooring, baseboards, bathrooms, closets, interior doors.
Great Opportunity to own this lovely condo located in the desirable Woodside Townhomes Community in West Covina. Its 2 bedrooms and 2 full baths provide comfortable living space, and the spacious kitchen and dining area offer room to entertain. The private front patio is a great bonus for enjoying outdoor relaxation. Plus, having side by side assigned carport and parking space nearby adds convenience. The community amenities, like the pool, spa, playground, and sports court, enhance the overall living experience. And with its convenient location close to shops, restaurants, and easy freeway access, it offers both convenience and accessibility. Overall, it seems like a wonderful place to cal
LOCATION! SINGGLE STORY! HUGE LOT FOR ADU! ALL IN ONE! Welcome to this single story ranch home located in convenient neighborhood. Beautiful well-maintained front and back yard. Huge backyard has a good size of hardscape, a wide paved side yard good for storage and potential parking! This charming home offers 4 bedroom and 2 full bathroom. Upgraded fashion Luxury Vinyl flooring that flows from entry into kitchen and open family room with cozy gas fireplace. Everything is done - new fresh paint, all dual paned windows, doors and sliders, bathrooms with new fixtures and recessing lighting. This property also includes a long driveway in the back. Huge side lot approved for potential ADU. Close
Welcome to this rare & unique 2-STORY beauty in the area which is fully upgraded 4-Bedroom 3-Bath POOL home with tons of amazing trendy twists. Follow a paved walkway, you are invited to this exceptionally stylish house: Open & bright LIVING ROOM that perfectly punctuated with a cozy electric FIREPLACE and expansive picture windows filled with natural lights and breeze. Your families will celebrate many memorable events around the detailed GOURMET KITCHEN which cheerfully embraced by popular white shaker cabinetry, matching soft gray quartz countertops, stainless steel appliances (36" five-burner GAS cooktop, double ovens, and rangehood with "gesture controlled" L
Welcome to this exquisite turnkey sanctuary, where comfort intertwines seamlessly with style. This home boasts two levels of elegant living, with the upper floor hosting two cozy bedrooms, luxurious bathrooms. Downstairs, you'll discover a remarkable living room and another well-appointed bathroom and bedroom. The master bedroom is a retreat in itself, featuring its own private restroom for a truly indulgent experience. Outside, the expansive patio beckons, offering ample space for entertaining guests and crafting unforgettable memories. From the welcoming entrance to the meticulously designed kitchen, every corner of this home invites you to embrace a life filled with comfort and delight.
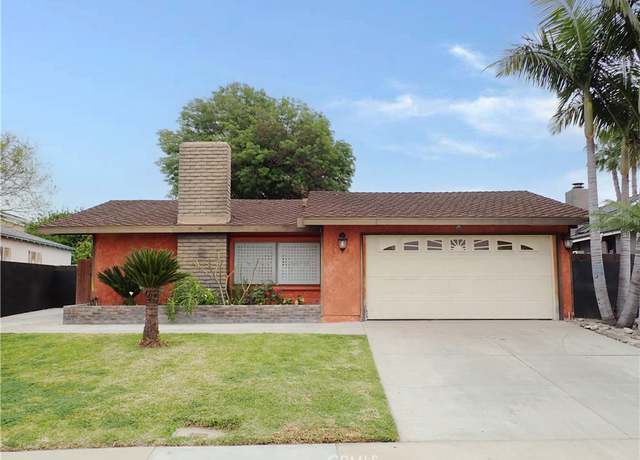
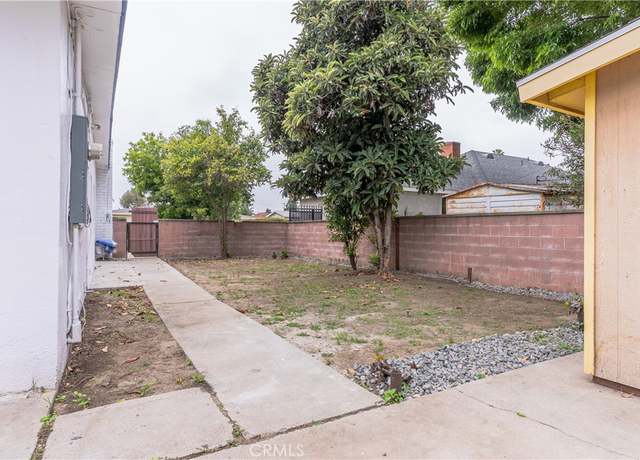
Beautiful Single-Story Home, Located In The Desirable City of La Puente! in a cul-de-sac. Pride of Ownership" This Home Features, A single-story layout with 3 bedrooms and 2 bathrooms, a cozy living room with a chimney, and tile flooring throughout making it both comfortable and stylish. The backyard and rear patio seem like perfect spaces for family gatherings and relaxing summer evenings. The inside laundry area and detached 2-car garage add convenience and storage options.
Welcome to an exciting opportunity to acquire a prime piece of land in the vibrant City of West Covina, accompanied by approved development plans that pave the way for a seamless project execution. Nestled within the dynamic city limits of West Covina, this parcel of land is strategically positioned for a custom home. Convenient access to major transportation arteries and proximity to urban amenities. The property comes with a defined zoning status, offering clarity on permissible land use. Furthermore, this opportunity is accompanied by meticulously reviewed and approved development plans. With approved plans in hand, this property presents a rare chance for investors, developers, or busin
Property is in escrow but taking back up offer. Beautiful 4 Bedroom 2 Bath home offers more space than you can imagine. The Great Room and Large Master Bedroom. The Backyard is Perfectly manicured and cared for and also offers a covered patio and large storage shed. Great home in a great area - close to school, park, shopping and transportation. Ideal for a large family. .
This area's enrollment policy is not based solely on geography. Please check the school district website for more information.
Elementary schools
Middle schools
High schools
GreatSchools Summary Rating
6/10
Baldwin Academy
Public, K-6
6/10
Fairgrove Academy
Public, K-8
5/10
Del Valle Elementary School
Public, K-6
5/10
Grandview, College Preparatory Academy
Public, K-8
5/10
Valinda School of Academics
Public, K-8
Only showing 5 of
6 elementary schools.
School data is provided by GreatSchools, a nonprofit organization. Redfin recommends buyers and renters use GreatSchools information and ratings as a first step, and conduct their own investigation to determine their desired schools or school districts, including by contacting and visiting the schools themselves.Redfin does not endorse or guarantee this information. School service boundaries are intended to be used as a reference only; they may change and are not guaranteed to be accurate. To verify school enrollment eligibility, contact the school district directly.
Valinda, California offers a variety of transportation options for its residents, including both private and public modes. For those who prefer to drive their car, it's important to note that traffic levels can vary, often peaking during rush hours. The region is well-connected with several nearby highways and freeways, facilitating smooth travel in and around the area. Public transportation is also available in Valinda, with bus services providing a convenient alternative to driving.
What types of properties are available in Valinda?
Valinda, California offers a variety of single-family home types, including ranch-style homes, contemporary homes, and modern homes, among others. These homes can be found throughout the Valinda area, with options available in different neighborhoods and communities. Most properties in Valinda feature 2 to 4 bedrooms and were built in various years. To explore different property types for sale in Valinda, California, use the 'Home type' filter located above the active listings. Customize your search by selecting options like single-family homes, condos, townhomes, and more.
What is life like in Valinda?
Valinda, California offers a peaceful and serene living experience with its beautiful surroundings. The landscape is characterized by picturesque hills, lush greenery, and a variety of flora and fauna. The weather in Valinda is pleasant, with mild winters and warm summers. The area provides a range of job opportunities across various industries, ensuring a diverse and thriving economy. Residents can enjoy engaging in a multitude of recreational activities such as hiking, biking, and exploring local parks.
What are the schools and amenities like in Valinda?
Valinda, California provides a range of public amenities for its residents. There are a variety of restaurants offering diverse cuisines to satisfy your taste buds. For those who enjoy the outdoors, there are several parks available for leisure and relaxation. Grocery stores are conveniently located throughout the area, making shopping for daily necessities easy. Additionally, other amenities such as fitness centers, libraries, and community centers are available to cater to the varied interests of Valinda residents.
In the past month, 5 homes have been sold in Valinda. In addition to houses in Valinda, there were also 0 condos, 0 townhouses, and 1 multi-family unit for sale in Valinda last month. Valinda is a moderately walkable city in Los Angeles County with a Walk Score of 54. Valinda is home to approximately 22,375 people and 1,153 jobs. Find your dream home in Valinda using the tools above. Use filters to narrow your search by price, square feet, beds, and baths to find homes that fit your criteria. Our top-rated real estate agents in Valinda are local experts and are ready to answer your questions about properties, neighborhoods, schools, and the newest listings for sale in Valinda. Our Valinda real estate stats and trends will give you more information about home buying and selling trends in Valinda. If you're looking to sell your home in the Valinda area, our listing agents can help you get the best price. Redfin is redefining real estate and the home buying process in Valinda with industry-leading technology, full-service agents, and lower fees that provide a better value for Redfin buyers and sellers.


 REDFIN IS COMMITTED TO AND ABIDES BY THE FAIR HOUSING ACT AND EQUAL OPPORTUNITY ACT. READ REDFIN'S FAIR HOUSING POLICY AND THE NEW YORK STATE FAIR HOUSING NOTICE.
 United States
 Canada