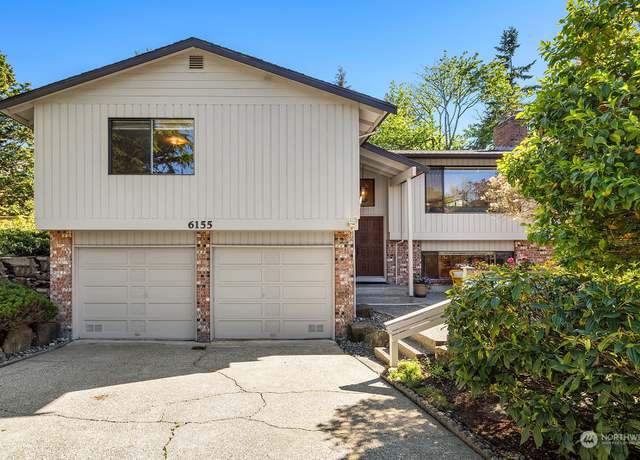
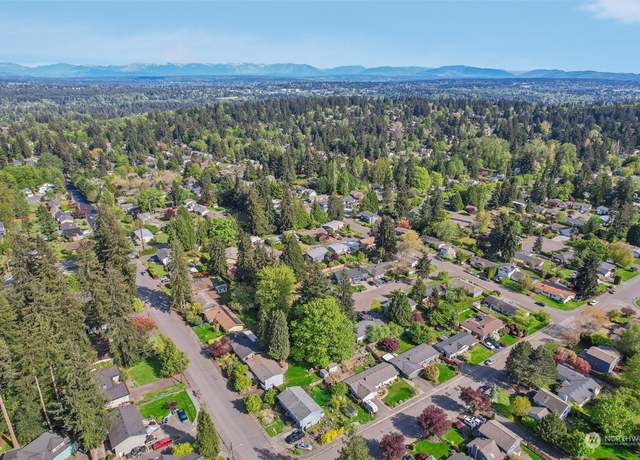
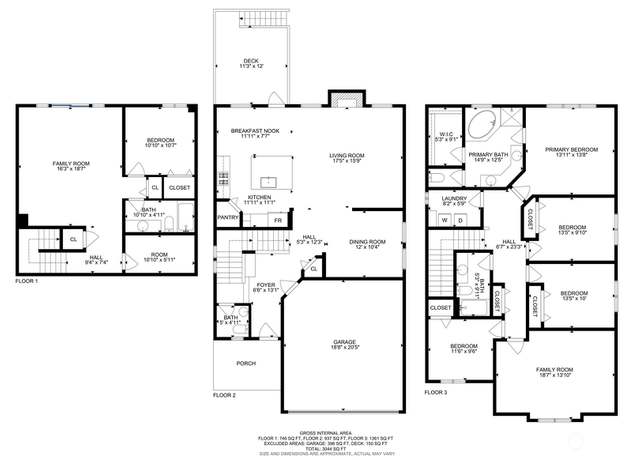
Conveniently located only 4 minutes from the North shore of Lake WA and Aqua Club, this home is nestled at the end of a cul de sac in the sought after Lakemore Estates neighborhood within the Kenmore community. Enjoy over 2,300 square feet of living space including 4 bedrooms, 3 bathrooms (one full, two 3/4), generous 2 car garage. The primary suite features its own attached 3/4 bathroom plus spacious walk-in closet. The walkout daylight basement includes an oversized rec/bonus room, 3/4 bathroom with laundry room plus office or 5th bedroom. The home sits on a private 1/3 acre lot that backs to a protected green space providing a tranquil sun drenched setting that is perfect for gardening o
1/35
$1,000,000
4 beds3 baths2,310 sq ft0.32 acre (lot)
6155 NE 192nd St, Kenmore, WA 98028
Listing provided by NWMLS as Distributed by MLS Grid
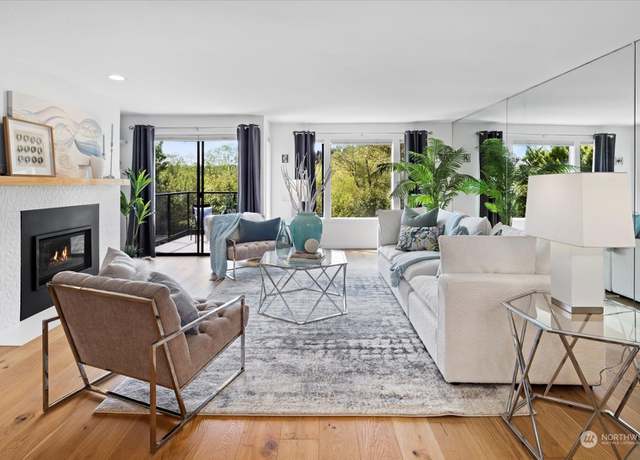
Gorgeous remodeled townhome with fabulous views of Lake Washington, Log Boom Park & Pier. Enjoy tall ceilings, Engineered hard woods, quartz counters, stunning natural light, Kitchen fully updated with luxury backsplash, pull out shelves, quality stainless appliances and high end cabinetry. Spacious living room offers a gas fireplace with striking custom tile surround and wet bar. Gracious Primary Suite features a second fireplace and lake views. Large ensuite with large tile shower. Reserved covered parking with 2 spaces, and storage enhance convenience. Amenities include elevators, courtyard, wonderful outdoor pool and hot tub with fabulous views of the lake and marina. Harbour Vill
1/23
$899,950
2 beds2.5 baths1,460 sq ft1 sq ft (lot)
6121 NE 175th St Unit A304, Kenmore, WA 98028
Listing provided by NWMLS as Distributed by MLS Grid
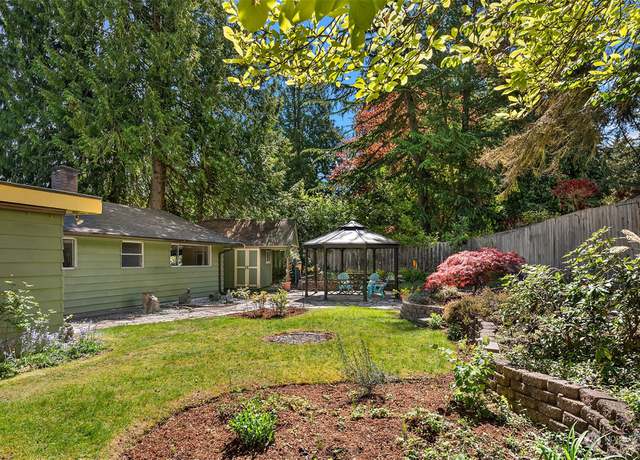
Mid-Century Rambler with great floor plan in desired Kenmore location. This 1,620 SF one-level home lives large with spacious living room w/ fireplace, window seat and custom wainscoting. Remodeled kitchen with gorgeous cherry cabinets w/ pewter pulls, an abundance of cabinets, huge dining room. 3 bedrooms and 1.75 baths. Large laundry room with extra hobby & storage space. New interior paint. Hardwood floors. If you love spending time outdoors you will enjoy the beautiful private backyard with garden space, slate patio with gazebo, 10x15 shed and 12x20 small shop w/ loft & 220amp. Home is pre-inspected. Located just minutes to all amenities, parks and miles of trails. Northshor
1/22
$775,000
3 beds2 baths1,620 sq ft0.23 acre (lot)
18741 60th Ave NE, Kenmore, WA 98028
Listing provided by NWMLS as Distributed by MLS Grid
Escape to your private haven in Finn Hill! This meticulously maintained rambler seamlessly blends modern updates with timeless charm. Enveloped by mature landscaping, the expansive yard offers unparalleled privacy. Inside, discover fresh paint throughout, new bedroom carpeting, and chic vinyl plank and bamboo flooring. The spacious kitchen with plenty of cabinet space, flows into a dining area perfect for entertaining. Cozy up by the fireplace in the living room or unwind in the family room with direct access to your personal hot tub oasis. Additional highlights include a separate laundry room, oversized garage with workshop space, and coveted location in the esteemed Lake Washington School
1/40
$950,000
3 beds1.5 baths1,290 sq ft0.23 acre (lot)
14412 83rd Pl NE, Kirkland, WA 98034
Listing provided by NWMLS as Distributed by MLS Grid
Meticulously maintained and elegant, this open and light-filled DR Horton home is a must-see. Main floor features open kitchen with a huge island, walk-in pantry, and a gas stovetop with a newer range hood. It also includes a formal living room and dining room. Upstairs, you'll find a large primary suite with a 5-piece en-suite bathroom and walk-in closet, three additional generously sized bedrooms, plus a bonus room. The lower level offers a bedroom, full bathroom, family room, and extra storage space. The large deck and fully fenced backyard are perfect for relaxation and outdoor gatherings. Award winning Northshore schools. Quick access for commutes to Seattle and the Eastside. Pre-inspe
1/40
$1,480,000
5 beds3.5 baths3,040 sq ft5,400 sq ft (lot)
7514 NE 166th St, Kenmore, WA 98028
Listing provided by NWMLS as Distributed by MLS Grid
Welcome home to your beautifully updated two story in the sought after Finn Hill community. Step through your front door to soaring ceilings and fresh interior paint. True great room with cozy fireplace and immense natural light. Kitchen equipped with breakfast bar, quartz countertops, spacious pantry and stainless-steel appliances. New carpet upstairs. Grand primary suite with vaulted ceiling, custom walk-in closet and spa-inspired ensuite. Your own outdoor oasis. Deck overlooking your meticulously maintained, fully fenced yard with garden space. Professionally landscaped. Situated in desirable cul-de-sac. A/C, two car garage and tankless water heater. Incredible location! Easy access to I
1/40
$1,399,000
4 beds2.5 baths2,310 sq ft7,329 sq ft (lot)
9050 NE 145th Pl, Kenmore, WA 98028
Listing provided by NWMLS as Distributed by MLS Grid
Charming Craftsman-style residence nestled in a serene cul-de-sac, situated in the sought-after Kenmore area. This inviting home boasts a naturally illuminated open floor plan, encompassing 4 bedrooms and 2.5 baths. The expansive Master bedroom includes an ensuite and walk-in closet for added convenience. New floor installed 2022, exterior repainted in 2020, new applicances last year. Enjoy the fully fenced, low-maintenance yard, perfect for entertaining and gatherings. Conveniently located with access to restaurants, Downtown Bothell, acclaimed Northshore Schools, and the 405.
1/37
$998,000
4 beds2.5 baths1,612 sq ft4,667 sq ft (lot)
8010 NE 183rd St, Kenmore, WA 98028
Listing provided by NWMLS as Distributed by MLS Grid
Close proximity to I-5 and 405. Surrounded by trees for privacy. Walk to Burke Gilman Trail, Lake Washington, & Kenmore Town Center. Immaculate home with many updates (see Broker Remarks in supplements). Pre-Inspection available after showing. 2 Separate Living spaces/entrances for multi-generation, rental, ABnB? 2 bed/1 bath down 3 bed/2 bath on main. Large great room living with refinished hardwood floors. Large kitchen has office space.
1/39
$1,450,000
5 beds3 baths3,100 sq ft0.43 acre (lot)
6409 NE 183rd St, Kenmore, WA 98028
Listing provided by NWMLS as Distributed by MLS Grid
At the north end of Lake Washington, * END UNIT lot A105 * at the Shore16 by MSR Communities offers an active lifestyle with the Burke-Gilman Trail to bike, numerous dining options, UW Bothell down the road, and Woodinville’s renowned wineries an easy distance away. Each home here boasts an incredible chef's kitchen w/ Quartz counters and Kitchen-Aid SS appliances along with central air, a Ring Doorbell, covered Trex deck, and a 2-Car garage. Create your perfect productivity or play space, or guest haven in the lower level guest-suite. Seattle and Bellevue are only 30 minutes away via Hwy 522. The Shore16 brings our region’s natural beauty and bustling tech hubs within an easy
1/27
$949,950
4 beds3.5 baths1,775 sq ft1,469 sq ft (lot)
18717 68th Ave NE Unit A105, Kenmore, WA 98028
Listing provided by NWMLS as Distributed by MLS Grid
Welcome to 25 Degrees, beautifully located in Kenmore! Our Dayton floorplan offers 2 bedrooms, 2 baths, and an additional flex room. With vinyl plank and quartz countertops all throughout, a large Owners suite + walk-in closet, and your own private balcony, welcome to luxurious living! Beautiful finishes and modern hardware, elevator access, secure garage and additional guest parking, this has it all! Like to entertain? Take advantage of the massive living + dining area, with loads of cabinet space. Meanwhile, you never have to worry about stairs again! Estimated completion date of Summer 2024. Buyer must register their broker at first visit by completing a Guest Registration Card. Broker r
1/14
$753,981
2 beds2 baths1,491 sq ft
18226 68th Ave NE #202, Kenmore, WA 98028
Listing provided by NWMLS as Distributed by MLS Grid
Discover Lakemont Estates in the highly desirable area of Kenmore. Drive to your new home on a picturesque dead end street. Your new home w/ Apex stairs entry, beautiful rod iron railing while admiring the mature landscaping. Vaulted ceilings, main floor w/ fireplace lead to updated kitchen! Each bathroom has been wonderfully updated. Gorgeous hardwood floors! Back patio is Apex as well and so very private and peaceful. Enter your primary through double doors & remodeled en-suite. Downstairs with another wood burning fireplace. ¾ bath downstairs w/ laundry another quiet bedroom. Detail & love has been given to this house is so noticeable! Northshore schools, easy access t
1/40
$1,150,000
4 beds3 baths2,300 sq ft6,900 sq ft (lot)
19322 Kenlake Pl NE, Kenmore, WA 98028
Listing provided by NWMLS as Distributed by MLS Grid
Beautiful, updated garden home in sought after waterfront, 55+ community! Caring ownership of this 2 bedroom, 1 bath home with many upgrades! You'll appreciate the new roof, the new carpet & flooring, new paint, new hot water tank and much more! Bright living room adjacent to the kitchen with eating area! Private owner suite at rear! Stainless kitchen appliances and washer/dryer included! Relax in your quiet garden oasis! 2 car carport or part entertainment patio! In the heart of Kenmore, this home is conveniently located close to all amenities; including shopping, bus, 405 & the Burke Gilman Trail! Park approval is required for leased land and pets. Your retreat waits for you!
1/14
$150,000
2 beds1 bath720 sq ft
7301 NE 175th St #321, Kenmore, WA 98028
Listing provided by NWMLS as Distributed by MLS Grid
Nestled in the evergreen hills of a quiet neighborhood sits * Lot 40 * of Rêve59, an MSR luxury community made up of 59 townhomes. Rare driveway parking spot + 2 car tandem garage. This modern 4 bed, 4 bath townhome offers an innovative floor plan w/ luxury finishes in more than 2,360sqft of living space, including a spacious bonus room. Premium lot home features deck/window views overlooking the evergreen surroundings and is located just around the bend from DT Bothell, the waterfront of St. Edwards Park, and is a block away from the 27-mile Burke-Gilman Trail. Within 30 minutes to top destinations including DT Seattle, Microsoft, Google, & DT Bellevue. Northshore SD. Est comp
1/34
$1,059,950
4 beds3.5 baths2,364 sq ft1,494 sq ft (lot)
8905 NE 173rd Pl Unit C, Bothell, WA 98011
Listing provided by NWMLS as Distributed by MLS Grid
Exceptional Custom Built NW Contemporary located in the sought after Arrowhead area. A true NW feel with towering evergreens, across from the Epic Saint Edwards Park trails and resting above Lake Washington on a shy acre lot. Enjoy decks, fire pit, trails, the Northshore Schools & Inglewood Country Club. New & refinished hardwood floors, wood & gas FP, new int paint, new roof & updated bathrooms. Very nicely remodeled kitchen area with quartz counters, shaker cabinets, high quality appliances & designer touches throughout. Primary suite includes a WIC & large bathroom. A great place to call home!
1/40
$1,599,950
4 beds3.5 baths3,550 sq ft0.90 acre (lot)
6314 NE 151st St, Kenmore, WA 98028
Listing provided by NWMLS as Distributed by MLS Grid
At the north end of Lake Washington, * lot A103 * at the Shore16 by MSR Communities offers an active lifestyle with the Burke-Gilman Trail to bike, numerous dining options, UW Bothell down the road, and Woodinville’s renowned wineries an easy distance away. Each home here boasts an incredible chef's kitchen w/ Quartz counters and Kitchen-Aid SS appliances along with central air, a Ring Doorbell, covered Trex deck, and a 2-Car garage. Create your perfect productivity or play space, or guest haven in the lower level guest-suite. Seattle and Bellevue are only 30 minutes away via Hwy 522. The Shore16 brings our region’s natural beauty and bustling tech hubs within an easy distance;
1/27
$919,950
4 beds3.5 baths1,775 sq ft1,090 sq ft (lot)
18717 68th Ave NE Unit A103, Kenmore, WA 98028
Listing provided by NWMLS as Distributed by MLS Grid
At the north end of Lake Washington, * lot A102 * at the Shore16 by MSR Communities offers an active lifestyle with the Burke-Gilman Trail to bike, numerous dining options, UW Bothell down the road, and Woodinville’s renowned wineries an easy distance away. Each home here boasts an incredible chef's kitchen w/ Quartz counters and Kitchen-Aid SS appliances along with central air, a Ring Doorbell, covered Trex deck, and a 2-Car garage. Create your perfect productivity or play space, or guest haven in the lower level guest-suite. Seattle and Bellevue are only 30 minutes away via Hwy 522. The Shore16 brings our region’s natural beauty and bustling tech hubs within an easy distance;
1/27
$919,950
4 beds3.5 baths1,775 sq ft1,091 sq ft (lot)
18717 68th Ave NE Unit A102, Kenmore, WA 98028
Listing provided by NWMLS as Distributed by MLS Grid
This meticulously renovated home perched near the end of a quiet dead-end street will squash your DIY dreams! Nothing to be done here, except move in & enjoy the fruits of this labor of love & serene park-like setting. The main floor features abundant natural light with a reimagined eat-in kitchen, formal dining & generous living room with gas fireplace, leading to an ample deck for al fresco summer nights & peekaboo mountain views. The primary bed & ¾ bath ensuite, 2 beds & full bath complete the main floor. The daylight basement offers a 2nd kitchen, bed, bath, rec room & generous laundry/mudroom. Oversized 1-car garage w/ bountiful storage
1/39
$1,150,000
4 beds3 baths2,350 sq ft0.33 acre (lot)
7217 NE 160th St, Kenmore, WA 98028
Listing provided by NWMLS as Distributed by MLS Grid
* NEW PLAN * Lot 23 of Rêve59, an MSR Communities luxury neighborhood features an innovative floor plan that showcases NEW soaring 13-foot ceilings and additional windows in the kitchen. The leveled upper two floors provide a seamless layout, complemented by the addition of a NEW bathroom. With 2147SF of living space, this 3-bed, 4-bath home also features a spacious bonus room, 2-car garage and a fenced yard. Enjoy summer from your rooftop deck overlooking Wayne Park and the Sammamish River. Located just around the bend from DT Bothell, the sprawling waterfront of St. Edwards Park, and just one block from the 27-mile Burke-Gilman Trail. Within 30 minutes to top destinations. Northsho
1/30
$1,074,950
3 beds3.5 baths2,147 sq ft1,025 sq ft (lot)
8904 NE 173rd Pl Unit B, Bothell, WA 98011
Listing provided by NWMLS as Distributed by MLS Grid
Welcome to the acclaimed Fishtail Cottage; a modern farmhouse nestled in Bothell's premiere private garden. Rustic allure meets modern elegance in this exquisite 5 bed, 4 bath home. Gourmet kitchen & open great room w/ soaring wood beam ceilings & panoramic garden views. Main floor primary suite features a serene sitting room, 5-piece spa-like bath, and expansive walk-in closets. Upstairs, a large bonus room with inviting private movie theater. The enchantment is truly pronounced with a Pinterest-worthy English Garden, adorned with flowing fountain, shabby chic chicken coop, and a stunning covered patio with stone fireplace and hearth. 1,500 sq ft walk-in crawl for ample storage
1/38
$2,195,000
5 beds4 baths3,840 sq ft0.24 acre (lot)
9027 NE 152nd Pl, Bothell, WA 98011
Listing provided by NWMLS as Distributed by MLS Grid
Nestled in the evergreen hills of a quiet neighborhood sits * Lot 41 * of Rêve59, an MSR luxury community made up of 59 townhomes. Rare driveway parking spot + 2 car tandem garage. This modern 4 bed, 4 bath townhome offers an innovative floor plan w/ luxury finishes in more than 2,360sqft of living space, including a spacious bonus room. Premium lot home features deck/window views overlooking the evergreen surroundings and is located just around the bend from DT Bothell, the waterfront of St. Edwards Park, and is a block away from the 27-mile Burke-Gilman Trail. Within 30 minutes to top destinations including DT Seattle, Microsoft, Google, & DT Bellevue. Northshore SD. Est comp
1/34
$1,059,950
4 beds3.5 baths2,364 sq ft1,494 sq ft (lot)
8905 NE 173rd Pl Unit B, Bothell, WA 98011
Listing provided by NWMLS as Distributed by MLS Grid
* NEW PLAN * Lot 22 of Rêve59, an MSR Communities luxury neighborhood features an innovative floor plan that showcases NEW soaring 13-foot ceilings and additional windows in the kitchen. The leveled upper two floors provide a seamless layout, complemented by the addition of a NEW bathroom. With 2147SF of living space, this 3-bed, 4-bath home also features a spacious bonus room, 2-car garage and a fenced yard. Enjoy summer from your rooftop deck overlooking Wayne Park and the Sammamish River. Located just around the bend from DT Bothell, the sprawling waterfront of St. Edwards Park, and just one block from the 27-mile Burke-Gilman Trail. Within 30 minutes to top destinations. Northsho
1/30
$1,099,950
3 beds3.5 baths2,147 sq ft1,437 sq ft (lot)
8904 NE 173rd Pl Unit C, Bothell, WA 98011
Listing provided by NWMLS as Distributed by MLS Grid
Stunning Northwest Contemporary home in wonderful Kenmore location! Step into this 3128sf home with grand entry and vaulted ceilings! This is a 5 bedroom & 3.5 bath home with great room concept. The kitchen is designed for a chef; including stainless steel appliances, gas stove, well-appointed cabinets and quartz countertops with brilliant subway backsplash. Spacious covered deck off kitchen plumbed for gas with steps to large, fully fenced backyard. Professionally installed surround-sound for maximum entertainment experience coupled with gas fireplace in the family room. Complete lower level mother-in-law with its separate bath and W & D. Home has A/C and fire-sprinkler system. F
1/20
$1,499,950
5 beds3.5 baths3,370 sq ft5,162 sq ft (lot)
16519 82nd Pl NE, Kenmore, WA 98028
Listing provided by NWMLS as Distributed by MLS Grid
Dble Wide mobile home in THE Pointe @ Lockwood 55+ cmnty in Bothell. Home has been updated & meticulously maintained. 3 bdrms (or den/office) & 2 bth, home is accessible w/ a convenient entry ramp. The open concept living/dining area is complemented by dble pane windows creating a bright & inviting atmosphere. Like to cook? Enjoy the custom expansive kitchen! Skylights illuminate the space beautifully!Recent upgrades: new roof 2022, earthquake kit install, new tile floors bdrms & bths & new plumbing 2020. New breaker box 2023. The home also features new insulation & a new hot water heater. Wall AC units & safe step tub! Wired 4 generator. Roof on m
1/36
$199,950
3 beds2 baths1,565 sq ft
1121 244th St SW #38, Bothell, WA 98021
Listing provided by NWMLS as Distributed by MLS Grid
THIS NEW beautiful Manufactured Home located within a very desirable 55+ Waterfront Community known as INGLEWOOD EAST SHORES MHP. This HOME is Brand NEW! A 2024 model, with everything upgraded: like Energy Star Package (upgraded insulation t/o: R-33 in the floor, R-21 in the walls, and R-40 in the ceiling--lower utilities), custom baseboard & engineered flooring, white shaker cabinets t/o, countertops--white stunning quartz t/o--including both bathrooms, and kitchen, coffered ceiling, craftsman doors, vinyl double paned windows, stainless steel appliances-oven & dishwasher, garbage disposal, glamour bath, tile surround large soaking tub and separate walk-in shower stall. Freshly
1/30
$244,950
3 beds2 baths1,605 sq ft
7301 NE 175th St #331, Kenmore, WA 98028
Listing provided by NWMLS as Distributed by MLS Grid
This property features a unit mix of three 2-bedroom, 1-bathroom units each 850 square feet, and one 620-square-foot 1-bedroom, 1-bathroom unit. With three units having recently undergone some updates and the fourth well-maintained by a long-term tenant, the property is in move-in ready condition. The current rents are approximately 15-25% below market rents, presenting an attractive value-add potential through operational improvements, including implementing a utility billback system. Property is apart of an HOA with the surrounding properties of similar size.
1/30
$1,225,000
7 beds4 baths3,170 sq ft9,600 sq ft (lot)
6103 -6107 NE 194th Pl, Kenmore, WA 98028
Listing provided by NWMLS as Distributed by MLS Grid
Welcome to 25 Degrees! The Clarkston floorplan brings you 2 bedrooms, 2 baths and an additional flex room. Come see what low maintenance modern living looks like! With beautiful quartz countertops throughout, all the cabinet space you could ever want, a large Owner's Suite and huge walk-in closet, this suite offers it all! Walk outside to the public park, restaurants, pubs, coffee shops, and more all at your convenience! Beautiful landscaping maintained without ever having to pick up a gardening tool! It can't get easier than this. Estimated completion date of Summer 2024. Buyers must register their broker by completing a Registration Card. Broker registration policy #4704.
1/13
$677,884
2 beds2 baths1,332 sq ft
18226 68th Ave NE #307, Kenmore, WA 98028
Listing provided by NWMLS as Distributed by MLS Grid
This is 25 Degrees!! Our Easton floorplan is a sight to see! Offering 2 bedrooms and 2 baths, sleek quartz countertops and vinyl plank throughout and your own private balcony. Come join the low maintenance lifestyle club, with secure garage parking, an elevator, and food, drinks and groceries all within walking distance! With a massive living + dining area, you can entertain comfortably all night long! Estimated delivery date of Summer 2024. Buyer must register their broker at first visit by completing a Guest Registration Card. Broker registration policy #4704.
1/2
$756,815
2 beds2 baths1,487 sq ft
18226 68th Ave NE #501, Kenmore, WA 98028
Listing provided by NWMLS as Distributed by MLS Grid
This Beautiful 2bdrm/2bath boasts of enormous amounts of Natural Light, a Chef's Dream Kitchen, 3 Parking Spots, SS Appliances, Custom Blinds, Central A/C & Heat, Full Size W/ D, a Hydrotherapy Soaking Tub, Wine Fridge, LVP Flooring throughout, a newly built Storage Shed as well as (16) Tuff Storage Bins on wheels for additional storage. This 55+ Community is situated on waterfront access to the Sammamish River Slough where Boating, Kayaking & Wildlife abounds. Cats & Dogs welcome. Current Rent $925 (Inc. W/ S) Also included is new Siding, Roof, Decks and Skirting.
1/34
$299,000
2 beds2 baths1,248 sq ft
7031 NE 175th St #19, Kenmore, WA 98028
Listing provided by NWMLS as Distributed by MLS Grid
This is 25 Degrees!! Our Easton floorplan is a sight to see! Offering 2 bedrooms and 2 baths, sleek quartz countertops and vinyl plank throughout and your own private balcony. Come join the low maintenance lifestyle club, with secure garage parking, an elevator, and food, drinks and groceries all within walking distance! With a massive living + dining area, you can entertain comfortably all night long! Estimated delivery date of Summer 2024. Buyer must register their broker at first visit by completing a Guest Registration Card. Broker registration policy #4704.
1/18
$746,719
2 beds2 baths1,487 sq ft
18226 68th Ave NE #401, Kenmore, WA 98028
Listing provided by NWMLS as Distributed by MLS Grid
Cozy 1 bedroom, 1 bath home in the desirable Inglewood East Shores 55+ Manufactured Home Park. Set along the beautiful Sammamish River, this Park offers home owners a private Community waterfront, dock, small boat launch, Clubhouse and picnic area. The well maintained home features an open floor plan, a spacious bath, and efficient kitchen. The range, refrigerator and washer/dryer will remain for the new owner. A large covered porch/deck provides space for morning coffee, entertaining or quiet reading. A storage unit in the private yard can remain or go, with yard space for gardening. Well located, this home is minutes to transit, shopping, Kenmore library, the Burke-Gilman trail, services
1/14
$50,000
1 bed1 bath625 sq ft
7301 NE 175th St #324, Kenmore, WA 98028
Listing provided by NWMLS as Distributed by MLS Grid
Welcome to 25 Degrees! The Clarkston floorplan brings you 2 bedrooms, 2 baths and an additional flex room. Come see what low maintenance modern living looks like! With beautiful quartz countertops throughout, all the cabinet space you could ever want, a large Owner's Suite and huge walk-in closet, this suite offers it all! Walk outside to the public park, restaurants, pubs, coffee shops, and more all at your convenience! Beautiful landscaping maintained without ever having to pick up a gardening tool! It can't get easier than this. Estimated completion date of Summer 2024. Buyers must register their broker by completing a Registration Card. Broker registration policy #4704.
1/14
$710,135
2 beds2 baths1,332 sq ft
18226 68th Ave NE #507, Kenmore, WA 98028
Listing provided by NWMLS as Distributed by MLS Grid
Motivated sellers! Charming 1 BR / 1 Bath unit at Johnson Court Condominium. Unit features new lvp flooring all throughout, new fridge, new dishwasher, range hood, new bathroom vanity & new blinds. This is a perfect start for a first-time homebuyer, or investment property, no rental cap. Assigned parking space #5 right out front. Located at the wonderful neighborhood amenities Kenmore has to offer, convenient access to I-5 & I-40, walking distance to Park and Ride, City Hall, Groceries & many others. Few miles to University of Washington- Bothell campus.
1/14
$281,450
1 bed1 bath603 sq ft
18200 73rd Ave NE Unit A113, Kenmore, WA 98028
Listing provided by NWMLS as Distributed by MLS Grid
Stunningly home in the unique 55+ Waterfront Community of Inglewood East Shores. This home has been totally rebuilt from the ground up; the space has been increased to 2 bedrooms, 2 new baths, and new everything. The kitchen gleams with grey cabinets that feature glass door fronts, quartz counters, top of the line stainless appliances including a wine cooler, microwave, and and a beautiful vent above the range. Enjoy a brunch bar that can seat friends. Floor plan can be changed to a one bedroom with a large great room adjacent to kitchen. The Park offers Sammamish River access for your water activity plus embraces the beauty of nature. It's just minutes to shopping, restaurants, services,
1/25
$225,000
2 beds2 baths1,100 sq ft
7301 NE 175th St #104, Kenmore, WA 98028
Listing provided by NWMLS as Distributed by MLS Grid
Ready to move on to easy living? 25 Degrees is here for you! Our Anacortes floorplan offers 1 bed, 1 bath and an additional flex room. With thick quartz countertops throughout, beautifully crafted cabinets with modern hardware, a private Owners Suite with a walk-in closet, and your own balcony, this is one you can't pass up! Beautiful landscaping, a public park and secure garage parking right at your doorstep. Perfectly located in Kenmore, offering restaurants, coffee shops, bars and more fun all nearby! Estimated delivery to be Summer 2024. Buyer must register their broker at first visit by completing a Guest Registration Card.
1/13
$563,872
1 bed1 bath955 sq ft
18226 68th Ave NE #310, Kenmore, WA 98028
Listing provided by NWMLS as Distributed by MLS Grid
Welcome to 25 Degrees! Our Fremont floorplan is one of a kind. .. literally! The ONLY plan in this entire community. This ADA accessible unit offers 1 bedroom and 1 bath with the additional flex room. With beautiful interior finishes, sleek quartz countertops, modern hardware and rays of natural light, and your own private balcony, this is one you don't want to miss out on. Get used to the low maintenance lifestyle, while enjoying many restaurants, supermarkets, coffee shops and more at a walking distance! Estimated completion date of Summer 2024. Buyer must register their broker on the first visit by completing a Guest Registration Card.
1/2
$567,615
1 bed1 bath979 sq ft
18226 68th Ave NE #103, Kenmore, WA 98028
Listing provided by NWMLS as Distributed by MLS Grid
Seller motivated! Well maintained, 1 bed 1 bath located in Inglewood East 55+ Mobile Home Park. The park offers a community waterfront on the Sammamish River, close to Burke-Gilman trail and shopping and medical centers. No car? No problem. This home is close to everything you need and is right by the bus route! New windows, bathroom tile, dishwasher and hood! The large storage shed is yours as well. Welcome home!
1/21
$49,000
1 bed1 bath576 sq ft610 sq ft (lot)
7301 NE 175th St #207, Kenmore, WA 98028
Listing provided by NWMLS as Distributed by MLS Grid
Based on information submitted to the MLS GRID as of Fri May 03 2024. All data is obtained from various sources and may not have been verified by broker or MLS GRID. Supplied Open House Information is subject to change without notice. All information should be independently reviewed and verified for accuracy. Properties may or may not be listed by the office/agent presenting the information. Some IDX listings have been excluded from this website.
School data is provided by GreatSchools, a nonprofit organization. Redfin recommends buyers and renters use GreatSchools information and ratings as a first step, and conduct their own investigation to determine their desired schools or school districts, including by contacting and visiting the schools themselves.Redfin does not endorse or guarantee this information. School service boundaries are intended to be used as a reference only; they may change and are not guaranteed to be accurate. To verify school enrollment eligibility, contact the school district directly.
Homes for sale in Kenmore have a median listing price of $948K. Some of these homes are Hot Homes, meaning they're likely to sell quickly.
What are some of the most popular neighborhoods in Kenmore?
Popular neighborhoods include Finn Hill, Inglewood, Central Kenmore, Horizon View, Arrowhead, Westhill, Moorlands, Sheridan Beach, Downtown, and Waynita-Simonds-Norway Hill.
Kenmore, Washington boasts a robust transportation system, with a variety of options for residents. The city is served by King County Metro Transit, providing public transportation to various destinations. Traffic levels for car travel can be high during peak hours, particularly on the main roads. For those who prefer driving, Kenmore is conveniently located near major highways such as I-405 and State Route 522. Learn more on our Kenmore city guide.
What types of properties are available in Kenmore?
Kenmore, Washington offers a variety of single-family home types, including ranch-style homes, split-level homes, and contemporary homes. These homes can be found throughout the city, with ranch-style homes typically built in the 1960s and 1970s, split-level homes built in the 1980s and 1990s, and contemporary homes built in the 2000s and beyond. To explore different property types for sale in Kenmore, Washington, use the 'Home type' filter located above the active listings. Customize your search by selecting options like single-family homes, condos, townhomes, and more.
What is life like in Kenmore?
Kenmore, Washington offers a serene and picturesque environment with its stunning natural landscape. The region boasts a variety of outdoor activities, including hiking trails, parks, and waterfront areas to explore. The weather in Kenmore is characterized by mild summers and cool winters, creating a pleasant climate throughout the year. The city provides a range of job opportunities across various industries, ensuring a diverse and thriving economy. Residents can engage in a multitude of recreational activities, such as boating, fishing, and enjoying local cuisine, making for a vibrant and engaging community.
What are the schools and amenities like in Kenmore?
Kenmore, Washington is a city rich in public amenities that cater to the diverse needs of its residents. Yes, there is a selection of restaurants offering a variety of cuisines to satisfy your culinary cravings. For those who enjoy the outdoors, there are numerous parks available for leisure and recreational activities. Grocery shopping is convenient with several grocery stores located within the city. Additionally, Kenmore provides other amenities such as schools, libraries, and sports facilities, enhancing the quality of life for its residents.
In the past month, 32 homes have been sold in Kenmore. In addition to houses in Kenmore, there were also 18 condos, 6 townhouses, and 2 multi-family units for sale in Kenmore last month. Kenmore is a minimally walkable city in King County with a Walk Score of 28. Kenmore is home to approximately 20,456 people and 2,770 jobs. Find your dream home in Kenmore using the tools above. Use filters to narrow your search by price, square feet, beds, and baths to find homes that fit your criteria. Our top-rated real estate agents in Kenmore are local experts and are ready to answer your questions about properties, neighborhoods, schools, and the newest listings for sale in Kenmore. Our Kenmore real estate stats and trends will give you more information about home buying and selling trends in Kenmore. If you're looking to sell your home in the Kenmore area, our listing agents can help you get the best price. Redfin is redefining real estate and the home buying process in Kenmore with industry-leading technology, full-service agents, and lower fees that provide a better value for Redfin buyers and sellers.


 REDFIN IS COMMITTED TO AND ABIDES BY THE FAIR HOUSING ACT AND EQUAL OPPORTUNITY ACT. READ REDFIN'S FAIR HOUSING POLICY AND THE NEW YORK STATE FAIR HOUSING NOTICE.
 United States
 Canada