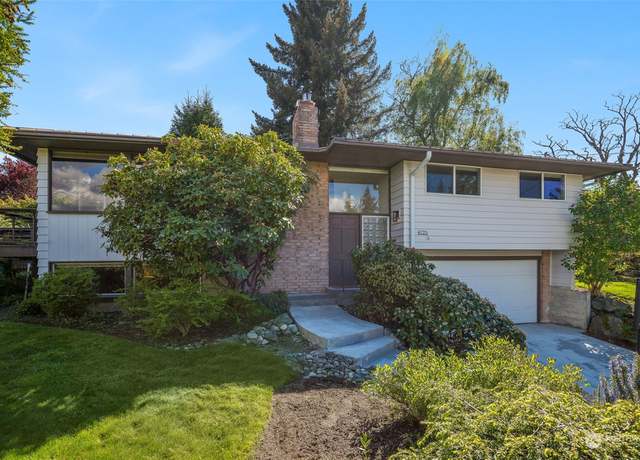
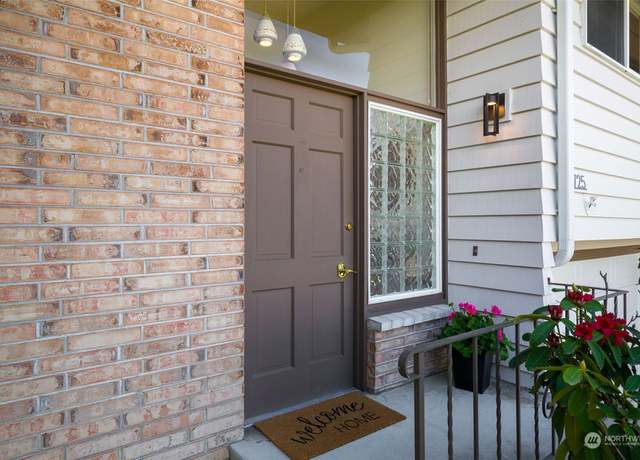
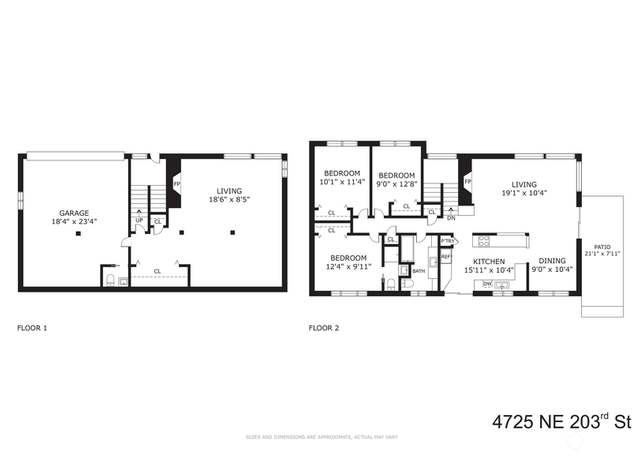
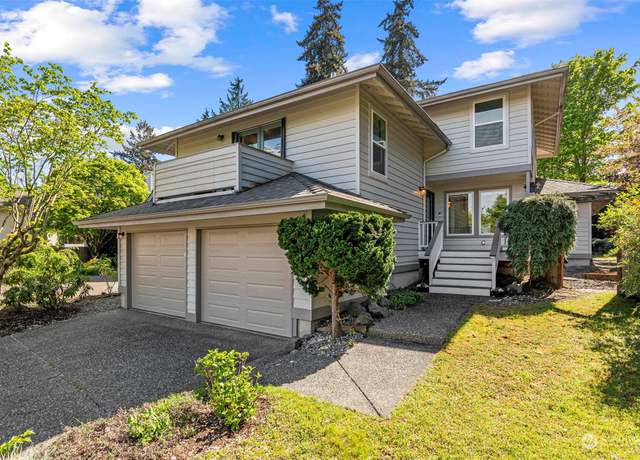
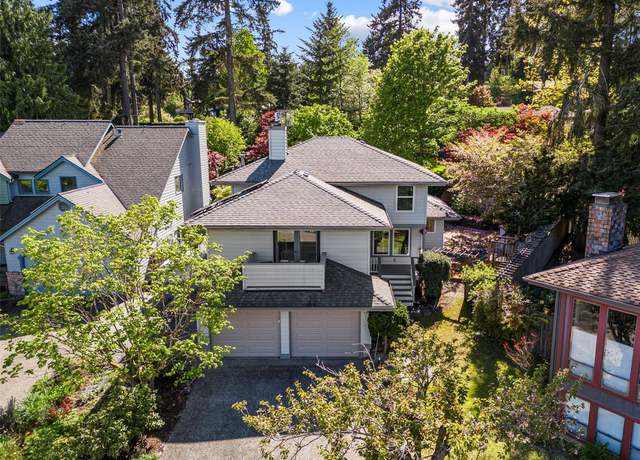
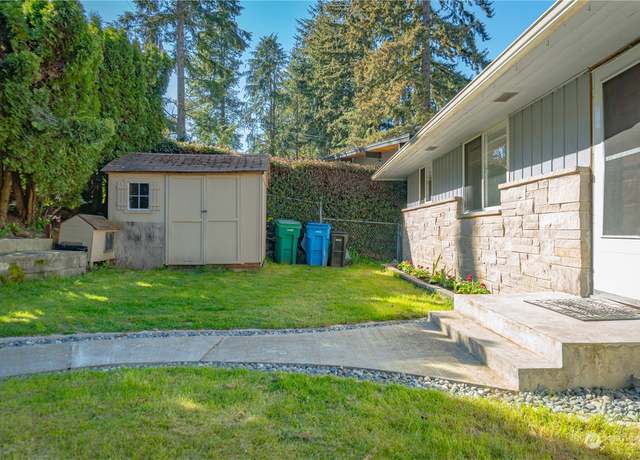
Welcome to your new home in the sought-after Horizon View neighborhood! This charming split-level 3-bed, 2.5-bath offers beautiful Cascade Mountain views on a private dead-end street. With spacious living, dining, open kitchen, and a large lower level rec room, it's perfect for both relaxation and productivity. Step outside to relax in the hot tub and soak in the views. Stay cool this summer with A/C. The 2-car garage with storage and a half bath, partially fenced yard with a covered patio, shed, metal roof, fresh paint, irrigation system, mixed edible landscaped yard make this home both stylish and functional. Quiet north end location, this is an opportunity not to be missed!
1/31
$990,000
3 beds2.5 baths1,910 sq ft9,639 sq ft (lot)
4725 NE 203rd St, Lake Forest Park, WA 98155
Listing provided by NWMLS as Distributed by MLS Grid
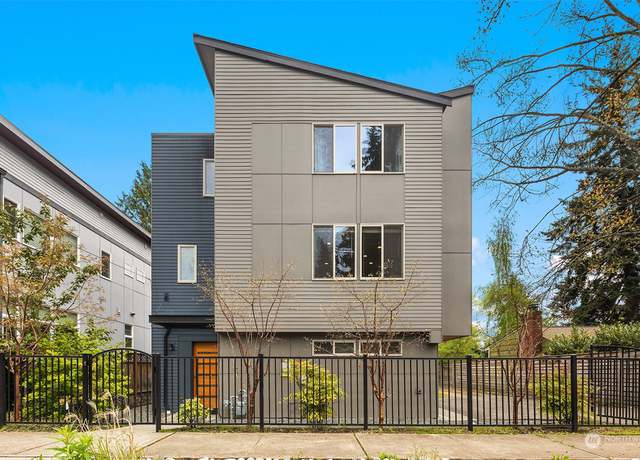
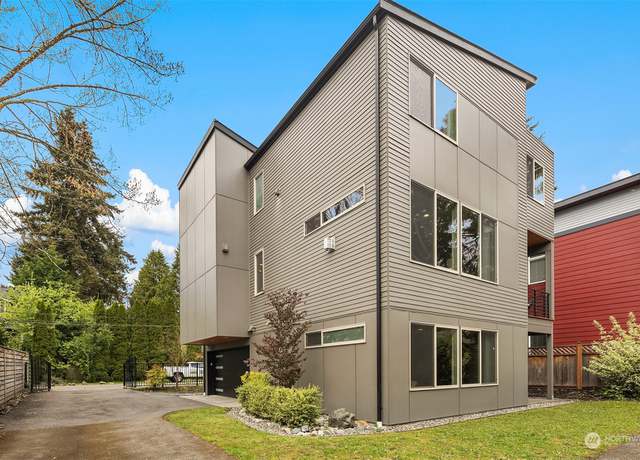
Stunning 4 bed 3.25 bath single family home located in the desirable Briarcrest neighborhood of Shoreline. Great location with easy access to 522, 523, I-5 & future light rail station. Quality built in 2018, featuring the desirable modern floor plan which makes entertaining easy. Gorgeous kitchen w/ the signature large island with waterfall edge, SS appliances, walk-in pantry & large dining space that opens to the balcony. Gas fireplace, under cabinet lighting and hardwood floors. Commercial grade TPO roof. Spacious master suite with free standing tub and large shower. Entry level bedroom + 3/4 bath, great for office/guests. Desirable Shoreline Schools. Location, Convenience, Li
1/29
$1,198,000
4 beds3.5 baths2,810 sq ft3,573 sq ft (lot)
14732 31st Ave NE, Shoreline, WA 98155
Listing provided by NWMLS as Distributed by MLS Grid
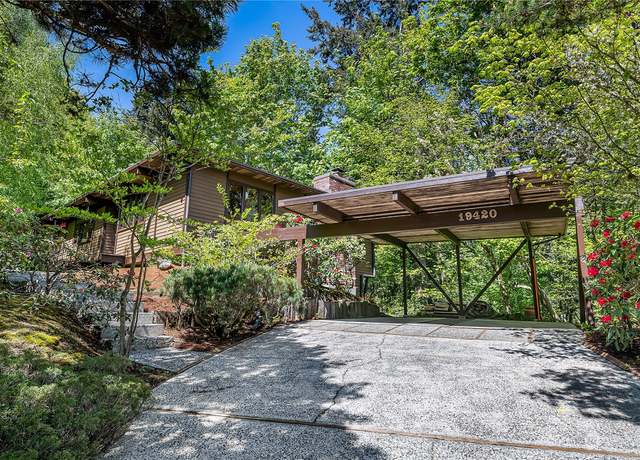
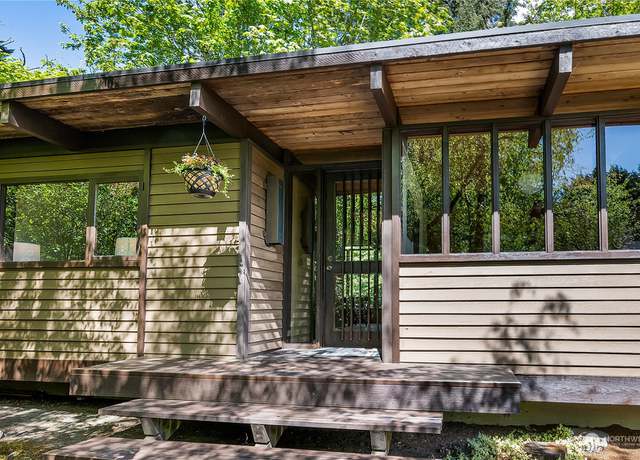
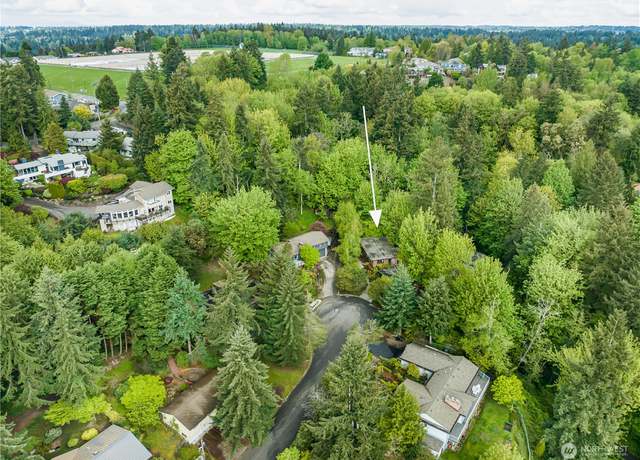
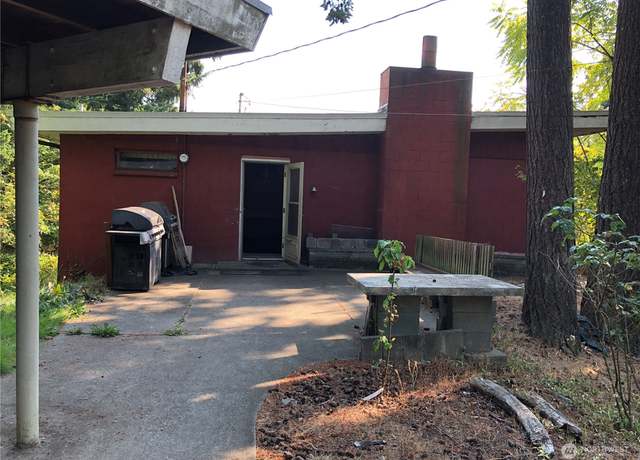
First-time on market: A timeless NW contemporary custom home by iconic builder John Burrows. Exposed beamed ceilings complement expansive walls of windows framing enchanting views of the lush wooded surroundings. Set at the end of a quiet cul-de-sac with the original timeless style and character preserved, this home delivers serene PNW living. A truly special opportunity!
1/26
$894,000
3 beds3 baths2,490 sq ft0.33 acre (lot)
19420 49th Pl NE, Lake Forest Park, WA 98155
Listing provided by NWMLS as Distributed by MLS Grid
Lovely Lake Forest Park NW Contemporary! Entry welcomes you to hardwood flrs, vaulted ceilings, picture windows, & skylights. Chef's kitch w/ quartz counters, SS appliances, open floor concept w/ great rm, eating nook, & half bth. Continue through slider to composite deck. Entertain, garden or romp in partially fenced yd. Privately situated, the primary bdrm, w/ ensuite & walk-in closet, offers seasonal peek-a-boo views of LK. WA from balcony. 3 bdrms, full bth, & laundry rm complete upstairs. Recent upgrades; A/C, 2021 furnace, earthquake retrofitting, EV Charger/solar panels. Attached 2-car garage. Great Location; near LFP Town Ctr, BG Trail, Farmer’s Mkt, shops
1/39
$1,050,000
4 beds2.5 baths2,580 sq ft7,117 sq ft (lot)
4205 NE 169th Ct, Lake Forest Park, WA 98155
Listing provided by NWMLS as Distributed by MLS Grid
* * ATTN: Investors * * Selling AS-IS existing AirBNB rooming house income property. 5.6 Cap Multi-Family zoned. Room to improve existing below market rents with renovation; always full last 2 years while self managing. (ALSO - near complete permits for builder friendly 8 unit TH development with views of Lake Washington, pending fees and performance bond due to city!) Hold / Build. Seller Financing and JV can be arranged with significant down-payment. All Arch, Engineering + reports available and existing Rental PNL.
1/10
$1,350,000
8 beds2 baths1,640 sq ft0.34 acre (lot)
3507 NE 153 St, Lake Forest Park, WA 98155
Listing provided by NWMLS as Distributed by MLS Grid
This charming one-story home is nestled on a sunny street near LFP Town Center. Many impressive updates - refinished hardwood floors, upgraded electrical panel, fresh exterior paint, with the showstopping custom kitchen of your dreams with high-end appliances. Detached 2 car garage is already plumbed and ready for your second story addition, plus large unfinished room ready to complete. Don't miss the RV hookup w separate side parking, brand new family room gas fireplace plus tankless water heater. Home comes with deeded access to the LFP Civic Club with gated entry, private beach and boat launch. With top Shoreline schools and an easy commute to the Eastside or Downtown Seattle, this home
1/25
$1,049,900
3 beds2 baths2,180 sq ft8,050 sq ft (lot)
18737 50th Ave NE, Lake Forest Park, WA 98155
Listing provided by NWMLS as Distributed by MLS Grid
Nestled overlooking Lake Washington, this stunning LFP condo offers everything you need for comfortable, modern living. From the moment you step inside, you'll feel the warmth and coziness of this inviting spaces. With 3 spacious bedrooms and 2 full baths, this condo offers ample space for you to spread out and relax. The primary bedroom, complete with a updated en-suite bath & convenient built-in closet organizer. The updated kitchen features stainless steel appliances, plenty of cabinet space, and room for dining! Flooded with natural light, the spacious living area boasts large picture windows that frame the stunning lake and territorial views. Enjoy your private deck or go up to t
1/30
$525,000
3 beds2 baths1,313 sq ft
3825 NE 155th Pl #102, Lake Forest Park, WA 98155
Listing provided by NWMLS as Distributed by MLS Grid
Embrace the ultimate waterfront lifestyle at coveted Sheridan Beach. Private dock w/ deep water moorage, covered boathouse, sailboat lift on 78 ft of Lk Washington shoreline. Wake up to shimmering waters, majestic Mount Rainier & unparalleled tranquility. Steeped in local history, the iconic rowing traditions of "The Boys in the Boat" were enjoyed here for over half a century. This custom-built, one-owner mid-century home offers vaulted ceilings, floor-to-ceiling windows and panoramic views that seamlessly blend indoor/outdoor living. Oversized garage/2 shops/ RV/boat storage welcome your hobbies. Wonderful privacy w/ direct access to Burke Gilman Trail & deeded member
1/40
$4,000,000
4 beds3 baths3,045 sq ft0.46 acre (lot)
16016 Beach Dr NE, Lake Forest Park, WA 98155
Listing provided by NWMLS as Distributed by MLS Grid
Rare find on the western shore of Lake Washington in Sheridan Beach! Just steps to the deeded Beach Club (with heated pool, pickleball, dock and beach) with a generous 90' of waterfront, a unique beach & expansive grassy fenced yard, this home has been renovated & updated since its original 1937 construction. Expansive kitchen, with adjoining family room & eating area; formal living room & dining room, with views down the Lake all the way to Mt. Rainier. Stamped concrete patio overlooking the lake w/ built in gas BBQ & heated entertaining areas. Spacious bedrooms, incl a luxurious primary suite with 3/4 bath & sweeping views. 2-car 630' garage, ample park
1/32
$4,500,000
5 beds3 baths3,640 sq ft0.38 acre (lot)
16270 Beach Dr NE, Lake Forest Park, WA 98155
Listing provided by NWMLS as Distributed by MLS Grid
Beautiful home in the heart of Lake Forest Park. This 5 bedroom, 4bath, 2800 square foot home has everything you need. Everything has been updated. Stainless appliances in the massive kitchen which flows nicely into the great room with wood fireplace and gorgeous light-filled windows. Heated floors throughout. Large eating area for dinners. 3 bedrooms up and 2 bedrooms down. Primary suite has built in organizers and bath with radiant heat. The shower can also be used as a steam shower. Huge downstairs with possible MIL or Airbnb. 2 other bedrooms as well as a workout room. Huge deck with outdoor kitchen and perfectly manicured yard, front and back. Tons of storage, close to all the main hig
1/38
$1,200,000
5 beds4 baths2,800 sq ft9,308 sq ft (lot)
18815 53rd Ave NE, Lake Forest Park, WA 98155
Listing provided by NWMLS as Distributed by MLS Grid
First time on market in 54 years! Location Location Location!!! Prime location which is close to light rail, I-5, Lake Washington. Although a 2 Bed 1 bath there is plenty of room to get creative and add additional rooms. Large lot has RV / Boat parking, RV Dump, nice grassy yard and room for a garden.
1/28
$825,000
2 beds1 bath1,740 sq ft8,160 sq ft (lot)
17835 24 Pl NE, Shoreline, WA 98155
Listing provided by NWMLS as Distributed by MLS Grid
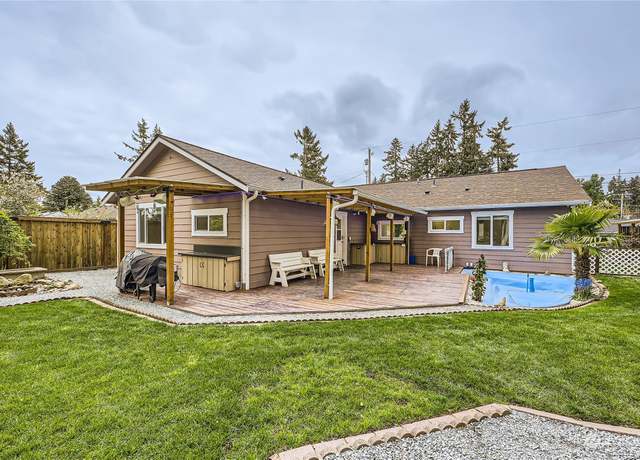
Incredible setting offering total privacy in sought-after Horizon View! This charming home exudes a mountain retreat vibe while conveniently close to amenities. Featuring a luminous open kitchen with skylight and a cozy gas fireplace, seamlessly flowing into a spacious great room. Enjoy a granite eating bar and expansive dining area. Basement boasts a sizable bonus room, convertible to a 4th bedroom. Primary bath adorned with granite, tile, and a beautifully crafted shower. Vaulted ceilings illuminate the space. Owner has plans and structural design completed for a large addition with plans available. Situated on a nearly 12000 sq ft lot with a low-maintenance yard to enjoy year round.
1/31
$900,000
4 beds2.5 baths2,110 sq ft0.26 acre (lot)
18808 47th Ave NE, Lake Forest Park, WA 98155
Listing provided by NWMLS as Distributed by MLS Grid
Live the Lake Forest Park dream! With wonderful lake and mountain views, you'll watch the seaplanes and eagles from your huge picture window. This unique 2-story home features a large refreshed kitchen, generous primary with ensuite and WIC, plus 2 other large bedrooms and main bath on the 2nd floor. Main floor offers a second kitchen, gas fireplace, bedroom or office, full bath and laundry. Perfect for multi-generational living! Two decks for outdoor entertaining, 2-car attached garage with workbench and room for storage. Lovely terraced backyard ready for your dream garden, and even a dog run! New roof, WH, furnace and much more in 2021, but ready for your own touches too. Close to B-G Tr
1/32
$1,145,000
4 beds3 baths2,340 sq ft0.28 acre (lot)
15032 37th Ave NE, Lake Forest Park, WA 98155
Listing provided by NWMLS as Distributed by MLS Grid
View, view, view! This corner unit on the top floor of Shannon Heights offers everything you’ve been looking for: a view of Lake Washington, low HODs, new paint and flooring, a secure entry shared with just 2 other homes on the floor, a full-size in-unit W/ D, designated covered parking with additional stalls available, designated storage, a bike room, and a rooftop deck – all within a refurbished complex (completed in 2008) that still looks new, with a well-managed HOA. With easy access to several transit routes, The Burke Gilman Trail, Sheridan Beach and Lake Forest Park Center – which includes Albertson’s, Starbucks, Ross, Third Place Books, MOD Pizza, MudBay, and
1/23
$349,000
1 bed1 bath732 sq ft
3820 NE 155th Pl #1002, Lake Forest Park, WA 98155
Listing provided by NWMLS as Distributed by MLS Grid
Welcome to this wonderful Lake Forest Park with so many possibilities. Live in the home and enjoy all the upgrades it has to offer or use it as a cash flow investment. Currently being run as a successful AIRBNB, this home features a spacious primary suite w/ two additional bedrooms on the main level & a separate living area in the lower level featuring kitchen, laundry room, bedroom & bathroom. Fully remodeled in 2018 from the studs out, this home has brand new everything featuring new roof, new on demand tankless water heater and appealing finishes throughout. Buyer may even join LFP Civic Club for Clubhouse/beach access. Desirable location, private large back deck and flexibil
1/30
$1,195,000
4 beds3 baths2,790 sq ft0.24 acre (lot)
17826 25th Ave NE, Lake Forest Park, WA 98155
Listing provided by NWMLS as Distributed by MLS Grid
VALUE IN LAND! Fantastic opportunity for BUILDERS, DEVELOPERS, & INVESTORS! The nearly 1/4-acre level lot is located in a quiet and peaceful Shoreline neighborhood. Convenient location only 15 minutes from Seattle and Edmonds waterfront. An excellent development opportunity; recent new construction sales in area at $1.1M and higher. The existing house is a teardown & re-build only - no interior access. Easy access to I-5 & SR-104 and the North Shoreline Light Rail Station opening in 2024.
1/18
$305,000
2 beds1 bath1,080 sq ft0.24 acre (lot)
19054 18th Ave NE, Shoreline, WA 98155
Listing provided by NWMLS as Distributed by MLS Grid
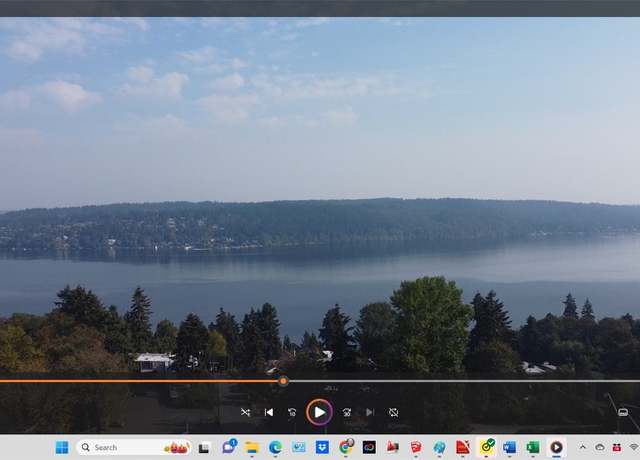
Exceptional one-of-a-kind opportunity to capture Lake Washington Views & create the home of your dreams from this 26,971 sqft lot. Driveway is in for building envelopes along with Topgraphic & Geotech work to help guide you through the process. Nestled in the Lake Forest Park Municipality and minutes to Restaurants, shopping as well as transportation benefit the new homeowners. Just across from the Lake Forest Community Waterfront Park will be added Lifestyle options for those waterfront enthusiasts. Bring your builder, dreams as one of the few that checkboxes at a compelling price! The boundary survey has been pinned and may need to be re-certified. Watch the drone footage as a
1/8
$275,000
— beds— baths0.62 acre (lot)
0 Bothell Way NE, Lake Forest Park, WA 98155
Listing provided by NWMLS as Distributed by MLS Grid
Convenient and cute Olympic Hills condo with private patio and dedicated parking spot! This move-in ready one-bedroom unit has a cozy wood-burning fireplace, hard surface floors throughout, and plenty of natural light. Kitchen with breakfast bar and updated bathroom with oversize shower. This home is in an amazing location near shopping, restaurants, parks and easy commuting options. Most utilities are included in the reasonable HOA dues + no rental cap! This is a wonderful opportunity for affordable living or investing in the city!
1/23
$255,000
1 bed1 bath609 sq ft
3024 NE 143rd St #103, Seattle, WA 98125
Listing provided by NWMLS as Distributed by MLS Grid
Nestled on a quiet cul-de-sac, in walking distance to vibrant shops & eateries, sits this 3 bed+ Den remodeled home! This turnkey charmer features a gorgeous kitchen with new cabinets, counters, & stainless steel appliances, a renovated full bathroom w/ beautiful tiling, permitted plans for an additional 3/4 bath, refinished hardwood floors, new luxury vinyl plank floors in family room, metal roof, & fresh paint inside & out! With an existing closet, & built-in drawers, add a door to the den to create a 4th bedroom or private office! The home sits on an expansive lot offering a huge, fully-fenced backyard, mature plantings, & a garden shed for storage. Great
1/23
$775,000
3 beds1 bath1,550 sq ft7,150 sq ft (lot)
17409 17th Pl NE, Shoreline, WA 98155
Listing provided by NWMLS as Distributed by MLS Grid
Next level SMART home built new in 2021 from the ground up! Pristine yard is the first thing you see. Close to Mountlake Terrace light rail set to open August 2024, Lake Ballinger, Nile Golf course, I-5. Make sure to ask about the attached document that lists everything this home has to offer. Full camera system from Lorex, Rachio sprinkler controller, Yale Smart Locks, Sonos system, Lutron lighting controller. WAY too much to list here, this is a must see home. Be sure to view the virtual walk through! ALL electronics convey with home purchase!
1/27
$824,000
3 beds2 baths1,297 sq ft7,405 sq ft (lot)
23803 54th Ave W, Mountlake Terrace, WA 98043
Listing provided by NWMLS as Distributed by MLS Grid
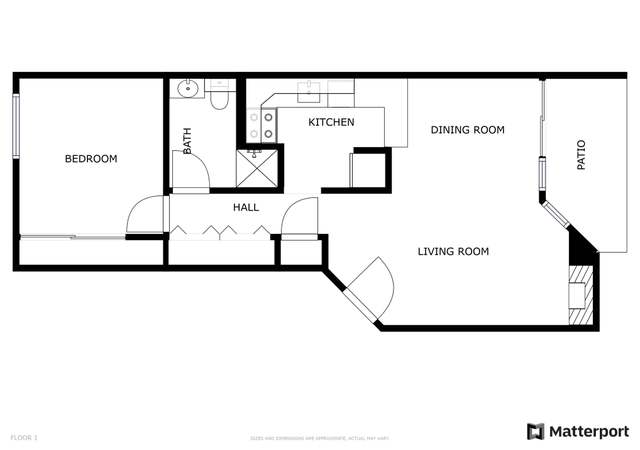
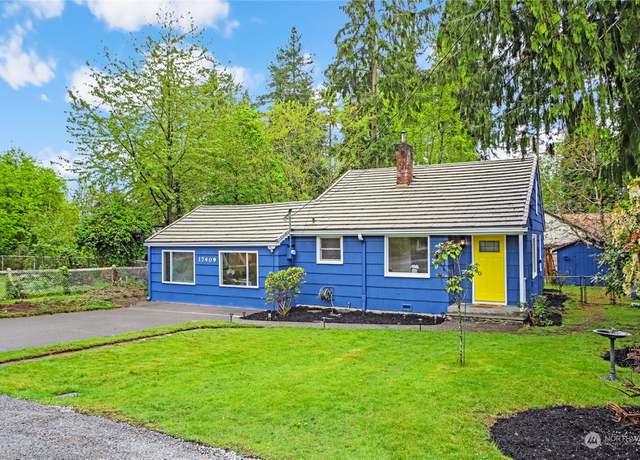
Step into your charming and cozy 3-bedroom, 2-bathroom home. It’s been fully renovated, featuring spacious living and dining areas, perfect for hosting guests. Plus, a brand new roof boasting a * * 30-year warranty * * and new fresh gutters. The kitchen is a highlight, showcasing new floating cabinets, quartz countertops, updated plumbing, lighting, and top-of-the-line appliances. Access the backyard easily through the dining area’s sliding door. Both bathrooms have received a complete update for a modern feel. Relax in comfort with new flooring and fresh paint throughout. The home’s appeal is further enhanced by new windows, doors, and trim. With ample storage outside
1/23
$890,000
3 beds2 baths1,650 sq ft7,300 sq ft (lot)
6114 NE 203rd St, Kenmore, WA 98028
Listing provided by NWMLS as Distributed by MLS Grid
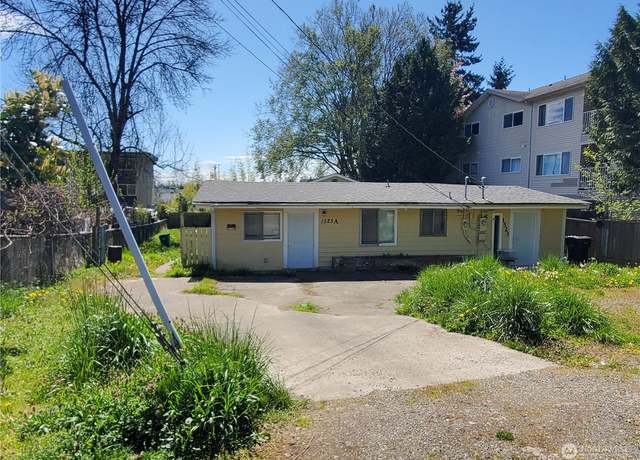
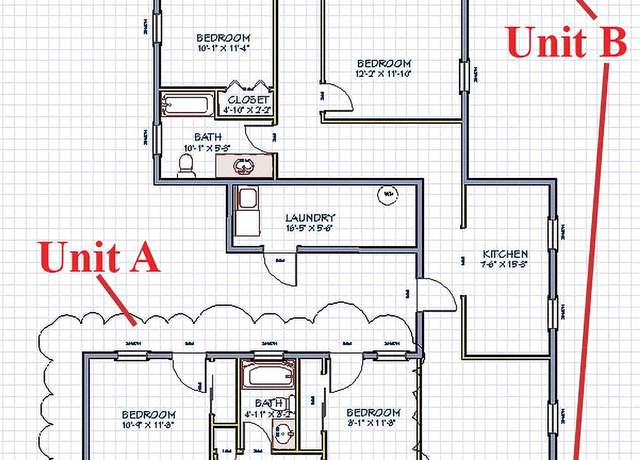
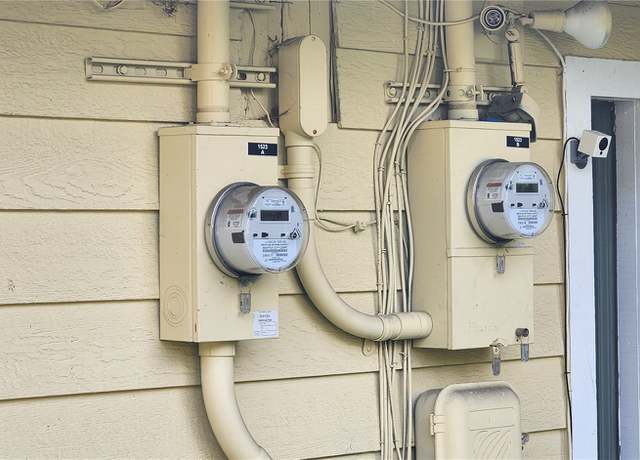
Exceptional Investment Opportunity Awaits! Discover the potential in this duplex, conveniently located minutes from the new light rail station and within walking distance to shopping and dining. Nestled in the award-winning Shoreline school district, this duplex sits on a spacious 8000+ sqft lot, zoned R24, offering immense possibilities for builders and investors alike. Imagine the prospect of boosting cash flow through cosmetic updates, aiming for a CAP RATE WELL ABOVE 5% in an area averaging 3-4%. Envision expanding with a DADU or redeveloping into FOUR 2000 SQFT modern homes. A rare chance to significantly elevate property value and accelerate wealth creation. Act Now to Transform Poten
1/11
$780,000
6 beds2 baths2,030 sq ft8,109 sq ft (lot)
1523 NE 147th St, Shoreline, WA 98155
Listing provided by NWMLS as Distributed by MLS Grid
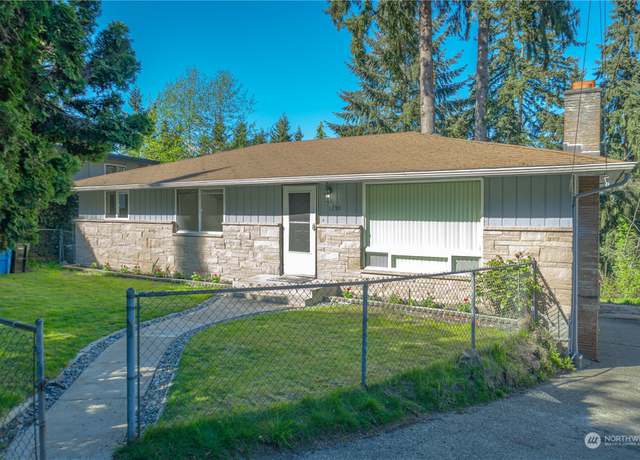
This Shoreline 2 level home is an amazing. You can live on the upper portion and rent the bottom area. It has a RENTAL INCOME POTENTIAL w/ 2 separate secured lower entry units with separate entrance. Complete with their own bathrooms, kitchenettes, fireplaces & laundry. The main floor has nice hardwood floors. Tons of storage throughout home including easy-access attic space. Front yard is fully fenced with additional storage shed. Driveway allows for ample tandem parking or use as extra large patio for outdoor lounging. Located in charming Shoreline neighborhood near schools/grocery/restaurants/shopping and light rail station. one unit rented month to month tenant willing to stay or
1/34
$847,777
5 beds3.5 baths2,580 sq ft5,850 sq ft (lot)
1230 NE 188th St, Shoreline, WA 98155
Listing provided by NWMLS as Distributed by MLS Grid
Value in land! Potential 7-unit development in highly desirable Shoreline. 17,039 sqft of land. (Zoned R18 x . 39 acres = 7units). Neighboring homes valued at $1.2+ mil. GREAT development potential near (0.9 miles east of) future N 145th StreetLight Rail Station. 4 bed, 2 bath house currently rents $2,750/mo. Keep home rented until development is started. Located by all major conveniences, freeway, light rail station, and award-winning Shoreline schools. Do NOT disturb tenants.
1/40
$1,200,000
4 beds2 baths1,920 sq ft0.39 acre (lot)
2342 NE 145th Street Pl, Shoreline, WA 98155
Listing provided by NWMLS as Distributed by MLS Grid
Welcome to the Tuscany community in Lake City. A secure gated building entry led to the custom designed lobby & elevator. Beautifully landscaped courtyard with fountains & outdoor furnishings. The open kitchen is designed w/ granite counters, appliances and dining that extends to the living area for great entertainment. In-unit washer and dryer. Dedicated one car garage can be used for securely park your vehicle. Extra dedicated storage space for offseason stuff. Easy bus access & great walkability convenient location to all amenities including shopping, restaurants, freeway access. No rental cap & pet friendly.
1/18
$278,000
1 bed1 bath589 sq ft
14300 32nd Ave NE #105, Seattle, WA 98125
Listing provided by NWMLS as Distributed by MLS Grid
Amazing investment! This fantastic quadruplex welcomes owner occupants & landlord-investors! Effectively built 1995 and thoroughly updated by the builder/owner. Easy Light Rail access, 15th Avenue commuting to UW, and North City restaurants and shopping. Units 1 & 2 currently combined as single office unit and have luxury appointments throughout. Also, a pellet stove, mini-split, in-floor heating, low voltage panel w/ rack system and lots of high-speed cabling. Space for a 2nd kitchen available in Unit 2. Two upper floor residential units (unit 3 updated), outbuilding storage with security, Nat Gas Generator, Tankless Hot Water Htr, decks, patio, bike rack, 12 tandem parking spa
1/34
$1,555,000
8 beds4 baths3,183 sq ft9,086 sq ft (lot)
1510 NE 170th St, Shoreline, WA 98155
Listing provided by NWMLS as Distributed by MLS Grid
Sale failed back on market. Corner lot home features 4 bedrooms, 2.5 baths, 1 car attached garage. Mature trees and fully fenced yard. Situated near schools, bus lines, and amenities. There are two fireplaces, a large main room and primary bedroom suite with clawfoot tub and separate shower on the second floor. Large deck for entertaining and gatherings. U[pgraded bathrooms and French doors to deck.
1/23
$889,920
4 beds2.5 baths2,160 sq ft6,996 sq ft (lot)
1504 NE 166th St, Shoreline, WA 98155
Listing provided by NWMLS as Distributed by MLS Grid
PRIC REDUCED- Back on Market-2 RENTAL HOMES on 2 adjoining R48 Development lots w/ INCOME & Great Tenants. * 16,877 sq ft Zoned R48 for 14+ Townhomes/19 flats Site * (w/ 50' height limit)"XLNT OPPTY for Future Builder Resale or DEVELOPE/ BUILD yourself" -Why not get appreciation on approx $11 million in retail sales rather than the just the current value? GREAT 1031 REPLACEMENT PROPERTY Near Light Rail. Lots 14514 & 14520 31st Ave NE) are being sold together for $2,300,000. Best comps MLS #1555771- small 6 unit site sold in 2020 for $1mil & our previous failed sale. Drive by ok, PLEASE DO NOT GET OUT OF CAR OR DISTURB TENANTS. MOTIVATED SELLER. Taxes and Lot sq
1/14
$2,250,000
2 beds1 bath720 sq ft0.39 acre (lot)
14520 31st Ave NE, Shoreline, WA 98155
Listing provided by NWMLS as Distributed by MLS Grid
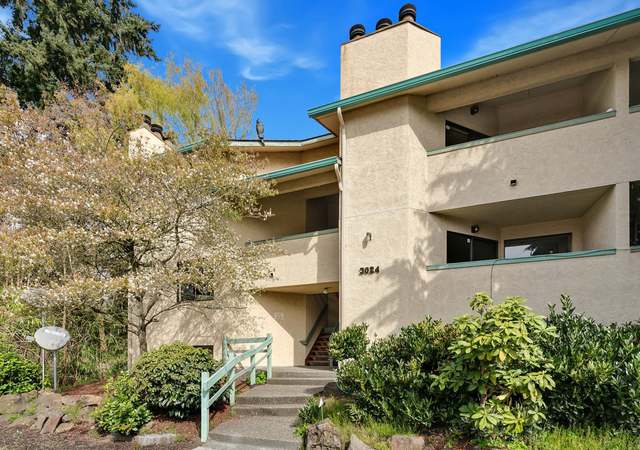
Spacious, light & bright 2 bedroom, 1.75 bath condo located in Greentree Village. Sitting at the top of the hill, the unit offers secluded privacy with mature trees all around. Living room boasts cozy wood burning fireplace & slider to covered back deck. Community has a clubhouse with a pool, hot tub, sauna, game room & kitchenette to host your larger get-togethers. Close to the Express bus to Seattle, as well as bus routes to UW, Northgate train station & less than a mile from the future light rail. Enjoy shopping, restaurants, trails & Lake Washington. Rental cap not met. 2 pets max per unit. New roof & cement planked siding in 2022. Welcome home!
1/33
$400,000
2 beds2 baths1,150 sq ft
13743 15th Ave NE Unit D9, Seattle, WA 98125
Listing provided by NWMLS as Distributed by MLS Grid
Welcome to this beautifully renovated 3-bed, 3-bath home nestled on a private lot with serene surroundings. Step inside to discover a complete transformation where every room has been thoughtfully updated & refreshed. Each bathroom boasts stylish new vanities & modern tile floors. The main living areas showcase new engineered hardwood floors that enhance the flow and aesthetics of the home. The kitchen is a chef's delight, boasting brand-new SS appliances, sleek countertops, and contemporary cabinetry. This property is more than just a home—it's a haven where modern comfort meets natural beauty. Enjoy the peaceful ambiance and convenience of this highly desirable location.
1/26
$1,025,000
3 beds2.5 baths1,558 sq ft0.29 acre (lot)
23821 29th Ave W, Brier, WA 98036
Listing provided by NWMLS as Distributed by MLS Grid
This 3-bedroom 2-bathroom home in Shoreline is a standout property, with remodeled exterior and interior features. A new metal roof, gutters, siding, windows, and doors. The kitchen features shaker cabinetry, quartz countertops, flooring, lighting, and appliances. The ample off-street parking can store a large RV, boat, or a few cars. This property has a large detached storage shed that can serve as an art studio, shop, office, playroom, or for future finished space or DADU potential. Exceptional schools are a stone's throw. The Briarcrest Park with a new water spraying playground for all to enjoy-coming soon. The seller has included a 1-yr EXTENDED HOME WARRANTY on structure, electrical, a
1/23
$779,777
3 beds2 baths1,260 sq ft8,150 sq ft (lot)
15529 26th Ave NE, Shoreline, WA 98155
Listing provided by NWMLS as Distributed by MLS Grid
Reimagined 1929 shingle clad cottage shores of Lake Washington, w/ reconstructed private dock, boat lift and 60' of waterfront. Thoughtfully renovated with expansive gourmet kitchen, open floorplan to the dining room and living room with fireplace, divided light windows and doors leading to the lakeside deck. Additionally on the main floor you'll enjoy the rec room/office, shop area and 3/4 bath. Upstairs an exquisite primary bedroom with full length deck, five piece bathroom, walk in closets, & attic storage plus two additional bedrooms. Private fenced yard & hot tub complete the picture. Recall the Boys in the Boat racing by as you enjoy views of the lake, the north Cascades, S
1/35
$2,599,900
3 beds3 baths1,986 sq ft5,953 sq ft (lot)
14060 Edgewater Ln NE, Seattle, WA 98125
Listing provided by NWMLS as Distributed by MLS Grid
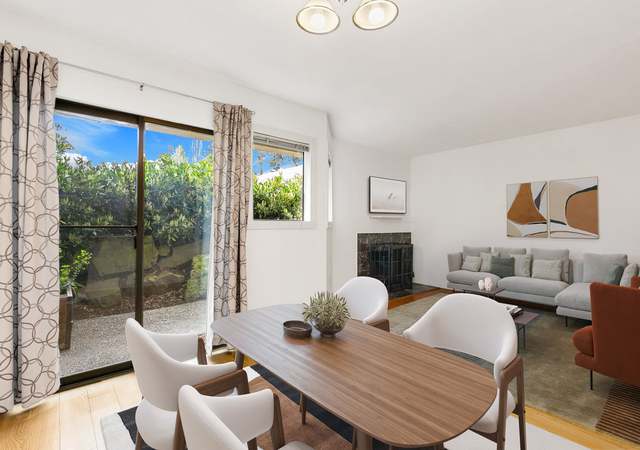
Welcome to Greentree Village. This first floor corner unit lives large at 1390sf. The home boasts 3 beds/2 full baths, primary bed w/ en-suite, walk in closets, open kitchen to dining room & living room, private laundry w/ pantry space, tons of storage & views of Jackson Park Public Golf Course. Designated carport parking & included additional uncovered space. Last building in complex, secluded privacy. Clubhouse offers game room, saunas, hot tub, pool & kitchenette. Conveniently located near future light rail on NE 145th St, express bus to Seattle on 15th Ave NE, buses to UW & Northgate train station, shopping, trails, Jackson Park Golf Course & Lake Was
1/20
$485,950
3 beds2 baths1,390 sq ft
13743 15th Ave NE Unit D-8, Seattle, WA 98125
Listing provided by NWMLS as Distributed by MLS Grid
Welcome to your tranquil oasis in the heart of North Seattle. This stunning 2-bedroom, 2-bathroom home is nestled amidst meticulously landscaped gardens, offering a serene retreat from the hustle and bustle of everyday life. Step into a world of comfort, where natural light floods through large windows, illuminating the spacious living areas. Both bedrooms provide a peaceful sanctuary, with ample space to unwind and recharge. Imagine waking up to the gentle rustle of leaves outside your window, or enjoying a morning coffee on your private balcony overlooking the lush greenery. With amenities such as a sparkling swimming pool, exercise room and clubhouse, every day feels like a vacation.
1/38
$585,000
2 beds2 baths1,568 sq ft
1606 NE 140th St Unit N4, Seattle, WA 98125
Listing provided by NWMLS as Distributed by MLS Grid
Corner lot/space in friendly 55+ Community, conveniently located off Ballinger Way near I-5, future light rail/transit, grocery, restaurants, bakery, Costco, Regal Cinebarre, Nile Golf Course and medical facilities. Spacious living area with tip-out. Electric forced air heat, furnace recently serviced. Double pane vinyl windows. Foundation piers recently leveled and new skirting. Brand new hot water tank. Tile floor and tile shower surround. Full size washer/dryer. Storage shed on covered front porch. New gutters and downspouts in 2021. Room for garden space. Very affordable space rent. Plenty of guest parking. Conventional financing available subject to qualifications.
1/35
$60,000
2 beds1 bath720 sq ft4.08 acres (lot)
24222 54th Ave W #6, Mountlake Terrace, WA 98043
Listing provided by NWMLS as Distributed by MLS Grid
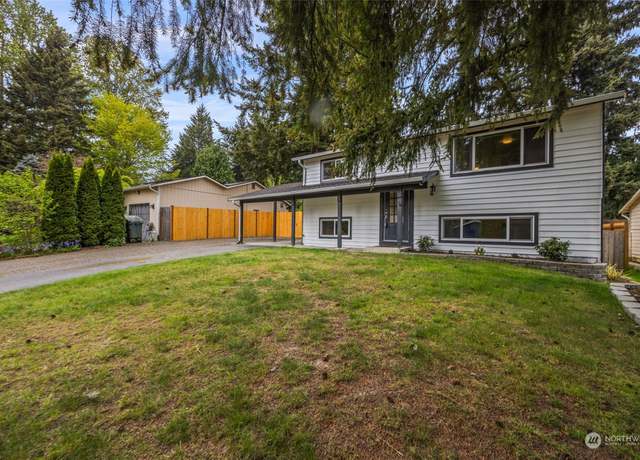
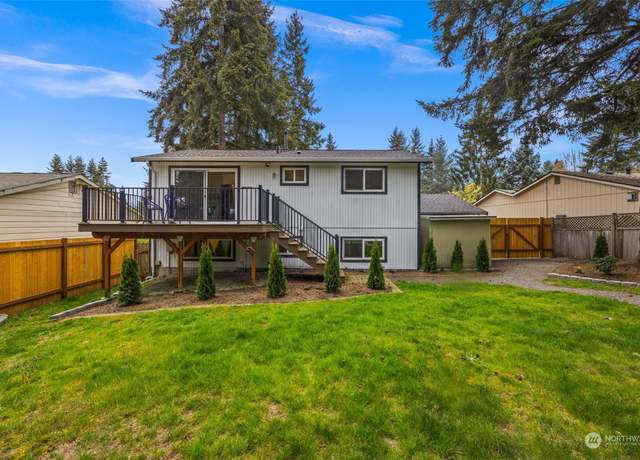
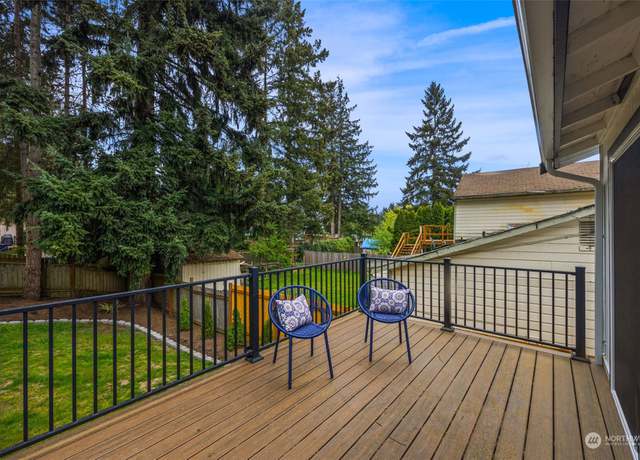
Welcome to this secluded home in Shoreline a hub of convenience to downtown Seattle with the link light rail. This gated sanctuary greets you at this unique home surrounded by nature, privacy and solitude yet minutes from everything and the upcoming light rail. Family room, laundry room, office (or bedroom. ) Freshly painted. Huge rec room is a blank slate for your vision with endless possibilities. The flag lot on the right is also being conveyed in the sale. Bring your vision and even look to expand on this already great property by adding bath/shower, completely enclosed 2 car garage and ADU. This move in ready home has lots of possibilities.
1/27
$725,000
4 beds1.5 baths1,920 sq ft0.31 acre (lot)
20043 12th Ave NE, Shoreline, WA 98155
Listing provided by NWMLS as Distributed by MLS Grid
This property features a unit mix of three 2-bedroom, 1-bathroom units each 850 square feet, and one 620-square-foot 1-bedroom, 1-bathroom unit. With three units having recently undergone some updates and the fourth well-maintained by a long-term tenant, the property is in move-in ready condition. The current rents are approximately 15-25% below market rents, presenting an attractive value-add potential through operational improvements, including implementing a utility billback system. Property is apart of an HOA with the surrounding properties of similar size.
1/30
$1,225,000
7 beds4 baths3,170 sq ft9,600 sq ft (lot)
6103 -6107 NE 194th Pl, Kenmore, WA 98028
Listing provided by NWMLS as Distributed by MLS Grid
Based on information submitted to the MLS GRID as of Thu May 02 2024. All data is obtained from various sources and may not have been verified by broker or MLS GRID. Supplied Open House Information is subject to change without notice. All information should be independently reviewed and verified for accuracy. Properties may or may not be listed by the office/agent presenting the information. Some IDX listings have been excluded from this website.
This area's enrollment policy is not based solely on geography. Please check the school district website for more information.
Elementary schools
Middle schools
High schools
GreatSchools Summary Rating
9/10
Aldercrest Annex Home Exchange
Public, K-8 • Choice school
8/10
Lake Forest Park Elementary School
Public, K-5
8/10
Briarcrest Elementary School
Public, K-5
7/10
Brookside Elementary School
Public, K-5
7/10
Cascade K-8 Community School
Public, K-8 • Choice school
Only showing 5 of
6 elementary schools.
School data is provided by GreatSchools, a nonprofit organization. Redfin recommends buyers and renters use GreatSchools information and ratings as a first step, and conduct their own investigation to determine their desired schools or school districts, including by contacting and visiting the schools themselves.Redfin does not endorse or guarantee this information. School service boundaries are intended to be used as a reference only; they may change and are not guaranteed to be accurate. To verify school enrollment eligibility, contact the school district directly.
Lake Forest Park, Washington offers a variety of transportation options to its residents. The city has access to public transportation, with several bus routes running through the area, providing convenient options for commuting or traveling within the region. As for driving, residents can expect moderate traffic levels, especially during peak hours. Additionally, the city is well-connected with nearby highways and freeways, making car travel to surrounding areas efficient and straightforward. Learn more on our Lake Forest Park city guide.
What types of properties are available in Lake Forest Park?
Lake Forest Park, Washington offers a variety of single-family home types, including ranch-style homes, split-level homes, and contemporary homes. These homes can be found throughout the city, with ranch-style homes typically built in the 1950s and 1960s, split-level homes built in the 1970s and 1980s, and contemporary homes built in recent years. To explore different property types for sale in Lake Forest Park, Washington, use the 'Home type' filter located above the active listings. Customize your search by selecting options like single-family homes, condos, townhomes, and more.
What is life like in Lake Forest Park?
Lake Forest Park, Washington offers a serene and picturesque environment with its lush greenery and abundant nature. The landscape is characterized by beautiful lakes, dense forests, and rolling hills, providing residents with a peaceful and tranquil setting. The weather in Lake Forest Park is mild, with cool and refreshing summers and mild winters. The area provides a range of job opportunities, with a diverse range of industries such as technology, healthcare, and education. Residents can enjoy a variety of recreational activities, including hiking, biking, and exploring the numerous parks and trails in the area.
What are the schools and amenities like in Lake Forest Park?
Lake Forest Park, Washington, offers a variety of public amenities to enhance the quality of life for residents. Dining options are available with a selection of restaurants to choose from. Outdoor enthusiasts will appreciate the presence of parks for leisure and recreation. For your daily needs, there are grocery stores within the city limits. Additionally, more amenities such as libraries and schools contribute to the city's vibrant community life.
In the past month, 12 homes have been sold in Lake Forest Park. In addition to houses in Lake Forest Park, there were also 4 condos, 1 townhouse, and 1 multi-family unit for sale in Lake Forest Park last month. Find your dream home in Lake Forest Park using the tools above. Use filters to narrow your search by price, square feet, beds, and baths to find homes that fit your criteria. Our top-rated real estate agents in Lake Forest Park are local experts and are ready to answer your questions about properties, neighborhoods, schools, and the newest listings for sale in Lake Forest Park. Our Lake Forest Park real estate stats and trends will give you more information about home buying and selling trends in Lake Forest Park. If you're looking to sell your home in the Lake Forest Park area, our listing agents can help you get the best price. Redfin is redefining real estate and the home buying process in Lake Forest Park with industry-leading technology, full-service agents, and lower fees that provide a better value for Redfin buyers and sellers.


 REDFIN IS COMMITTED TO AND ABIDES BY THE FAIR HOUSING ACT AND EQUAL OPPORTUNITY ACT. READ REDFIN'S FAIR HOUSING POLICY AND THE NEW YORK STATE FAIR HOUSING NOTICE.
 United States
 Canada