A fantastic opportunity! A 2-bedroom, 2.5-bathroom condominium with a 2-car attached garage in a gated community in Baldwin Park is certainly appealing. The proximity to shopping centers, restaurants, parks, schools, and public transportation makes it convenient for residents. Plus, being close to major freeways like the 605, 10, and 60 is a significant perk for commuting or exploring the surrounding areas. It seems like a great option for both first-time homebuyers and investors alike!
SWEET CONDO, SWEET LOVE. MOVE-IN READY! This condo has been fully renovated and complete with high-end kitchen appliances. The kitchen is equipped with upgrades in its entirety, from cabinets to marble countertops. Bedrooms and bathrooms have all been fully upgraded. In 2022, the owner replaced the entire air conditioning and heating system, as well as the water heater. Wood floor and plantation shutters throughout the house. Double entry doors to balcony from master bedroom. Fun outdoor space for BBQ and playground. The house is located in the heart of Baldwin Park, in a gated community, and is a desirable front unit. Complex conveniently near schools, restaurants, shopping areas, &
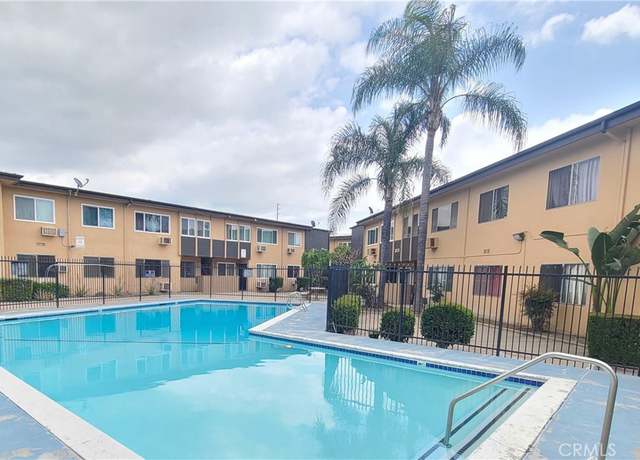
Welcome to a charming 2-bedroom, 1-bathroom residence nestled in the serene city of Baldwin Park. This tranquil abode is ideally situated close to major freeways including the 10 and 605, as well as schools, shopping centers, fitness gym and recreational facilities. Boasting a coveted ground-floor location, this property offers a picturesque view of the community pool. Residents will enjoy access to various amenities provided by the HOA, such as an communal laundry area, indoor washing machines, a sparkling swimming pool, BBQ facilities, dog park and an event room. Additionally, this property presents an enticing opportunity for investors. Don't let this chance pass – seize the opport
Beautiful townhouse In the heart of Baldwin Park. Gated community and desirable end unit. This 2-Story Unit with the following features: 2 Bedrooms & 2.5 Baths, living Room with Vaulted Ceiling and the a good size Kitchen and a dining area adjacent to Kitchen. Master Bedroom is Large & has a Walk in Closet. Master Bedroom has a large sliding door access to Balcony. The second bedroom has its own bathroom too. 1/2 Bathroom conveniently located on the first floor for the guests. Additional features includes Central Air & Heating, 2-Car Garage Attached with Direct Access to unit. There is a Green Common Area next to this unit for relaxation and enjoyment. Complex convenientl
This heavily renovated 3 level home is absolutely one of the best units in the Indigo Contemporary Gated Community in Baldwin Park. The modern, open floor plan bring awash natural light through generous windows and incorporated with the well-portioned, flow-through living-dining areas, and the private rooftop terrace with picture-perfect sunset views, this charming home becomes an entertainer’s dream. Each 1bd/1ba suite is on its own floor, perfect for ensuring privacy for each member of the household. Cooking and cleaning have never been easier thanks to this well-equipped kitchen that has been meticulously remodeled and is outfitted with upgraded appliances, quartz countertops, larg
This single-family style PUD, constructed in 2018, is situated in the serene and secure gated community of Indigo. The residence features a modern open floor plan on the ground level with 10-foot ceilings enhancing the space. The kitchen is equipped with white marble countertops, a newly installed center island, and a large pantry, seamlessly integrating into the living area for an open, connected feel. Floor-to-ceiling glass sliding doors offer a stylish transition to the backyard, which provides ample private space for various family activities. The expansive master suite includes a large walk-in closet, dual vanities, a soaking tub, and a separate shower. A loft space on the upper floor
MOVE IN READY:: Great opportunity. Beautiful Remodeled Detach Units. Ready to Move In. Total Living Square footage 2575. Big Lot 17635 Square footage. This Property also offers 2 car garage for each unit, and long driveway plenty room for 8 cars. The Front House features 3 bedrooms 2baths living area 1433. The back house feature 2 bedrooms 1 bathroom living area 952. Gas and Electricity are separated Meters. Must See! to appreciate the beauty of this great property.
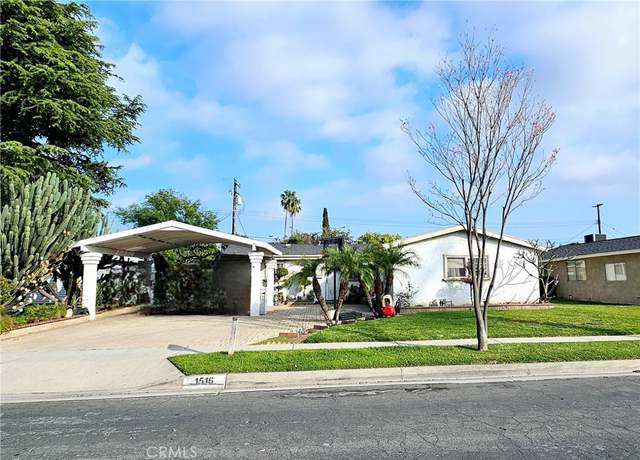
First time on market since 1979, this beautiful home has been loved by the same family for decades. Facing south, located in the north Baldwin Park neighborhood close to Arcadia, this home offers an open floor plan with 3 bedrooms, 2 bathrooms, formal dinning room plus a large bonus room which is currently used as the 4th bedroom and an office room. The detached garage with a separate entrance is an ideal ADU potential. Property is being sold in its current as is condition. Buyers check with the city for details. Large yard with storage sheds, fruit trees and many plants to show how the owner's loving and caring. Act quick before it is gone.
This offering consists of two units on a generous 12,443 square foot lot, with a total building area of 2,245 square feet. The FRONT UNIT, with a total of 1,408 square feet, boasts three bedrooms and two bathrooms, complemented by a living room, dining room, kitchen, and indoor laundry. Central air conditioning ensures a comfortable living environment. The BACK UNIT, spanning 873 square feet, features two bedrooms and one full bathroom, complemented by an attached two-car garage. The property includes front, middle, and backyard spaces, providing ample greenery. Additionally, there is plenty of parking space for added convenience.
Charming Home in a quiet Neighborhood. This well maintained 3 bed and 2 bath single family residence is located in a private easement. Laminated floor throughout, tile flooring in Dining and Kitchen Area, Double pane windows, upgraded kitchen with granite counter top. One car garage with ample parking spaces. Convenient location, closed to I-10 & 605, Metro Station, shopping center, grocery stores, and Elementary School nearby. Some fruit plants will be stayed, MUST SEE TO APPRECIATE.
Great property located in Baldwin Park. 3 bedrooms and 2 bathrooms with a LARGE LOT!. Plenty of space to add on. Needs some updating throughout but bring your buyer's ready to customize their new home or rental property. Large bonus room with kitchenette at the rear of the property that was completed within the last year.
Be the first to see it. Carpet and contents now removed A diamond in the rough for right investor. Cash only, serious buyers only. , highest and best after viewing interior Will NOT qualify for traditional financing. Beautiful layout with corner fireplace, and 2 patios make this a rare find. .Interior washer and dryer hookups Offered entirely “as-is” by Probate administrator, who has full authority, 3% earnest money minimum, proof of funds required on all offers, no exceptions. End unit, no one above you and a 1 car garage steps away One common wall. Please see additional information, death of natural causes <3 years. Court confirmation is not thought to be required at th
Discover the potential of 5023 Landis Ave nestled in northern Baldwin Park! This spacious 1,213 sq ft home with 2 bedrooms and 1 bath provides a functional layout. Step inside to experience the expansive family room, providing ample space for gathering, entertaining or optional living quarters. 2 car garage with large back yard alley access. Large back yard provides for extra parking as well as potential for home expansion or ADU. Property has established avocado, orange, grapefruit and lemon trees! This home offers easy access to shopping, transportation as well as the Santa Fe Dam Recreation area offering an abundance of outdoor amenities. Walking distance to Margaret Heath Elementary
This stunning 4-bedroom corner-end condo in Baldwin Park's Pacific Villas Community offers convenience near major freeways, parks, and shopping. With a detached layout and open floor plan, it provides privacy and luxury living. Features include a fenced yard, and fully paid-off solar panels, making it energy-efficient. Community amenities include gated entrance, playground, private dog park, and ample guest parking, all with a low HOA fee. Don't miss this turnkey home with no Mello-Roos, offering both comfort and financial benefits.
MOVE-IN READY! This stunning home is perfect for entertainment. The kitchen boasts built-in stainless-steel appliances, quartz countertops, and a full subway tile backsplash. The spacious open-concept kitchen includes a breakfast area and seamlessly flows into the living-dining room combo, complete with a tastefully remodeled fireplace. Enjoy the convenience of an updated living space, an oversized two-car garage, and a brand-new HVAC system. With newer windows and a roof, this home offers both style and peace of mind. The primary suite features an en-suite shower and a large wall-to-wall closet. The front and rear yard have been newly landscaped. The large patio provides the perfect backdr
Welcome to your new Home in the City of La Puente, located in a desirable neighborhood, this home offers proximity to schools, freeways, and shopping centers. 3 bedroom (4th room was opened to create the 3rd bedroom larger), 2 bath home ready for new owners. High ceiling in the Living Room and Newer tile flooring, painted throughout the inside of home, Kitchen and bathrooms were updated 2020. Kitchen has self closing drawers and cabinets. Master bedroom has a bonus room with closet and own entrance, Great for rental or extended family. Property has an enclosed patio and an extra open patio leading to the large back yard with fruit tress and storages. Fruit trees: 2 Avocados, peach &
Discover the perfect starting home in a gated community, offering both security and convenience. The upstairs unit boosts 2 bedroom 2 bath, comfortable and specious. 2 car garage below the unit and guest parking spaces throughout the community. While this home is in its original condition, it presents a fantastic opportunity for those with a vision. Bring your creativity and TLC to transform this space into your dream abode. Don't miss on the chance to make this your own.
Gate Community! Safe and quite area, and convenient to go anywhere. Both for self-resicence or investment. oppurtunities! The Bella Vita Townhouses. This unit offers 3 bedrooms and 3 and 1/2 baths. Granite countertops, tile flooring, central heating, central cooling, and 2 balconies. The first floor has the master bedroom, the second floor has the living room, dining area, and kitchen, the third floor is another master bedroom and a guest room. Each room has its bathroom. There are balconies off the master and the living room and a fireplace in the family room. There will be common areas with fountains, Barbeque pits, and tot playgrounds. This home rented out more than $3K before listing.
This stunning remodeled home in North Baldwin Park is a rare find! This beautiful 4-bedroom, 2-bathroom home boasts a spacious living room that is perfect for entertaining guests or relaxing with your family. The kitchen is well-appointed and modern, offering a great space for cooking and dining together. One of the highlights of this home is the huge patio, which is ideal for hosting family gatherings, barbecues, or simply enjoying the outdoors. The ample yard surrounding the house provides plenty of space for children to run around and play, as well as opportunities for gardening or outdoor activities. Overall, this home offers a perfect combination of comfort, functionality, and outdoor
We are pleased to present the Kimberly Manor Apartments, located at 14521 Clark St in Baldwin Park, CA 91706. This 26-unit property sits on an extra-large 36,139 square-foot lot, and consists of 12 one bed/one bath units & 14 two bed/one bath units. The Kimberly Manor Apartments have been meticulously maintained over the years and feature many desirable amenities such as a pool, patio area, onsite laundry and more. This is a true pride-of-ownership asset located in a highly sought after pocket of Baldwin Park. Within a 2 mile radius are grocery stores, city hall, restaurants, shopping centers, and the popular Santa Fe Dam Recreational Area. This property also allows a savvy investor t
Welcome to this cozy 4-bedroom, 2-bathroom home with 1,433 sqft of living space. The kitchen has been upgraded and includes a built-in stainless steel microwave, granite countertops, and tile floors throughout. New (A/C-aires mini split) ceiling fans have been installed in every room for your comfort. The house also features a spacious pantry for your storage needs and a wood chimney. This property is a great opportunity for first-time buyers. The community is conveniently located just minutes from the 10 & 60 freeways, providing easy access to transportation. In close proximity, you'll find shopping centers, restaurants, parks, Sunkist Elementary School, and Basset Senior High School
Discover the perfect blend of space and style in the heart of Baldwin Park. This expansive 3-bedroom, 3 bathroom home, built in 1971 and spanning 1843sq. ft. , and a charming basement for a unique guest area with separate entrance for endless opportunities for income or multigenerational space. IN ADDITION , a welcoming junior ADU incorporated seamlessly on the property with 2 bedrooms and 1 bathroom 825 sq. ft. and a semi-private patio area at their private entrance providing for more streaming income $$$$. Step inside to the main house and find a harmonious mix of granite and Corian countertops, elegant wood flooring, and ceiling fans throughout. Fully renovated home, complete with high-e
Motivated seller!!!! Located in a quiet gated and safe community with swimming pool, basket courts, BBQ areas, convenient to access to I-10,I-605 and parks, schools, shopping centers. This PUD house has a good size of living room and family room and dining area. All 3 bedrooms upstairs, including the master bedroom with master bath room with bath tub. Another full bath upstairs. There is a small back yard for private use such as farming or family entertainments. All bedrooms and living room, family room are equipped with laminated floors. Stove and refrigerator in the kitchen will be included; newer washer and dryer to stay in the house. Direct access 2 car garage. Residents may pay $100 an
Huge land in the city of Baldwin Park. This property features 2 bedroom and one bath in the city of Baldwin Park. Close to shopping and school, easy access to freeway. It can sell with the big lot next to it (Its APN is 8552022062). Multiple Units can be added and please verify with city.
Big lot! This property features 2 bedroom and one bath in the city of Baldwin Park. Close to shopping and school, easy access to freeway. It can sell with the big lot next to it (Its APN is 8552022061). Multiple Units can be added and please verify with city.
Welcome to your new home in the charming neighborhood of Baldwin Park! This delightful 3-bedroom, 1.5-bath residence is now available for sale. Nestled on a peaceful cul-de-sac street, this property boasts a cozy and inviting atmosphere. As you enter, you'll be greeted by a spacious living area filled with natural light, perfect for family gatherings or relaxing evenings. The well-appointed kitchen features stone counter space and plenty of cabinet space. The three bedrooms offer plenty of space for your family or guests and additional bonus bedroom. Outside, you'll find a generous backyard with covered patio and the potential for creating your own oasis – perfect for gardening, play,
Attention! Buyers & Investors! Newly built 2022 – 3 Residential units on a huge lot. Front House is 1,350 sqft including 3 bedrooms, 2 full Bathrooms, Living Room, Dining area, Laundry Room and Kitchen. It also has a connecting hallway to a 2 car garage. The original front house was remodeled in 2020 (Master bedroom/bath newly built). Attached to the front house is a newly built 500 sqft Jr. ADU with 1 Bedroom, 1 Bath, Laundry closet, Kitchenette and Living Room area. This unit has it’s own private entry and porch. Newly built Back House is 1,130 sqft including 3 bedrooms, 2 full bathrooms, Full Kitchen, Dining area and Living Room & Solar Panels. This house has 2 pa
Attention Developer! Per the City of Baldwin Park, up to 18 affordable units can be built. The City of Baldwin Park welcomes developers to submit drawings for review. Please verify with the City for its incentive, the 'Density Bonus' state program, to maximize the full potential of this project. The purchase must include two parcels. This property is zoned MU2 (Mixed Use-Commercial/Residential), offering an opportunity to combine two parcels (APN # 8415011002 & 8415011028) with a total lot size of 20,295 sqft. There is a structure on one of the parcels. The lots are centrally located near Downtown Baldwin Park on a corner lot in a densely populated retail and residential area, situate
This property is two separate houses on one very large lot. The lot is over 23,500 sq ft all flat ground and has potential for commercial development. One of the houses is estimated to be built before 1910. It has three bedrooms, large kitchen with dining area a detached garage that potentially could hold two cars. It also offers a large front yard area and a private backyard area with a brick BBQ. At present some work is being done on this house. The other house estimated to be built in 1951 has two bedrooms one bath. There is a two-car detached garage, a fenced in back area for pets or family gatherings. There is plenty of parking on the cement driveway. Behind both houses there is a lar
Commercial land value. Retail Freestanding building located in the heart of Baldwin Park. Street frontage of 264 SF on Los Angeles Street. Convenient ingress/egress to the property with amble parking spaces. Building has 8190 SF with larger lot size of 31535 SF which combined in total of 4 APNs: 8544001004, 8544001003, 8544001002 & 8544001001. Current tenant is Super Market. Long term lease with extremely below market rent has expired. currently on month to month lease. Property is good for owner use or future development / investment.
C-1 Zone, lot size 45x145=6,565 sq ft. This vacant land is next to the address 4806 Maine Ave. , Baldwin Park, CA 1706. Seller said 1,200 sq ft one story commercial building been permitted with the city. Please check with the City of Baldwin Park.
Excellent opportunity for development of a 3 level mix use building, 1st floor Commercial/ retail use and 2nd and 3rd floor with 12 units of residential apartments on . 52 acre footprint (-/+ 22,734 SQ. FT. ) Grading costs will be minimal on these flat parcels with extensive frontage (-/+ 199 FT. ) along Ramona Blvd. Zoned C-2. Buyer to verify size, boundaries, zoning, and other details about these parcels. City will allow mixed use development such as commercial units on lower level and residential units on upper levels. Alley assess on these desirable lots. Buyer to verify all information to satisfy themselves.
This area's enrollment policy is not based solely on geography. Please check the school district website for more information.
Elementary schools
Middle schools
High schools
GreatSchools Summary Rating
8/10
Santa Fe Elementary School
Public, 3-8
7/10
Edgewood Academy
Public, K-8
7/10
Walnut Elementary School
Public, K-5
7/10
Durfee Elementary School
Public, K-8
6/10
Margaret Heath Elementary School
Public, K-6
Only showing 5 of
21 elementary schools.
School data is provided by GreatSchools, a nonprofit organization. Redfin recommends buyers and renters use GreatSchools information and ratings as a first step, and conduct their own investigation to determine their desired schools or school districts, including by contacting and visiting the schools themselves.Redfin does not endorse or guarantee this information. School service boundaries are intended to be used as a reference only; they may change and are not guaranteed to be accurate. To verify school enrollment eligibility, contact the school district directly.
Baldwin Park, California boasts a well-connected transportation network, making commuting in and around the city a breeze. The city experiences moderate traffic levels, especially during peak hours, so driving by car might require some extra time. Public transportation is readily available in Baldwin Park, with the Metrolink train service providing convenient connections to nearby areas. Additionally, the city's strategic location near the I-10 and I-605 freeways ensures easy access to other parts of California. Learn more on our Baldwin Park city guide.
What types of properties are available in Baldwin Park?
Baldwin Park, California offers a variety of single-family home types, including ranch-style homes, contemporary homes, and modern homes, among others. These homes can be found throughout the city, with many located in established neighborhoods and newer developments. Most properties feature 3 to 4 bedrooms and were built within the past 20 years. To explore different property types for sale in Baldwin Park, California, use the 'Home type' filter located above the active listings. Customize your search by selecting options like single-family homes, condos, townhomes, and more.
What is life like in Baldwin Park?
Baldwin Park, California offers a vibrant living experience with its picturesque surroundings. The landscape showcases a mix of urban and suburban elements, providing residents with a diverse environment. The weather in Baldwin Park is pleasant, with mild winters and warm summers, making it enjoyable to explore the outdoors. The region presents a range of job opportunities across various industries, contributing to a dynamic local economy. Residents have access to a wide array of activities and events, ensuring there is always something exciting to do in Baldwin Park.
What are the schools and amenities like in Baldwin Park?
Baldwin Park, California provides a variety of public amenities for all residents to enjoy. The city boasts a number of restaurants offering a wide range of cuisines to satisfy diverse culinary tastes. For outdoor enthusiasts, there are several parks within the city limits that offer green spaces for relaxation and recreation. Grocery stores are conveniently located throughout Baldwin Park, ensuring that residents have easy access to daily necessities. Additionally, the city offers other amenities such as fitness centers, libraries, and community centers to cater to a variety of interests and needs.
In the past month, 19 homes have been sold in Baldwin Park. In addition to houses in Baldwin Park, there were also 12 condos, 1 townhouse, and 4 multi-family units for sale in Baldwin Park last month. Baldwin Park is a moderately walkable city in Los Angeles County with a Walk Score of 55. Baldwin Park is home to approximately 74,421 people and 19,115 jobs. Find your dream home in Baldwin Park using the tools above. Use filters to narrow your search by price, square feet, beds, and baths to find homes that fit your criteria. Our top-rated real estate agents in Baldwin Park are local experts and are ready to answer your questions about properties, neighborhoods, schools, and the newest listings for sale in Baldwin Park. Our Baldwin Park real estate stats and trends will give you more information about home buying and selling trends in Baldwin Park. If you're looking to sell your home in the Baldwin Park area, our listing agents can help you get the best price. Redfin is redefining real estate and the home buying process in Baldwin Park with industry-leading technology, full-service agents, and lower fees that provide a better value for Redfin buyers and sellers.


 REDFIN IS COMMITTED TO AND ABIDES BY THE FAIR HOUSING ACT AND EQUAL OPPORTUNITY ACT. READ REDFIN'S FAIR HOUSING POLICY AND THE NEW YORK STATE FAIR HOUSING NOTICE.
 United States
 Canada