
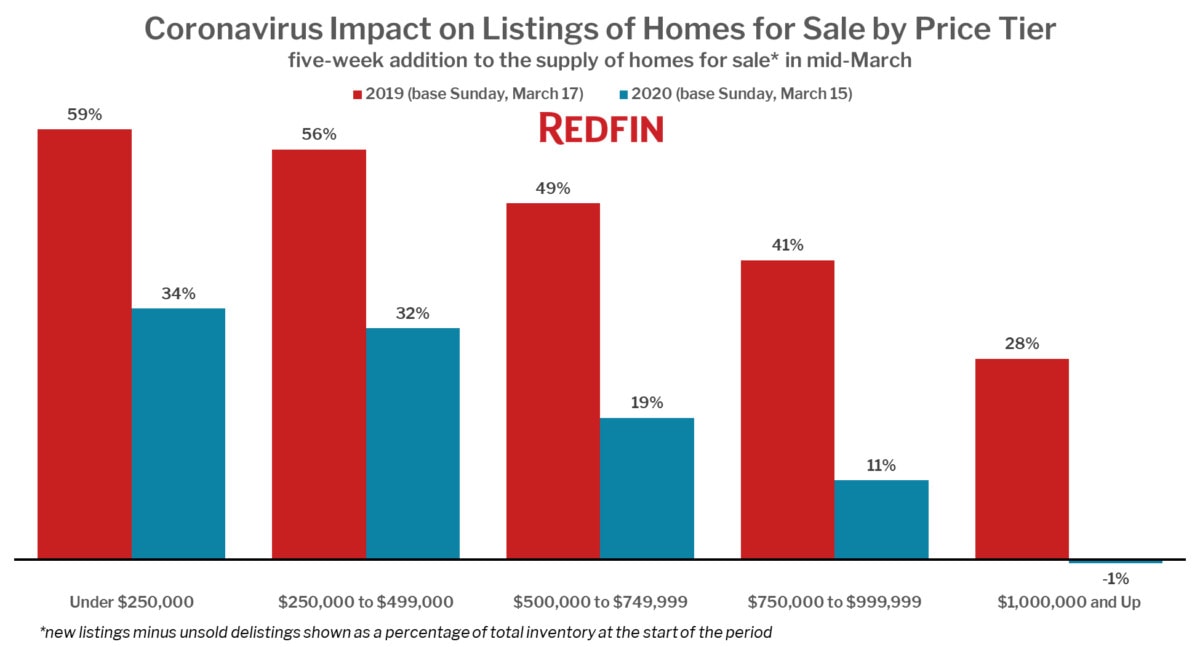
The coronavirus has driven listings down across the board, but even at its lowest impact point—in the affordable market—there is still not enough supply of homes for sale to meet demand
Between mid-March and mid-April, the new supply of homes for sale over $1 million fell 29 points from the year prior, according to a new Redfin analysis of listing activity.
As of March 15, there were 66,528 homes for sale priced at or above $1 million across the 50 largest U.S. metro areas. Between March 15 and April 20, 10,338 more were listed for sale, but 10,708 were taken off the market unsold, for a total decrease in supply of 1%. During the same period a year earlier supply increased 28%.
In contrast, homes priced under $250,000 saw a 34% increase in supply between March 15 and April 20 of this year. Still, that’s down from a 59% increase during the same time in 2019. While there may be more supply here than in the high-end market, it by no means solves an ongoing affordability crisis in the U.S.
“There has been a drastic shortage of affordable starter homes for the past several years,” said Redfin lead economist Taylor Marr. “Homeowners selling in an affordable price range are still experiencing plenty of demand from buyers right now, even in the midst of the coronavirus pandemic. Owners of much more expensive homes, however, are seeing a slack in demand, likely because buyers of higher end homes have been influenced by tight credit for jumbo loans and volatile economic and financial market conditions. Luckily, many of these homeowners have the luxury of waiting until the time is right to list their homes for sale.”
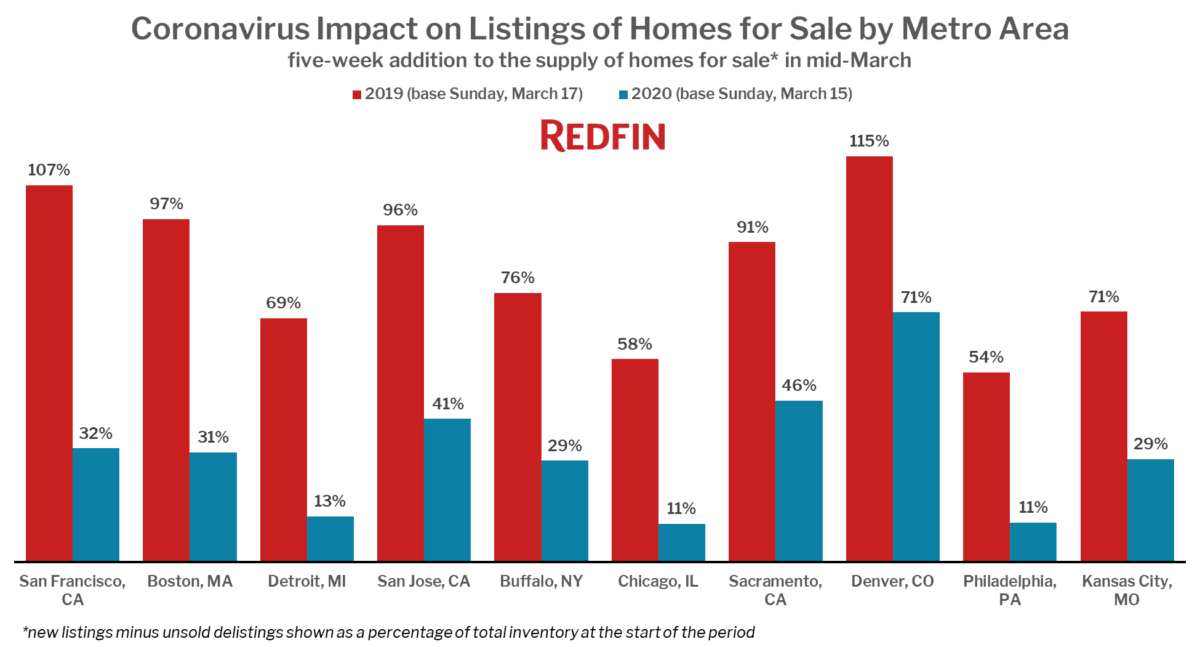
The coronavirus has driven down listings across the board, but high-end listings have almost completely dried up
As a result of this dramatic slowdown at the high end of the market, some of the most expensive cities around the country are seeing the biggest slowdown in the rate at which homes for sale are being added to the market. San Francisco had the largest decline from a year ago, down 75 percentage points to just a 32% increase in supply in 2020 compared to a 107% increase a year earlier. Boston (-66 points to 31%) and San Jose (-56 points to 41%) were also among the hardest-hit. However, some less expensive markets also saw big drops, including Detroit (-56 points to 13%) and Buffalo (-47 points to 29%).
Top 10 metro areas where the coronavirus has had the largest impact on listings of homes for sale
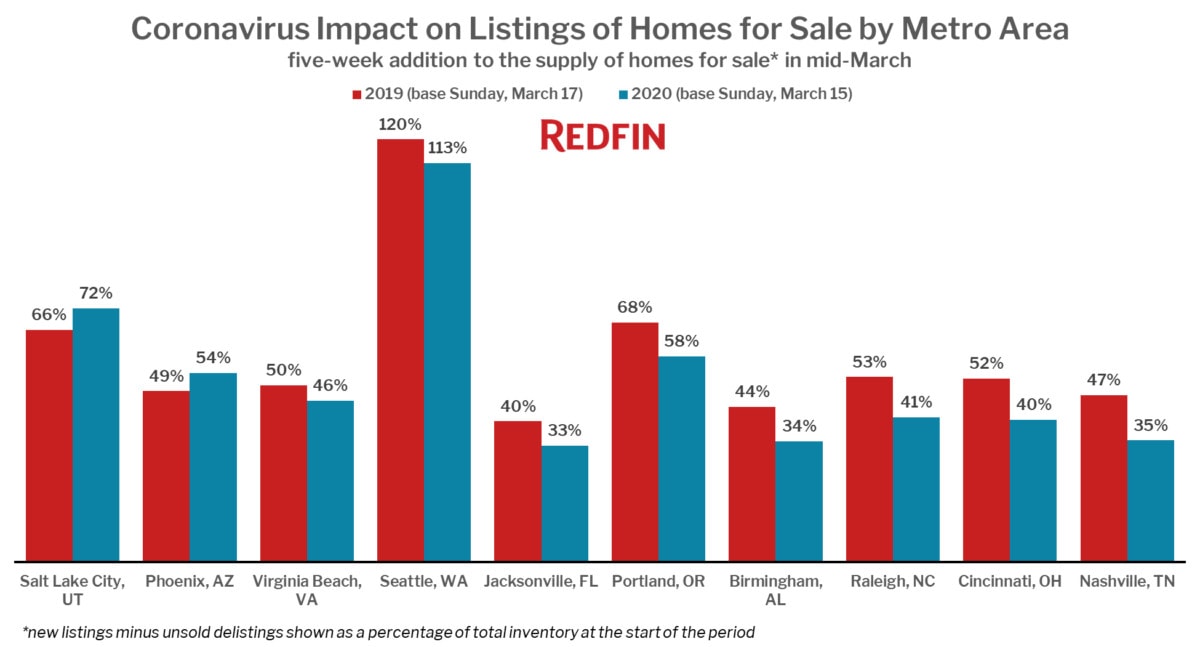
Just two of the 50 largest metro areas in the U.S. saw more supply added to the market than last year: Salt Lake City, where the addition of homes for sale was up 6 points to 72% from 66% a year earlier, and Phoenix, up 5 points to 54%. Even in those two metro areas, expensive listings are seeing the largest shortfall and increases in supply are only at the lower end of the market.
Top 10 metro areas where the coronavirus has had the smallest impact on listings of homes for sale
Full metro breakdown: Change in new supply during 2020 coronavirus crisis vs. same period in 2019
| Metro Area | 2019 Inventory as of March 17 | 2019 New Listings | 2019 Delistings | 2019 Net New Supply | 2019 Change in Supply | 2020 Inventory as of March 15 | 2020 New Listings | 2020 Delistings | 2020 Net New Supply | 2020 Change in Supply | Difference 2020 vs 2019 |
|---|---|---|---|---|---|---|---|---|---|---|---|
| San Francisco, CA | 5,088 | 5,978 | 535 | 5,443 | 107% | 4,256 | 2,512 | 1,139 | 1,373 | 32% | -75% |
| Boston, MA | 8,541 | 9,051 | 729 | 8,322 | 97% | 8,505 | 4,315 | 1,663 | 2,652 | 31% | -66% |
| Detroit, MI | 11,540 | 9,302 | 1,309 | 7,993 | 69% | 11,295 | 3,326 | 1,863 | 1,463 | 13% | -56% |
| San Jose, CA | 2,113 | 2,231 | 210 | 2,021 | 96% | 1,588 | 988 | 342 | 646 | 41% | -55% |
| Buffalo, NY | 1,673 | 1,416 | 138 | 1,278 | 76% | 1,269 | 563 | 198 | 365 | 29% | -48% |
| Chicago, IL | 33,443 | 22,055 | 2,786 | 19,269 | 58% | 30,476 | 10,393 | 7,088 | 3,305 | 11% | -47% |
| Sacramento, CA | 4,508 | 4,549 | 454 | 4,095 | 91% | 4,054 | 2,864 | 1,008 | 1,856 | 46% | -45% |
| Denver, CO | 6,248 | 7,630 | 432 | 7,198 | 115% | 5,570 | 5,290 | 1,339 | 3,951 | 71% | -44% |
| Philadelphia, PA | 21,986 | 13,595 | 1,762 | 11,833 | 54% | 18,042 | 5,686 | 3,659 | 2,027 | 11% | -43% |
| Kansas City, MO | 6,798 | 5,259 | 427 | 4,832 | 71% | 4,633 | 1,989 | 633 | 1,356 | 29% | -42% |
| Minneapolis, MN | 8,610 | 8,321 | 495 | 7,826 | 91% | 8,533 | 6,506 | 1,787 | 4,719 | 55% | -36% |
| Pittsburgh, PA | 8,248 | 3,759 | 389 | 3,370 | 41% | 7,569 | 1,111 | 532 | 579 | 8% | -33% |
| Baltimore, MD | 10,055 | 7,180 | 799 | 6,381 | 63% | 8,754 | 4,374 | 1,655 | 2,719 | 31% | -32% |
| New York, NY | 73,025 | 27,571 | 4,871 | 22,700 | 31% | 66,577 | 8,125 | 8,753 | -628 | -1% | -32% |
| Providence, RI | 4,622 | 2,950 | 323 | 2,627 | 57% | 3,993 | 1,580 | 580 | 1,000 | 25% | -32% |
| St. Louis, MO | 8,775 | 6,060 | 547 | 5,513 | 63% | 6,839 | 2,920 | 776 | 2,144 | 31% | -31% |
| Los Angeles, CA | 26,132 | 14,301 | 2,154 | 12,147 | 46% | 18,987 | 6,993 | 4,070 | 2,923 | 15% | -31% |
| Washington, D.C. | 16,117 | 14,772 | 1,387 | 13,385 | 83% | 14,045 | 10,339 | 2,872 | 7,467 | 53% | -30% |
| Hartford, CT | 4,787 | 2,589 | 263 | 2,326 | 49% | 4,432 | 1,342 | 504 | 838 | 19% | -30% |
| Dallas, TX | 24,498 | 15,864 | 1,808 | 14,056 | 57% | 22,581 | 10,073 | 3,618 | 6,455 | 29% | -29% |
| Louisville, KY | 2,990 | 2,235 | 214 | 2,021 | 68% | 2,745 | 1,491 | 328 | 1,163 | 42% | -25% |
| Houston, TX | 27,753 | 15,004 | 2,167 | 12,837 | 46% | 27,542 | 9,870 | 4,023 | 5,847 | 21% | -25% |
| Richmond, VA | 3,137 | 2,904 | 221 | 2,683 | 86% | 2,620 | 2,046 | 445 | 1,601 | 61% | -24% |
| Columbus, OH | 5,263 | 4,118 | 263 | 3,855 | 73% | 5,071 | 2,894 | 410 | 2,484 | 49% | -24% |
| Riverside, CA | 18,548 | 8,323 | 1,470 | 6,853 | 37% | 13,435 | 4,379 | 2,344 | 2,035 | 15% | -22% |
| San Diego, CA | 7,541 | 4,966 | 649 | 4,317 | 57% | 5,077 | 2,967 | 1,154 | 1,813 | 36% | -22% |
| Milwaukee, WI | 3,844 | 2,507 | 180 | 2,327 | 61% | 3,737 | 1,747 | 284 | 1,463 | 39% | -21% |
| Atlanta, GA | 25,477 | 16,173 | 1,807 | 14,366 | 56% | 23,545 | 11,385 | 3,126 | 8,259 | 35% | -21% |
| New Orleans, LA | 4,780 | 2,194 | 346 | 1,848 | 39% | 4,149 | 1,166 | 425 | 741 | 18% | -21% |
| Cleveland, OH | 7,434 | 4,260 | 459 | 3,801 | 51% | 5,664 | 2,504 | 741 | 1,763 | 31% | -20% |
| Charlotte, NC | 11,987 | 6,503 | 498 | 6,005 | 50% | 9,864 | 4,186 | 960 | 3,226 | 33% | -17% |
| Orlando, FL | 11,118 | 6,446 | 917 | 5,529 | 50% | 9,189 | 4,547 | 1,558 | 2,989 | 33% | -17% |
| Miami, FL | 57,390 | 15,748 | 4,940 | 10,808 | 19% | 52,521 | 8,021 | 6,811 | 1,210 | 2% | -17% |
| Indianapolis, IN | 4,883 | 4,181 | 317 | 3,864 | 79% | 4,042 | 3,067 | 520 | 2,547 | 63% | -16% |
| San Antonio, TX | 9,472 | 5,040 | 532 | 4,508 | 48% | 8,419 | 3,590 | 931 | 2,659 | 32% | -16% |
| Memphis, TN | 2,925 | 1,960 | 244 | 1,716 | 59% | 2,470 | 1,306 | 251 | 1,055 | 43% | -16% |
| Oklahoma City, OK | 4,793 | 3,219 | 369 | 2,850 | 59% | 4,379 | 2,340 | 433 | 1,907 | 44% | -16% |
| Tampa, FL | 15,605 | 8,436 | 1,246 | 7,190 | 46% | 12,313 | 5,872 | 2,093 | 3,779 | 31% | -15% |
| Austin, TX | 6,974 | 5,249 | 389 | 4,860 | 70% | 5,709 | 4,080 | 910 | 3,170 | 56% | -14% |
| Las Vegas, NV | 11,617 | 6,093 | 871 | 5,222 | 45% | 8,841 | 3,914 | 1,111 | 2,803 | 32% | -13% |
| Nashville, TN | 10,943 | 5,975 | 785 | 5,190 | 47% | 10,208 | 4,394 | 867 | 3,527 | 35% | -13% |
| Cincinnati, OH | 7,757 | 4,404 | 359 | 4,045 | 52% | 6,295 | 3,052 | 511 | 2,541 | 40% | -12% |
| Raleigh, NC | 6,591 | 3,674 | 209 | 3,465 | 53% | 6,127 | 2,976 | 460 | 2,516 | 41% | -12% |
| Birmingham, AL | 4,934 | 2,437 | 265 | 2,172 | 44% | 3,929 | 1,686 | 340 | 1,346 | 34% | -10% |
| Portland, OR | 7,263 | 5,318 | 381 | 4,937 | 68% | 5,192 | 3,836 | 806 | 3,030 | 58% | -10% |
| Jacksonville, FL | 8,849 | 4,080 | 543 | 3,537 | 40% | 7,388 | 3,350 | 906 | 2,444 | 33% | -7% |
| Seattle, WA | 7,034 | 8,900 | 457 | 8,443 | 120% | 4,783 | 6,193 | 774 | 5,419 | 113% | -7% |
| Virginia Beach, VA | 6,875 | 3,882 | 428 | 3,454 | 50% | 5,293 | 2,968 | 543 | 2,425 | 46% | -4% |
| Phoenix, AZ | 23,594 | 12,897 | 1,452 | 11,445 | 49% | 15,426 | 10,604 | 2,325 | 8,279 | 54% | 5% |
| Salt Lake City, UT | 3,427 | 2,489 | 231 | 2,258 | 66% | 1,587 | 1,429 | 286 | 1,143 | 72% | 6% |


