
-
The total worth of U.S. homes hit a record $47 trillion in June as a scarcity of houses for sale propped up values.
-
Affordable markets including Little Rock and Milwaukee saw the biggest jumps in value, while pricey West Coast metros and pandemic boomtowns faced large drops; L.A. has shed $153 billion since last summer.
-
Millennials gained more value than any other generation, surpassing the Silent Generation in total worth.
-
Asian homeowners were disproportionately affected by home-value declines; many live in the West, which saw an outsized drop in value.
-
Luxury homes are losing value, while homes worth between $250,000 and $750,000 are posting gains.
The total worth of U.S. homes hit a record $46.8 trillion in June, overtaking the prior all-time high of $46.6 trillion set a year earlier, as a shortage of homes for sale propped up housing values. That’s according to an analysis of the Redfin Estimate on more than 90 million U.S. residential properties. This data is subject to revision.
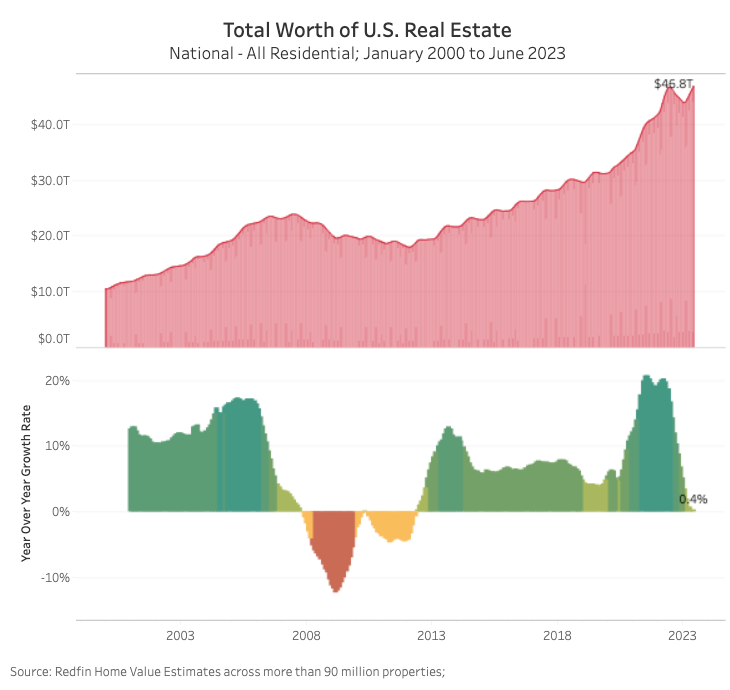
The value of U.S. homes rose 0.4% ($166.2 billion) from a year earlier in June and 19.1% ($7.5 trillion) from two years earlier. The housing market has now offset the $2.9 trillion decline in value—set off by rising mortgage rates—that occurred from June 2022 through February 2023.
Today’s housing market is unique because home values are at a record high even though demand is sluggish. Despite lukewarm demand, there aren’t enough homes to go around because so few homeowners are selling. This imbalance between supply and demand is keeping values afloat.
“The dominance of the 30-year fixed rate mortgage in America is propping up home values,” said Redfin Economics Research Lead Chen Zhao. “Tons of homeowners scored an incredible deal during the pandemic: a 3% mortgage rate for the remainder of their 30-year loan. Now they’re staying put because moving would mean taking on a rate that’s twice as high. This means buyers who are in the market now are duking it out for a very small pool of homes, preventing home values from plunging.”
In other countries, variable-rate mortgages are more common than fixed-rate mortgages, meaning the “lock in” effect is much less common.
Roughly nine in 10 homeowners with mortgages have a mortgage rate under 6%, which is nearly a full percentage point below today’s 6.96% average. As a result, just 1% of the nation’s homes have changed hands this year—the lowest share in at least a decade. The number of houses for sale in the U.S. dropped 15% year over year to an all-time low in June, the biggest annual decline in nearly two years.
“The U.S. housing market has become a system of winners and losers,” Zhao said. “The winners are homeowners who bought before mortgage rates started rising; they continue to build equity even though homebuyer demand has slowed. The losers, sadly, tend to be first-time buyers. They’re entering the market at a time when it’s expensive to borrow money, home prices are near their record high, and there are very few houses to choose from.”
West Coast Tech Hubs, Pandemic Boomtowns Saw Biggest Drops in Home Value
There are 32 U.S. metropolitan areas where aggregate home value declined from a year earlier in June, bucking the national trend. Eleven of those 32 are in California and seven are in Texas. This analysis includes the 100 most populous metro areas for which there was sufficient data.
The value of homes in Austin, TX fell 9.6% year over year to $388.1 billion in June—a larger decline than any other metro. Next came Oakland, CA (-8.7%), Seattle (-8.1%), San Francisco (-7.8%) and Los Angeles (-6.6%). Rounding out the top 10 are San Jose, CA, Phoenix, Oxnard, CA, Las Vegas and Sacramento, CA.
Pricey West Coast markets like San Francisco and Seattle have experienced outsized declines because they’re among the most expensive markets in the nation, meaning home values had more room to fall. Scores of remote workers left these areas during the pandemic in search of more space and better bang for their buck, contributing to the drop in value. Additionally, the West Coast has been hit hard by tech layoffs. Many buyers in pricey coastal markets also got sticker shock after seeing the impact of elevated mortgage rates on paper; in a metro like San Francisco, a higher rate can equate to a monthly housing bill that’s thousands of dollars more expensive.
The situation is somewhat similar in pandemic boomtowns; home values overheated, leaving many people priced out. Values surged in Sun Belt metros including Austin, Phoenix and Las Vegas because scores of remote workers moved in. Now, home values in those areas are coming back down to earth.
“Occasionally, a special house will get multiple offers, but that’s not the norm in Austin anymore,” said local Redfin Premier real estate agent Carmen Gioia. “Buyers are shopping but taking their sweet time, in part because there’s so much inventory. I’m warning my sellers that it could take a few weeks to sell, even if their home is priced well.”
In dollar terms, Los Angeles saw the biggest decline in aggregate home value, posting a $152.6 billion year-over-year decline in June. It was followed by Oakland (-$85.8 billion), Seattle (-$82.7 billion), Phoenix (-$58.4 billion) and San Francisco (-$57.5 billion).
Relatively Affordable Markets Posted the Biggest Gains in Home Value
The value of homes in Little Rock, AR climbed 8.8% year over year to $63.7 billion in June—a bigger increase than any other metro. Next came Camden, NJ (8.7%), Milwaukee (8.5%), Wilmington, DE (8.5%), Bridgeport, CT (8.3%), Greenville, SC (7.8%), Hartford, CT (7.6%), Charleston, SC (7.2%), Greensboro, NC (7.2%) and Columbia, SC (7.1%).
Home values in these areas didn’t overheat nearly as much as they did in places like Phoenix and San Francisco during the pandemic, meaning they have room to rise. In a majority of the 10 aforementioned markets, the typical home still sells for below the national median of $426,056. That’s likely bolstering homebuyer demand, because fewer people are priced out.
In dollar terms, Atlanta saw the biggest jump in aggregate home value, posting a $40.1 billion year-over-year increase in June. It was followed by Boston ($33.4 billion), Miami ($30.3 billion), New Brunswick, NJ ($22.6 billion) and Montgomery County, PA ($21.4 billion).
Millennials Now Hold More Home Value Than the Silent Generation
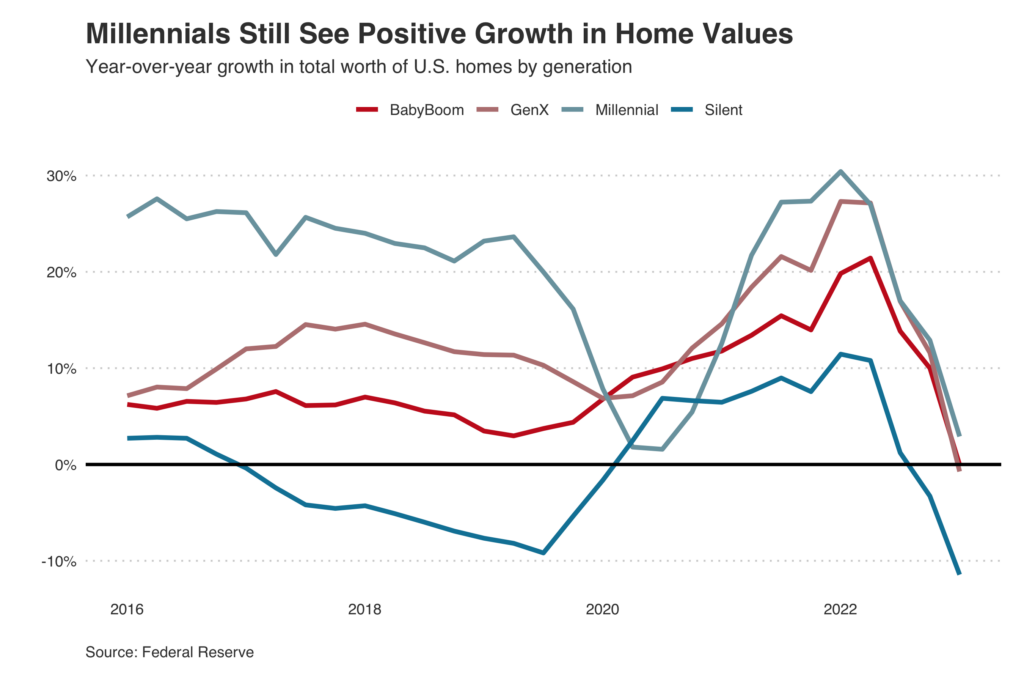
The total value of U.S. homes owned by millennials rose 2.9% year over year to $5 trillion in the first quarter of 2023—the most recent period for which generational data is available—a bigger increase than any other generation. That’s the second quarter in a row that Millennials have held more value than the Silent Generation, on a revised basis. The value of homes owned by the Silent Generation fell 11.4% to $4.7 trillion. Meanwhile, the value of homes owned by Generation X dropped 0.7% to $13.4 trillion, and the value of homes owned by Baby Boomers was flat, at $18 trillion.
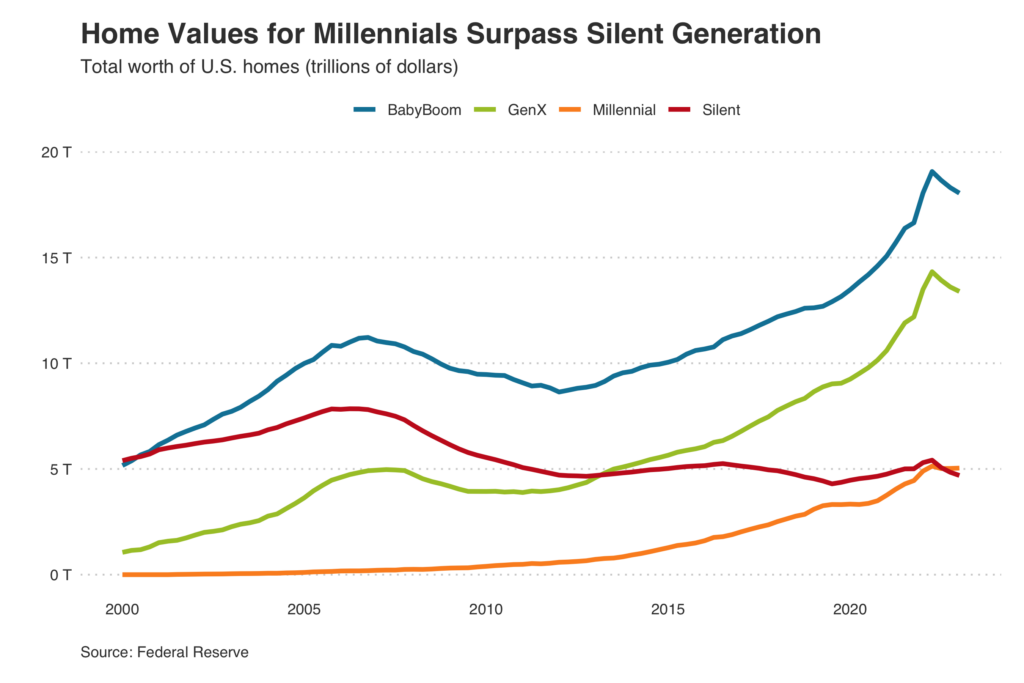
The Silent Generation has lost home value as many of its members have passed away or moved into retirement homes. Millennials have gained value because they’re in prime homebuying age, which means they’re purchasing substantially more homes than they were in recent years. Millennials now make up the biggest piece of the homebuying pie, purchasing roughly 60% of homes bought with mortgages over the last several years.
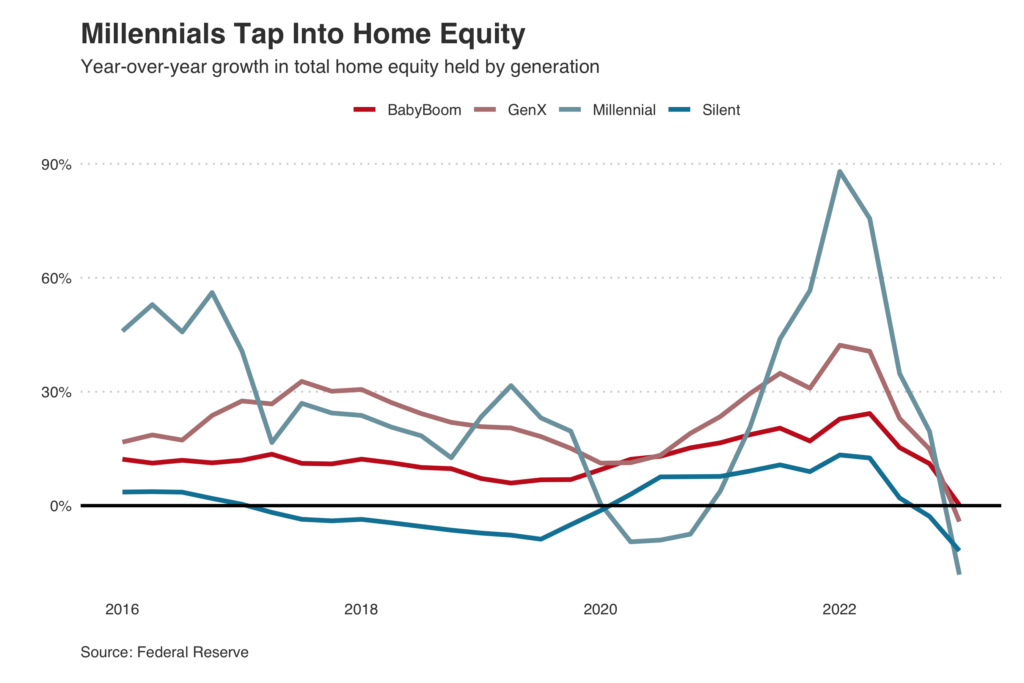
Interestingly, Millennials have lost home equity. Millennial home equity declined 18.2% year over year in the first quarter—a bigger decline than any other generation. That’s likely because Millennials are tapping into the home equity they gained during the pandemic—through products like home equity lines of credit (HELOC)—to pay off credit card debt and student loans and finance home renovations, Zhao said.
Home Values Held Up Better in Suburbs and Rural Areas Than in Urban Areas
The total value of homes in urban areas fell 0.9% year over year to $10.2 trillion in June. Meanwhile, the value of homes in the suburbs rose 0.2% to $29.1 trillion and the value of homes in rural areas increased 2.6% to $7.4 trillion.

The suburbs came back into vogue during the pandemic while cities fell out of favor—largely due to the shift to remote work and the housing affordability crisis. While cities have bounced back to some extent as employers have asked workers to return to the office, many Americans still work remotely, incentivizing homebuying in far-flung, affordable areas.
Asian Neighborhoods Experienced an Outsized Drop in Home Value
The total value of homes in neighborhoods that are majority Asian fell 3.3% year over year to $1.3 trillion in June. By comparison, majority Hispanic/Latino neighborhoods saw a 0.3% decline (to $1.9 trillion), while majority white neighborhoods experienced a 0.7% gain (to $38.1 trillion) and majority Black neighborhoods saw a 2.1% increase (to $1.3 trillion).
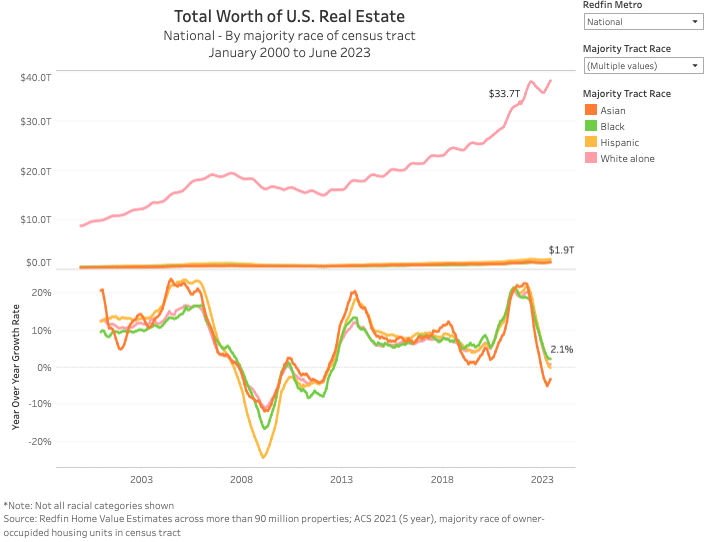
One reason Asian homeowners may be losing more value is many live on the West Coast, which has seen a relatively large dropoff in home value, Zhao said. Almost half of Asian Americans live in the West, with nearly a third in California alone, according to a 2021 report from Pew Research Center.
Homes Worth Between $250,000 and $750,000 Saw Biggest Jump in Value
The total value of homes worth between $500,000 and $750,000 increased 4.1% year over year in June, and those worth between $250,000 and $500,000 saw a 4% gain. By comparison, homes worth between $2 million and $5 million experienced a 7.4% drop in value, and homes worth between $1 million and $2 million saw a 2.6% decline.
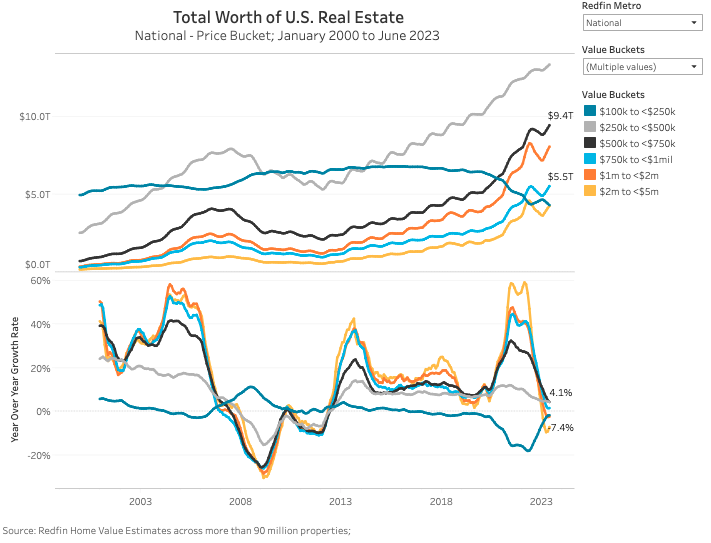
Many of the country’s high-end homes are located in pricey West Coast markets, which have seen outsized drops in home value. The luxury housing market has also been hit especially hard—particularly in the Bay Area and Seattle—as recession fears and high home prices have caused consumers to shy away from luxury goods.
Methodology
This analysis estimated current (June 2023) home values using the Redfin Estimate, MLS data and public records. The Redfin Estimate covers more than 90 million single-family homes, condos, townhouses and multifamily properties, and is available in most but not all parts of the U.S. Historical values were imputed using public records and MLS data on price per square foot trends by zip code (or city, county or state when zip-code data was insufficient). Both existing homes and new-construction homes are included in this dataset, which dates back to the year 2000. Homes are not added to the dataset until they are first built or sold.
Homes are determined to be rural, suburban or urban based on categories for the census tract of the property from the U.S. Department of Housing and Urban Development (HUD). HUD has a model that describes neighborhood types based on responses to the 2017 American Housing Survey.
Home values by race/ethnicity are based on a classification of the home’s census tract. We classified a census tract as Black, Hispanic/Latino, Asian or white if more than 50% of owner-occupied households were owned by Black, Hispanic/Latino, Asian or white homeowners from 2017 through 2021, according to owner-occupied household race data from the five-year American Community Survey. A census tract was classified as mixed race if no race had greater than 50% of the owner-occupied household share in the tract.
Home values by generation are based on the Distributional Financial Accounts data from the Federal Reserve.


