
Some homebuyers in pandemic boomtowns and expensive coastal markets have lower monthly housing costs than they would have a year ago. That’s because home prices have come down enough to offset rising mortgage rates in many of those places. Nationwide, just 7% of for-sale homes cost less than a year ago.
One-quarter of homes for sale in Austin, TX (25.8%) have lower estimated monthly housing payments than they would have if they had been for sale a year ago. That’s a higher share than any other major U.S. metropolitan area Redfin analyzed and more than triple the nationwide share of 7.1%.
Seattle is close behind, at 23.6%, followed by San Francisco (18.8%), New York (18.3%) and Pittsburgh (15.6%).
Hover your mouse above the circles on the map below to see data for your metro area.
This is according to a Redfin analysis of U.S. single-family homes, condos/co-ops and townhouses for sale as of April 11, 2023. We estimated what a homebuyer’s monthly housing payment would be on those homes using the Redfin Estimate of the homes’ value in April 2023 and the average U.S. mortgage rate in March 2023. To estimate what a homebuyer’s monthly payment would have been if those homes had been for sale a year earlier—which we refer to as “a year ago” in this report—we analyzed price per square foot trends and used the average mortgage rate in March 2022. Scroll down for a full methodology.
The housing market started to slow last year in response to rising mortgage rates, bringing down home prices in some parts of the country. While monthly payments on many for-sale homes remain higher than they would’ve been a year ago due to elevated mortgage rates, other homes have become more affordable because their value has dropped enough to offset the cost of a higher rate.
This is welcome news for house hunters following months of relentless price increases. The median U.S. home-sale price fell 3.3% year over year in March, the biggest annual decline in more than a decade. That’s bringing back buyers in some markets. In Austin, home prices decreased 13.6% year over year in March—the second biggest decline in the country. Pending home sales in Austin were down 32.9% year over year in March, but that’s an improvement from a record decline of 45.6% in January.
“We’re seeing a little more movement among homebuyers in Austin right now,” said local Redfin Premier real estate agent Andrew Vallejo. “There’s this group of house hunters that has been waiting on the sidelines for prices to come down, and they’ve decided to start buying this spring. They’re taking their time though; mortgage rates are still volatile and they know they have some negotiating power.”
Home sellers gave concessions to buyers in nearly half of home sales recorded by Redfin agents during the three months ending February 28, up from less than one-third a year earlier, a recent Redfin analysis found.
Home prices are falling fastest in pandemic boomtowns like Austin and expensive coastal markets like Seattle and San Francisco because prices in those places skyrocketed to unsustainable levels in recent years. Prices are now making their way back down to earth after many homebuyers were priced out.
In Boise, ID, the median sale price fell 15.4% year over year in March—more than anywhere else in the U.S.—and 12.3% of homes for sale have lower estimated monthly payments than they would have a year ago. Still, many people remain priced out, according to local Redfin Premier real estate agent Shauna Pendleton.
“Home prices in Boise jumped during the pandemic because people were flooding in from high-income states like California and Washington. Now locals can’t afford to buy homes,” Pendleton said. “Prices rose too drastically, so now they’re dropping, but they still haven’t fallen enough to bring a ton of buyers back to the market.”
Oftentimes, “more affordable” doesn’t mean “affordable.” Take Seattle, where the median home-sale price was $742,000 in March, nearly double the national median of about $400,000. San Francisco’s $1.4 million median sale price is nearly quadruple the national median. The $450,000 median sale price in Austin isn’t far from the national median, but is 35.8% higher than it was at the onset of the pandemic in March 2020. Since incomes haven’t kept up, many people remain priced out of homeownership.
In many places, home prices haven’t fallen enough to offset the cost from higher mortgage rates, meaning homeownership remains prohibitively expensive for many Americans. Mortgage rates are near their highest level in over two decades, which has sent the monthly payment for the typical homebuyer up more than $250 from a year ago.
Drop in Home Prices Brings Some Buyers Back, But Keeps Many Sellers Sidelined
“The decline in home prices is good news for house hunters, but the irony is that it’s also limiting their options because it’s making a lot of homeowners hesitant to sell,” said Redfin Economics Research Lead Chen Zhao. “Elevated rates and declining prices are prompting many sellers to stay put, which is fueling a housing shortage that’s keeping prices from falling further.”
In many parts of the country, home sellers who bought during the pandemic are in an especially tricky situation because there’s a chance they’ll sell at a loss, Pendleton said.
One seller Pendleton is working with bought their newly built home for $390,000 less than a year ago and now needs to relocate to care for family. While their house received four offers in under a week and sold at the $370,000 asking price, the seller still ended up losing about $37,000 when accounting for agent commissions.
“When I meet with prospective sellers who purchased their homes recently, I’m suggesting they stay put for a while longer if they can. If you bought in 2021 or early 2022, you may sell for what you paid or less,” Pendleton said. “People who bought before 2020 are in a much better position to profit. One of my sellers purchased their home in 2018 for around $400,000 and is now likely going to sell it for close to $1 million.”
Nationwide, 4.8% of homes that sold in March sold for less than the buyer paid, a separate Redfin analysis found. While that’s relatively low, it’s more than double the 2.3% share a year earlier.
In Orlando and Des Moines, Just 1% of Homes for Sale Cost Less Than They Would Have a Year Ago
In Orlando, FL, 1.2% of homes have lower estimated monthly housing payments than they would have a year ago—the lowest share among the metros Redfin analyzed. Next came Des Moines, IA (1.2%), Richmond, VA (1.4%), Lakeland, FL (1.8%) and Raleigh, NC (1.9%).
While these areas saw home prices climb during the pandemic, they remain affordable compared to places like Seattle and San Francisco. Because they’re more affordable, demand has held up relatively well, which has kept home prices afloat.
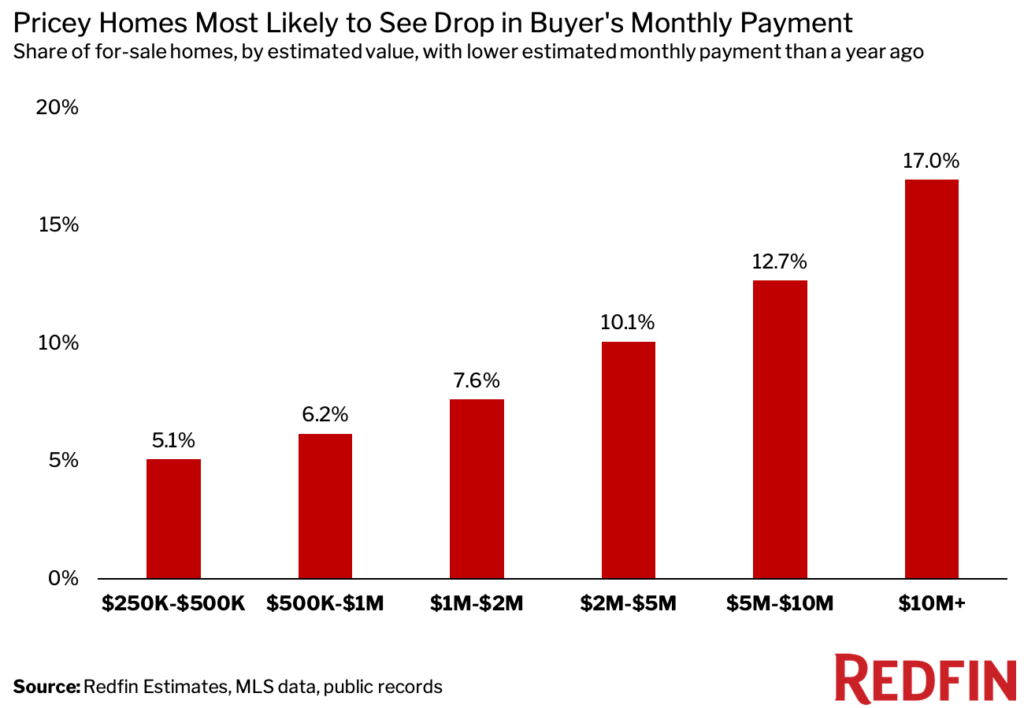
The Highest-Priced Homes for Sale Are Most Likely to Cost Less Than They Would Have a Year Ago
One of every six (17%) U.S. homes for sale with an estimated value of $10 million or above has a lower estimated monthly payment than it would have a year ago. That compares with 6.2% of homes for sale with an estimated value of $500,000 to $1 million, and 5.1% of homes for sale with an estimated value of $250,000 to $500,000.
Luxury homes are losing value because demand for high-end goods tends to dwindle during times of economic hardship and uncertainty. Purchases of luxury homes fell a record 44.6% year over year to the second lowest level on record during the three months ending January 31, a recent Redfin analysis found.
“We’re seeing a serious stall in demand for homes in the $700,000 and above price point. People just can’t afford it,” Pendleton said. “Homes priced below $500,000 are still hot. Some are getting multiple offers.”
Suburban Single-Family Homes Have Held Their Value Better Than Urban Condos
Nationwide, 10.3% of urban homes for sale have lower estimated monthly payments than they would have a year ago. That compares with 7% of rural homes and 5.8% of suburban homes.
The suburbs came back into vogue during the pandemic while cities fell out of favor—largely because remote work made proximity to the office less of a priority. Scores of people left urban areas for the suburbs and rural areas in search of more space and relatively affordable housing, which is helping suburban and rural homes hold their value today.
This helps explain why single-family homes, which are often concentrated in the suburbs, have held their value better than condos, which are often concentrated in cities.
Nationwide, 6.8% of single-family homes and townhouses for sale have lower estimated monthly payments than they would have a year ago, compared with 9% of condos and co-ops.
Metro-Level Summary
We analyzed the 100 most populous metros and excluded a select few due to insufficient data. The metros with the highest share of for-sale homes that cost less than they would have a year ago are at the top of the list.
| U.S. metro area | Share of for-sale homes with lower estimated monthly housing payment than a year ago | Median sale price: March 2023 | Change in median sale price: March 2022-March 2023 |
| Austin, TX | 25.8% | $450,000 | -13.6% |
| Seattle, WA | 23.6% | $742,000 | -9.5% |
| San Francisco, CA | 18.8% | $1,425,000 | -8.9% |
| New York, NY | 18.3% | $665,000 | -2.2% |
| Pittsburgh, PA | 15.6% | $200,000 | -5.4% |
| Philadelphia, PA | 15.3% | $260,000 | -1.9% |
| Memphis, TN | 15.0% | $278,250 | -0.6% |
| Cape Coral, FL | 14.9% | $400,000 | 3.9% |
| Oakland, CA | 13.1% | $889,000 | -9.3% |
| San Jose, CA | 12.5% | $1,390,000 | -10.5% |
| Boise, ID | 12.3% | $439,695 | -15.4% |
| Detroit, MI | 12.1% | $160,000 | -3.0% |
| New Orleans, LA | 11.8% | $271,750 | -2.9% |
| Salt Lake City, UT | 11.6% | $515,000 | -3.7% |
| West Palm Beach, FL | 11.2% | $446,000 | 8.8% |
| Riverside, CA | 11.1% | $540,000 | -3.6% |
| Cleveland, OH | 11.0% | $193,000 | 1.6% |
| Denver, CO | 10.1% | $565,000 | -6.1% |
| Gary, IN | 9.8% | $241,000 | -2.4% |
| Portland, OR | 9.6% | $525,000 | -4.5% |
| St. Louis, MO | 9.2% | $235,000 | 4.4% |
| Akron, OH | 8.8% | $169,900 | -0.1% |
| Birmingham, AL | 8.4% | $268,241 | -2.1% |
| Sacramento, CA | 8.3% | $535,000 | -11.9% |
| Anaheim, CA | 8.2% | $975,000 | -6.1% |
| Stockton, CA | 8.0% | $518,900 | -6.5% |
| Los Angeles, CA | 7.7% | $820,000 | -6.3% |
| Tacoma, WA | 7.4% | $530,000 | -3.8% |
| San Diego, CA | 6.6% | $825,000 | -2.9% |
| Chicago, IL | 6.3% | $305,000 | -1.6% |
| Phoenix, AZ | 6.3% | $430,000 | -8.7% |
| Cincinnati, OH | 6.2% | $255,000 | 2.0% |
| Baltimore, MD | 6.0% | $330,000 | -2.9% |
| Rochester, NY | 5.8% | $195,000 | 5.4% |
| Little Rock, AR | 5.7% | $225,000 | 6.6% |
| Baton Rouge, LA | 5.5% | $258,680 | 2.0% |
| New Haven, CT | 5.4% | $290,000 | 3.6% |
| Washington, D.C. | 5.1% | $520,000 | -1.0% |
| Nassau County, NY | 5.0% | $579,000 | -2.7% |
| Tulsa, OK | 5.0% | $257,500 | 9.6% |
| Dayton, OH | 4.9% | $185,000 | 4.5% |
| Buffalo, NY | 4.8% | $203,000 | 4.1% |
| Honolulu, HI | 4.7% | $720,000 | 4.0% |
| Louisville, KY | 4.6% | $247,000 | 5.1% |
| Fresno, CA | 4.4% | $400,000 | 0.0% |
| North Port, FL | 4.2% | $465,000 | 4.5% |
| Wilmington, DE | 4.2% | $300,000 | 12.6% |
| Bakersfield, CA | 4.2% | $345,000 | 0.0% |
| Newark, NJ | 4.2% | $480,000 | 4.3% |
| Oxnard, CA | 4.2% | $790,000 | -3.7% |
| Greenville, SC | 4.2% | $308,851 | 3.0% |
| Atlanta, GA | 4.1% | $370,000 | 0.5% |
| Boston, MA | 4.1% | $650,000 | 2.0% |
| Las Vegas, NV | 4.1% | $400,000 | -7.0% |
| McAllen, TX | 4.0% | $229,000 | 7.5% |
| Allentown, PA | 4.0% | $300,000 | 6.8% |
| Oklahoma City, OK | 3.8% | $258,613 | 5.6% |
| Columbus, OH | 3.8% | $310,000 | 5.5% |
| San Antonio, TX | 3.7% | $314,000 | -0.3% |
| Bridgeport, CT | 3.6% | $510,000 | 2.2% |
| Warren, MI | 3.6% | $270,050 | 3.4% |
| Charleston, SC | 3.4% | $415,385 | 5.2% |
| Fort Lauderdale, FL | 3.3% | $400,000 | 8.1% |
| Tampa, FL | 3.3% | $365,900 | 0.2% |
| Hartford, CT | 3.3% | $293,250 | 8.6% |
| Montgomery County, PA | 3.2% | $422,600 | 5.6% |
| Minneapolis, MN | 3.2% | $357,500 | 0.7% |
| Providence, RI | 3.1% | $405,000 | 5.2% |
| Dallas, TX | 3.1% | $419,000 | -0.2% |
| Indianapolis, IN | 3.0% | $275,000 | 3.8% |
| Nashville, TN | 3.0% | $433,000 | 0.7% |
| Frederick, MD | 3.0% | $495,000 | -3.9% |
| Camden, NJ | 3.0% | $295,000 | 9.3% |
| New Brunswick, NJ | 2.9% | $441,000 | 3.8% |
| Albany, NY | 2.9% | $270,769 | 4.1% |
| Charlotte, NC | 2.9% | $379,000 | 0.0% |
| Omaha, NE | 2.8% | $300,500 | 10.9% |
| El Paso, TX | 2.7% | $250,000 | 11.1% |
| Houston, TX | 2.6% | $326,100 | -1.2% |
| Tucson, AZ | 2.6% | $349,843 | 2.9% |
| Jacksonville, FL | 2.6% | $342,388 | -3.1% |
| Knoxville, TN | 2.6% | $349,900 | 10.3% |
| Virginia Beach, VA | 2.5% | $320,000 | 4.9% |
| Lake County, IL | 2.3% | $308,250 | 6.3% |
| Miami, FL | 2.2% | $499,639 | 7.4% |
| Milwaukee, WI | 2.2% | $282,000 | 10.4% |
| Grand Rapids, MI | 2.2% | $307,250 | 5.9% |
| Elgin, IL | 2.2% | $309,900 | 7.8% |
| Greensboro, NC | 2.0% | $260,000 | 6.1% |
| Worcester, MA | 2.0% | $383,750 | 5.2% |
| Fort Worth, TX | 2.0% | $347,990 | -1.1% |
| Raleigh, NC | 1.9% | $419,000 | -0.2% |
| Lakeland, FL | 1.8% | $320,144 | 1.3% |
| Richmond, VA | 1.4% | $344,950 | 0.6% |
| Des Moines, IA | 1.2% | $270,000 | 1.1% |
| Orlando, FL | 1.2% | $390,000 | 3.2% |
Methodology
Redfin analyzed MLS data to identify U.S. single-family homes, condos/co-ops and townhouses for sale as of April 11, 2023. We estimated what a homebuyer’s monthly housing payment would be on those homes using the Redfin Estimate of the homes’ value in April 2023 and the average U.S. 30-year-fixed conventional and jumbo mortgage rates in March 2023. To estimate what a homebuyer’s monthly payment would have been if those homes had been for sale a year earlier, we first estimated the year-ago home value by extrapolating the most recent Redfin Estimate backwards using price-per-square-foot trends derived from MLS data and public records. Then we calculated the monthly payment using the average 30-year-fixed conventional and jumbo mortgage rates in March 2022.
When estimating monthly housing payments, we assumed a 20% down payment, 1.25% annual property-tax rate and a homeowner’s insurance rate equal to 0.5% of the purchase price.
We used mortgage-rate data from Optimal Blue. National statistics represent the entire U.S., while metro-level data comes from a list of the 100 most populous U.S. metros.


