
1 in 5 home listings was affordable for the typical U.S. household, down from 2 in 5 in 2021. White households had three times as many affordable options as Black households.
Can’t find a home you can afford? It’s not just you. Roughly one in five (21%) U.S. homes for sale in 2022 was affordable for the typical household, down from two in five (40%) in 2021 and the lowest share on record.
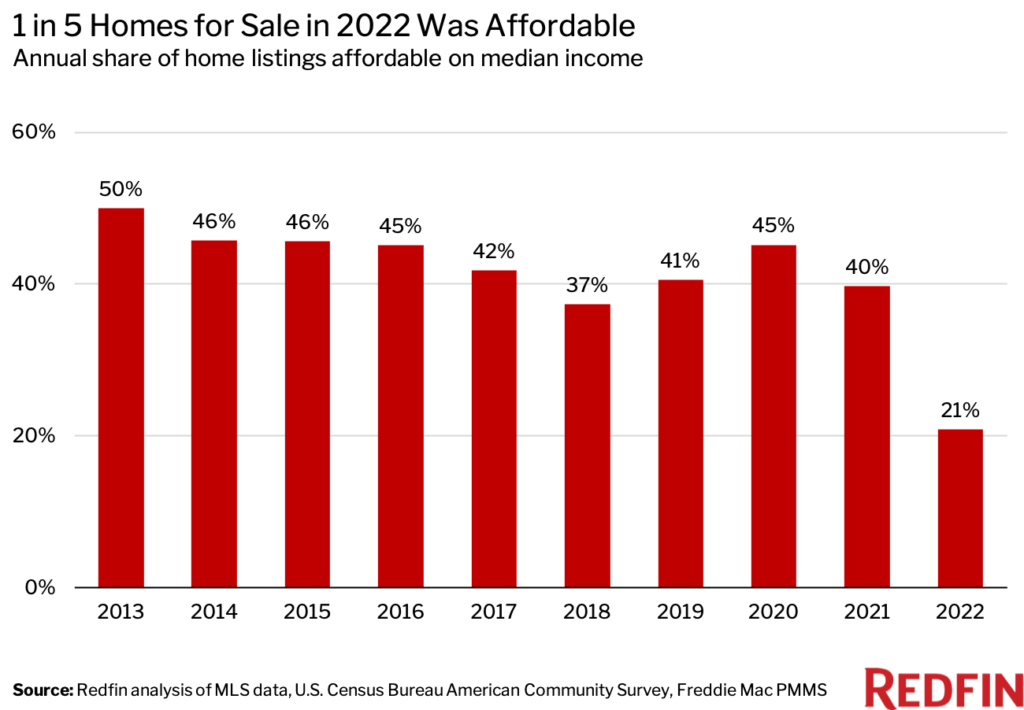
That’s according to a Redfin analysis of home listings in the 100 most populous U.S. metropolitan areas. A listing is considered affordable if the estimated monthly mortgage payment is no more than 30% of the local county’s median income.
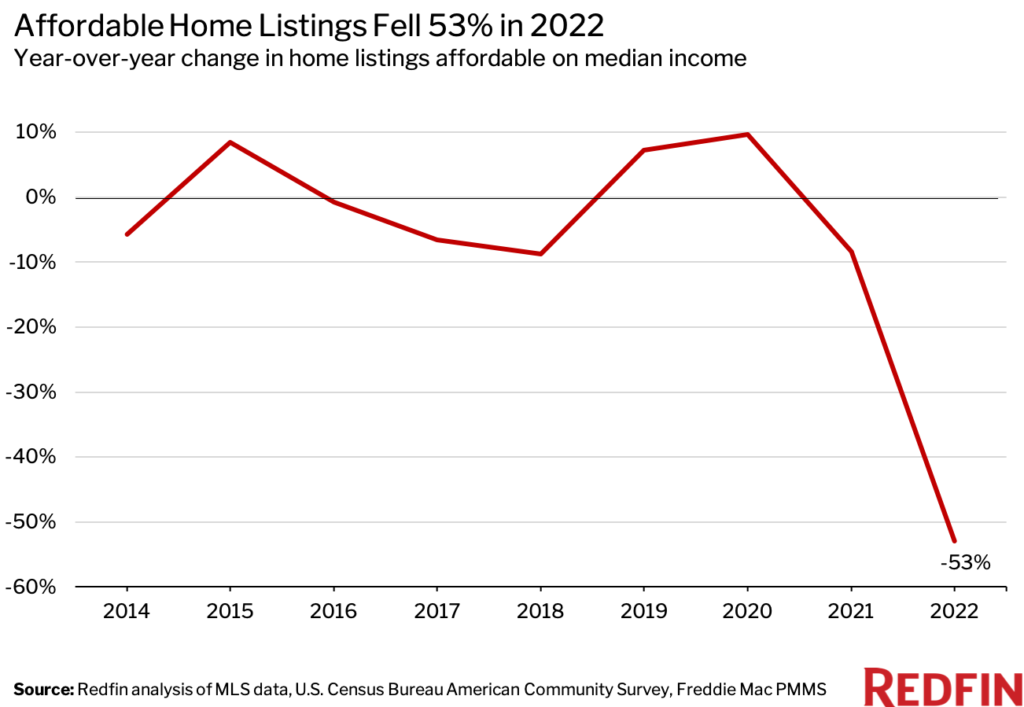
The number of affordable listings fell 53% from a year earlier in 2022—the largest annual drop in Redfin’s records, which date back to 2013. While that’s partly due to a decline in listings in general—new listings fell 10% year over year—it’s mostly due to the fact that higher mortgage rates made the listings hitting the market less affordable.
The housing affordability crisis has intensified for three primary reasons:
- Mortgage rates have more than doubled from the all-time low of 2.65% in 2021 as the Federal Reserve seeks to quell inflation. The average 30-year-fixed mortgage rate today is 6.65%, which has caused the monthly mortgage payment on the median-asking-price home to increase by over $500 from this time last year. The average rate in 2022 was 5.34%, up from 2.96% in 2021.
- The pandemic homebuying boom caused home prices to surge, and they increased faster than incomes. While prices have fallen 12% from their May peak, they remain about 32% higher than they were before the pandemic started roughly three years ago.
- There aren’t enough homes for sale, which is keeping prices afloat. There were fewer new listings in January than any month on record aside from April 2020, when the onset of the pandemic brought the housing market to a halt.
“Housing affordability is at the lowest level in history, which will widen the wealth gap—especially between millennials,” said Redfin Deputy Chief Economist Taylor Marr. “Many millennials were able to buy their first home before or during the pandemic homebuying boom, but many others were priced out of homeownership and forced to keep renting. That means a lot of young adults missed out on a major wealth building opportunity: the value of homes owned by millennials has risen nearly 30% in the past year. ”
Marr continued: “The good news is that housing affordability should improve. Mortgage rates will eventually come down as the Fed makes progress fighting inflation, and home prices have already begun falling. Incomes are also growing faster than the historical norm.”
The Biden Administration recently announced that it’s cutting mortgage-insurance rates for homebuyers who take out loans backed by the Federal Housing Administration (FHA). The move is estimated to save roughly 850,000 homebuyers, many of whom are low-income and/or first-time buyers, an average of $800 per year. It goes into effect March 20.
Some states, including California and Oregon, have also passed legislation that allows for the construction of more starter homes. Increased supply could help limit home-price growth over time. If executed well, these new laws could serve as a blueprint for other areas grappling with housing shortages.
White Households Can Afford Three Times as Many Homes as Black Households
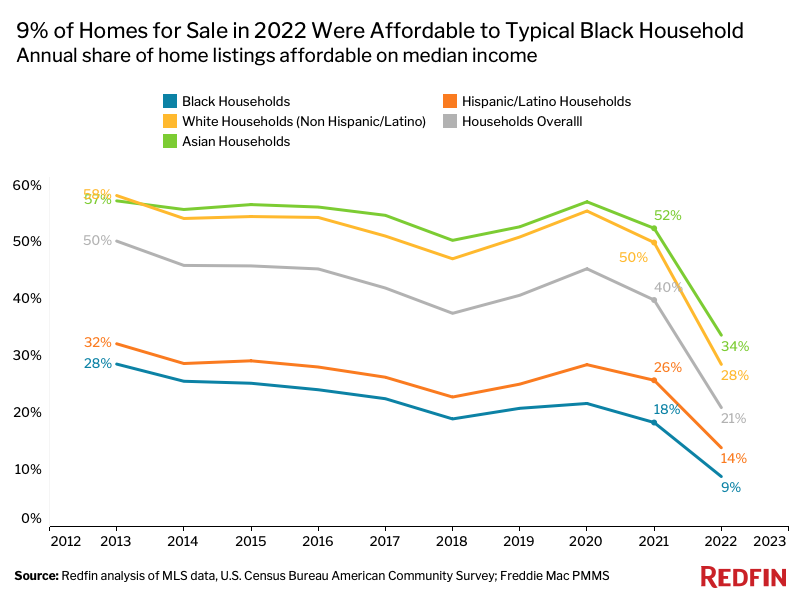
Only 9% of homes for sale last year were affordable for the typical Black household, compared with 28% for the typical white household and the lowest share of any race in this analysis. The share was nearly as low for Hispanic/Latino households (14%) and was highest for Asian households (34%).
Affordability has also fallen slightly faster for Black households than for white households. The share of listings affordable for the typical Black household was cut in half (9% in 2022 vs 18% in 2021), while the share affordable for the typical white household fell by less than half (28% vs 50%).
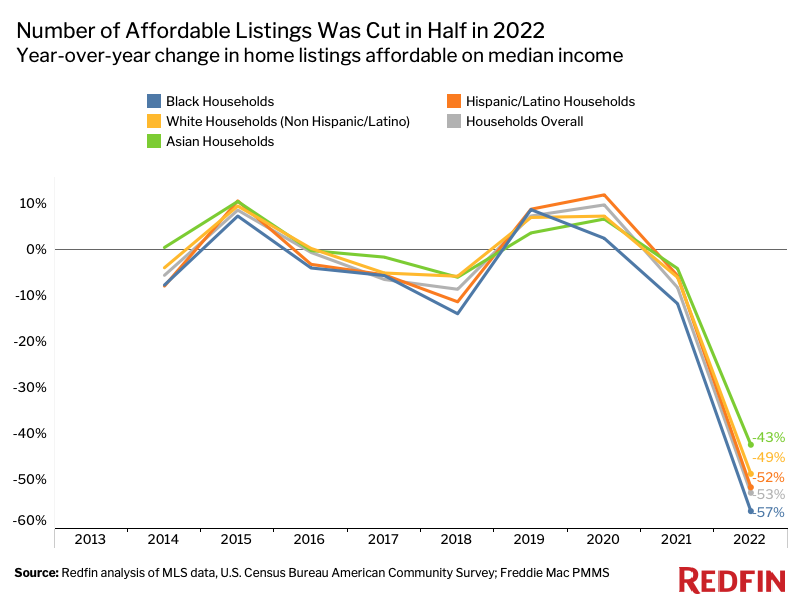
The number of listings affordable for the typical Black household dropped a record 57% in 2022 from the year before—a larger decline than any other race in this analysis—while the number of listings affordable for the typical white household fell a record 49%. Hispanic/Latino and Asian households also experienced record declines in the number of listings affordable.
“Housing has become incredibly unaffordable for a lot of Americans, but Black families have been hit especially hard because they’re often less wealthy to begin with,” said Redfin Chief Economist Daryl Fairweather. “On average, Black Americans earn less money, have less generational wealth, and have lower credit scores (and sometimes no credit scores at all) than white Americans. That makes it tougher to afford a down payment and qualify for a low mortgage rate. They also frequently face racial bias during the homebuying process.”
The racial housing affordability gap exists nationwide, from the least affordable metros to the most affordable metros. In Detroit, for example, 33% of listings were affordable for the typical Black household last year—the highest share in the country. But that’s still less than half the share affordable for the typical white household (70%). In Los Angeles, one of the most expensive markets in the country, people across the board have a hard time finding affordable housing. Still, Black house hunters have fewer options. Close to zero (0.1%) listings were affordable for the typical Black household in 2022, compared with 2% for the typical white household.
There are a few slivers of good news, Fairweather said. The Black unemployment rate has been falling on a seasonally-adjusted basis, helping to shrink the gap between the white and Black unemployment rates. Rent growth has also been slowing, which disproportionately affects Black Americans because they’re more likely to be renters.
Pandemic Boomtowns, Pricey Coastal Cities Saw Largest Declines in Affordable Homes
The 100 most populous U.S. metro areas all had fewer affordable homes for sale in 2022 than in 2021. In Boise, ID, the number of home listings affordable to the typical local household plunged 86% year over year. It was followed by San Diego (-85%), Salt Lake City (-84%), Oxnard, CA (-83%) and Austin, TX (-82%).
Some of the metros above, including San Diego and Oxnard, have long been expensive. That means that many homes were verging on unaffordable before the pandemic, and have since been pushed over the threshold due to rising prices and mortgage rates. Other metros, including Boise, Salt Lake City and Austin, were relatively affordable before the pandemic, but the homebuying boom pushed prices out of reach for many house hunters. These areas surged in popularity as scores of remote workers moved in, searching for space and affordability.
Relatively affordable places saw the smallest declines in the number of affordable homes. In Detroit, the number of affordable listings fell 16% year over year in 2022. Next came Akron, OH (-24%), Cleveland (-25%), Pittsburgh (-27%) and Philadelphia (-28%).
Hover your mouse above the circles on the map below to see data for your metro area.
Housing Affordability Summary: 100 Most Populous Metros
| U.S. Metro Area | 2022: Share of Listings Affordable | 2021: Share of Listings Affordable | Change in Number of Affordable Listings (2021-2022) |
| Akron, OH | 56.7% | 69.7% | -23.6% |
| Albany, NY | 36.6% | 59.1% | -47.2% |
| Albuquerque, NM | 14.7% | 43.0% | -71.8% |
| Allentown, PA | 33.9% | 56.7% | -48.1% |
| Anaheim, CA | 1.9% | 6.2% | -75.4% |
| Atlanta, GA | 22.4% | 52.1% | -61.7% |
| Austin, TX | 4.4% | 24.1% | -82.4% |
| Bakersfield, CA | 10.5% | 25.6% | -62.2% |
| Baltimore, MD | 41.1% | 60.9% | -44.1% |
| Baton Rouge, LA | 34.0% | 60.5% | -51.5% |
| Birmingham, AL | 40.2% | 58.9% | -37.9% |
| Boise City, ID | 1.3% | 7.9% | -86.2% |
| Boston, MA | 8.7% | 22.9% | -66.7% |
| Bridgeport, CT | 16.6% | 32.0% | -59.1% |
| Buffalo, NY | 41.3% | 60.0% | -36.0% |
| Camden, NJ | 44.9% | 66.2% | -42.4% |
| Cape Coral, FL | 7.9% | 36.5% | -79.5% |
| Charleston, SC | 11.6% | 38.4% | -73.2% |
| Charlotte, NC | 19.2% | 46.0% | -64.9% |
| Chicago, IL | 39.2% | 53.6% | -39.2% |
| Cincinnati, OH | 48.0% | 66.8% | -35.6% |
| Cleveland, OH | 53.5% | 63.8% | -24.8% |
| Colorado Springs, CO | 8.7% | 33.4% | -75.1% |
| Columbia, SC | 28.7% | 55.9% | -54.7% |
| Columbus, OH | 35.6% | 58.5% | -46.1% |
| Dallas, TX | 12.7% | 39.0% | -67.3% |
| Dayton, OH | 53.3% | 69.0% | -29.2% |
| Denver, CO | 5.6% | 26.4% | -81.0% |
| Des Moines, IA | 46.3% | 65.7% | -37.7% |
| Detroit, MI | 54.3% | 63.5% | -16.1% |
| El Paso, TX | 11.8% | 36.8% | -70.0% |
| Elgin, IL | 50.0% | 65.4% | -37.5% |
| Fort Lauderdale, FL | 15.8% | 28.8% | -49.6% |
| Fort Worth, TX | 11.4% | 37.6% | -69.3% |
| Frederick, MD | 28.6% | 50.7% | -55.4% |
| Fresno, CA | 8.9% | 22.8% | -63.5% |
| Gary, IN | 40.6% | 65.5% | -41.8% |
| Grand Rapids, MI | 38.1% | 56.6% | -35.6% |
| Greensboro, NC | 33.8% | 56.9% | -48.9% |
| Greenville, SC | 24.1% | 54.3% | -57.6% |
| Hartford, CT | 39.5% | 60.8% | -47.2% |
| Honolulu, HI | 5.1% | 13.9% | -68.5% |
| Houston, TX | 19.0% | 40.9% | -55.4% |
| Indianapolis, IN | 40.0% | 69.7% | -43.6% |
| Jacksonville, FL | 19.7% | 48.4% | -65.2% |
| Kansas City, MO | 43.1% | 63.3% | -40.2% |
| Knoxville, TN | 17.4% | 53.0% | -70.5% |
| Lake County, IL | 48.7% | 55.5% | -31.8% |
| Lakeland, FL | 8.9% | 33.2% | -69.8% |
| Las Vegas, NV | 7.3% | 25.7% | -74.2% |
| Little Rock, AR | 40.0% | 67.0% | -45.7% |
| Los Angeles, CA | 0.5% | 2.1% | -80.2% |
| Louisville, KY | 39.5% | 64.8% | -46.1% |
| McAllen, TX | 14.0% | 31.5% | -51.1% |
| Memphis, TN | 35.3% | 52.7% | -35.2% |
| Miami, FL | 3.2% | 11.7% | -75.4% |
| Milwaukee, WI | 34.6% | 55.5% | -46.5% |
| Minneapolis, MN | 33.7% | 59.9% | -51.9% |
| Montgomery County, PA | 35.1% | 56.5% | -49.3% |
| Nashville, TN | 7.2% | 35.9% | -80.1% |
| Nassau County, NY | 9.2% | 19.5% | -58.7% |
| New Brunswick, NJ | 20.7% | 38.8% | -53.6% |
| New Haven, CT | 29.6% | 49.3% | -48.6% |
| New Orleans, LA | 24.1% | 44.4% | -45.3% |
| New York, NY | 4.5% | 10.2% | -60.3% |
| Newark, NJ | 16.3% | 29.0% | -53.0% |
| North Port, FL | 6.7% | 29.9% | -77.6% |
| Oakland, CA | 2.5% | 8.2% | -74.4% |
| Oklahoma City, OK | 40.8% | 67.6% | -45.1% |
| Omaha, NE | 40.5% | 64.6% | -43.8% |
| Orlando, FL | 10.6% | 31.0% | -67.4% |
| Oxnard, CA | 1.2% | 5.8% | -83.1% |
| Philadelphia, PA | 32.9% | 41.6% | -27.6% |
| Phoenix, AZ | 8.0% | 30.3% | -75.6% |
| Pittsburgh, PA | 52.7% | 65.6% | -26.8% |
| Portland, OR | 3.6% | 15.2% | -79.6% |
| Providence, RI | 8.9% | 28.0% | -72.9% |
| Raleigh, NC | 18.6% | 49.4% | -66.1% |
| Richmond, VA | 31.6% | 56.4% | -53.2% |
| Riverside, CA | 4.3% | 14.4% | -72.9% |
| Rochester, NY | 49.0% | 62.9% | -28.7% |
| Sacramento, CA | 4.4% | 14.7% | -73.8% |
| Salt Lake City, UT | 4.8% | 26.0% | -83.6% |
| San Antonio, TX | 15.1% | 38.9% | -62.1% |
| San Diego, CA | 0.9% | 5.0% | -84.9% |
| San Francisco, CA | 0.3% | 0.6% | -53.0% |
| San Jose, CA | 1.4% | 4.5% | -74.9% |
| Seattle, WA | 5.4% | 15.6% | -70.2% |
| St. Louis, MO | 54.4% | 69.7% | -30.5% |
| Stockton, CA | 7.0% | 17.4% | -64.0% |
| Tacoma, WA | 3.8% | 16.5% | -80.1% |
| Tampa, FL | 10.6% | 32.7% | -69.0% |
| Tucson, AZ | 9.3% | 31.8% | -74.0% |
| Tulsa, OK | 37.4% | 62.3% | -46.4% |
| Virginia Beach, VA | 32.8% | 58.6% | -52.8% |
| Warren, MI | 47.9% | 64.6% | -33.3% |
| Washington, D.C. | 25.9% | 48.5% | -57.3% |
| West Palm Beach, FL | 14.3% | 32.7% | -58.8% |
| Wilmington, DE | 38.4% | 64.8% | -51.0% |
| Worcester, MA | 21.1% | 45.8% | -59.2% |
| National—U.S.A. | 20.8% | 39.7% | -53% |
Methodology
This analysis used MLS listing data and county-level data from the U.S. Census Bureau’s American Community Survey on median household income for non Hispanic/Latino white households, Black households, Asian households, Hispanic/Latino households and households overall. To estimate the share of homes affordable in 2022, we used income data from 2021—the most recent data available. To estimate the share of homes affordable in 2021, we used income data from 2020.
The national share of homes affordable was calculated by taking the sum of affordable listings in the 100 most populous U.S. metros and dividing it by the sum of all listings in those metros. We used a weighted average of median incomes across those metros. Metro-level calculations measure the share of homes affordable for the typical household within the metro, based on the local median income.
We define an “affordable” listing as one where the monthly mortgage payment would be no more than 30% of the county’s median income. We estimated the monthly mortgage payment for each listing using the average 30-year-fixed mortgage rate during the month the home hit the market, according to Freddie Mac’s Primary Mortgage Market Survey. We assumed a 5% down payment, private mortgage insurance of 0.75% of the list price and homeowner’s insurance of $70 per month. We also factored in property tax data, assuming a tax rate of 1.25% of the list price if no record was available. We restricted our analysis to single-family homes, condos and townhomes with two bedrooms or more.


