As Americans grow accustomed to a new reality under quarantine, fewer people are delisting their homes, properties are sitting on the market for longer and growth in home prices has officially hit zero, according to research from Redfin.
Here are five charts that illustrate the latest developments in the housing market as the coronavirus pandemic continues to upend residential real estate and the spring home buying season.
The Rush to Delist Is Slowing
Americans are still removing their homes from the market at a higher rate than they were at this time last year, but at a significantly lower rate than they were several weeks ago. During the week ending April 10, delistings rose 68% year-over-year to 20,544 homes, down from 148% during the final week of March.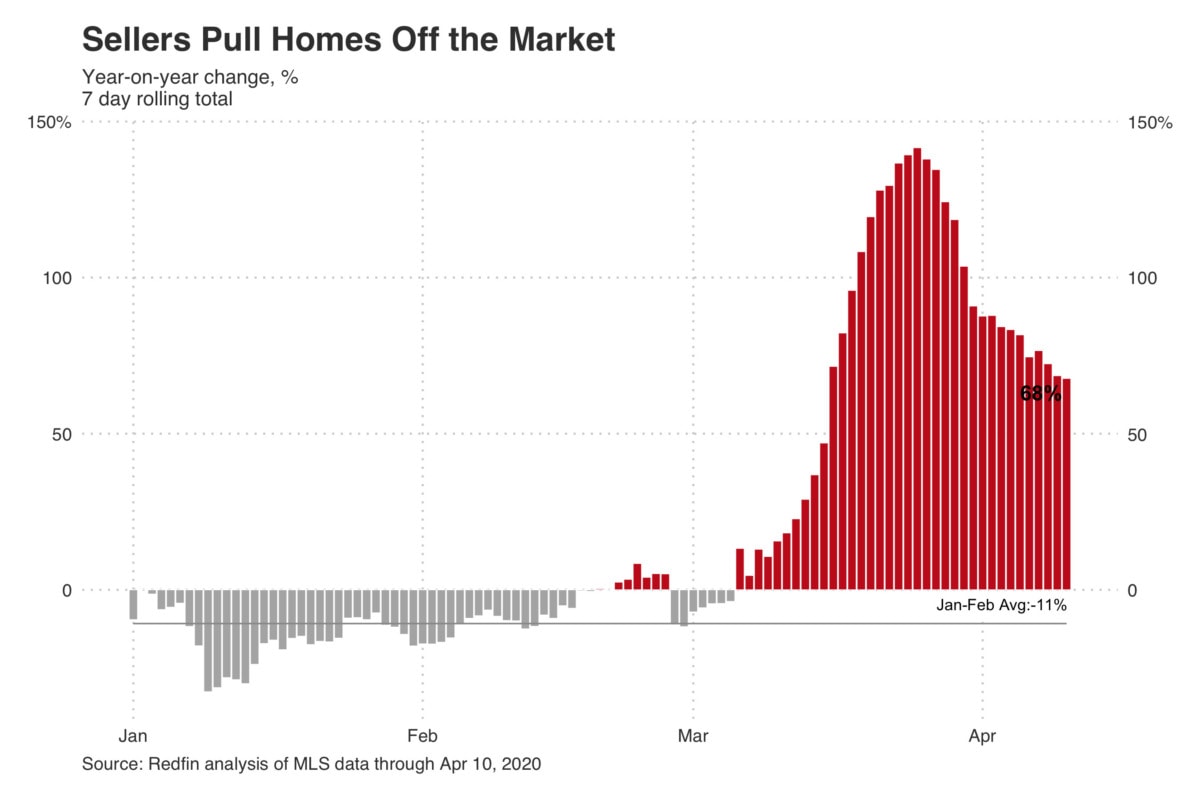
“The worst may be behind us when it comes to delistings,” said Redfin lead economist Taylor Marr. “Sellers who had homes on the market when shelter-in-place orders were implemented were faced with a choice: Keep their houses listed or pull them off the market. Many of them opted to delist, and the market is now concentrated with folks who need to sell due to major life events or changes.”
Homes Are Now Spending More Time on the Market
We reported last week that homes were spending five fewer days on the market than they were at the same time in 2019 as sellers opted to delist their properties. That trend has now reversed as delistings have moderated. The typical home on the market as of April 10 had been active for 63 days—one day longer than this time last year. If homes continue to linger on the market, sellers may decide to cut prices, Marr said.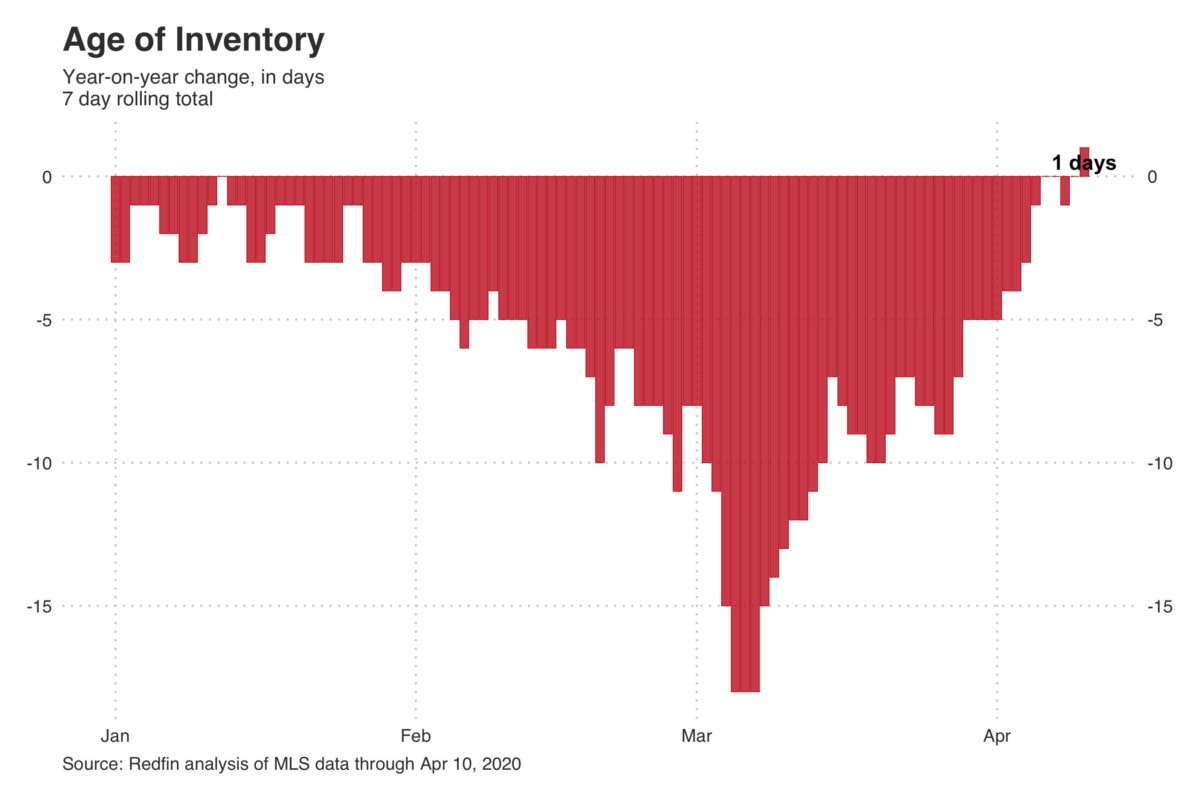
Active Listings Are Sinking More in Some Markets Than Others
There were slightly more than 750,000 homes for sale in the U.S. last week, compared with nearly 1 million homes for sale during the same period last year, marking a 21% decrease and shedding light on just how much supply is pulling back. Of the 12 U.S. markets with the most home sales, Philadelphia, Los Angeles and Chicago were among the hardest hit last week, all experiencing drops of close to 30%. By comparison, Atlanta, Detroit, and Houston saw declines of less than 10%.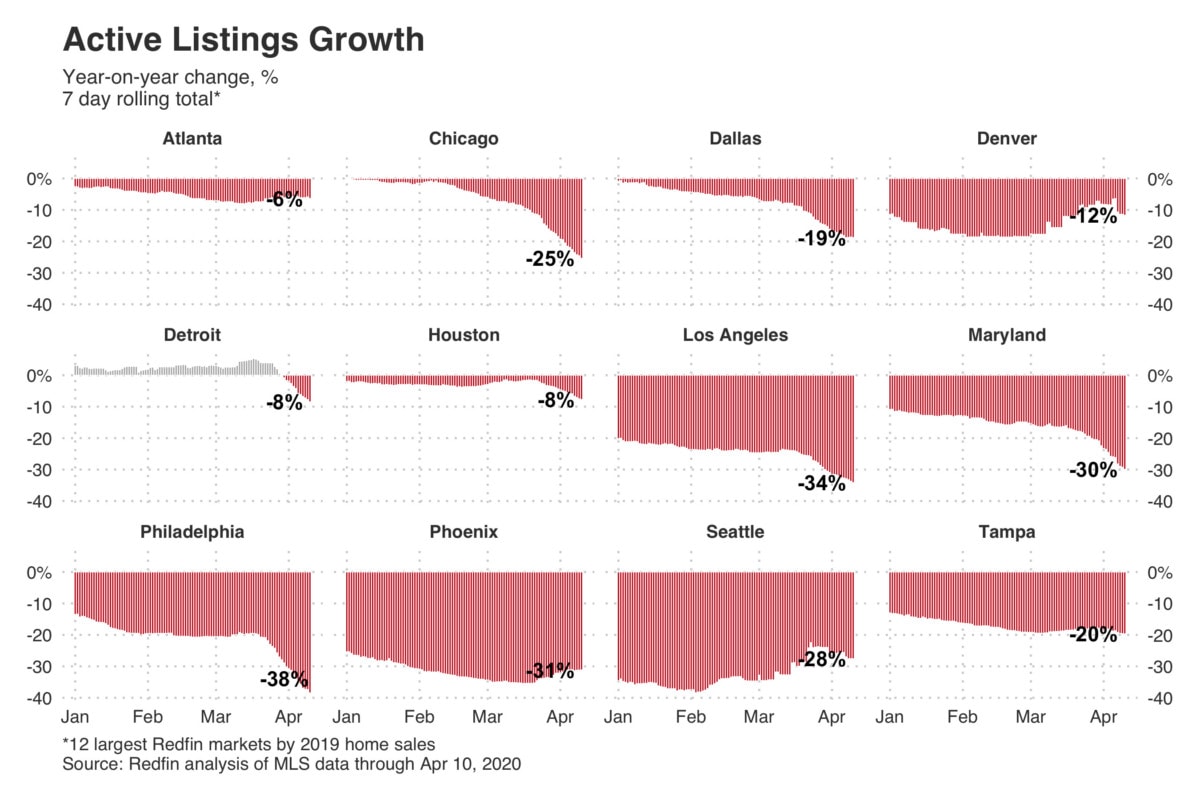
Pending Home Sales Are Falling Further
There were 32,822 homes under contract during the week ending April 10, a 54% decrease from the same period the prior year. That marks a larger drop than the 42% we reported at the end of March.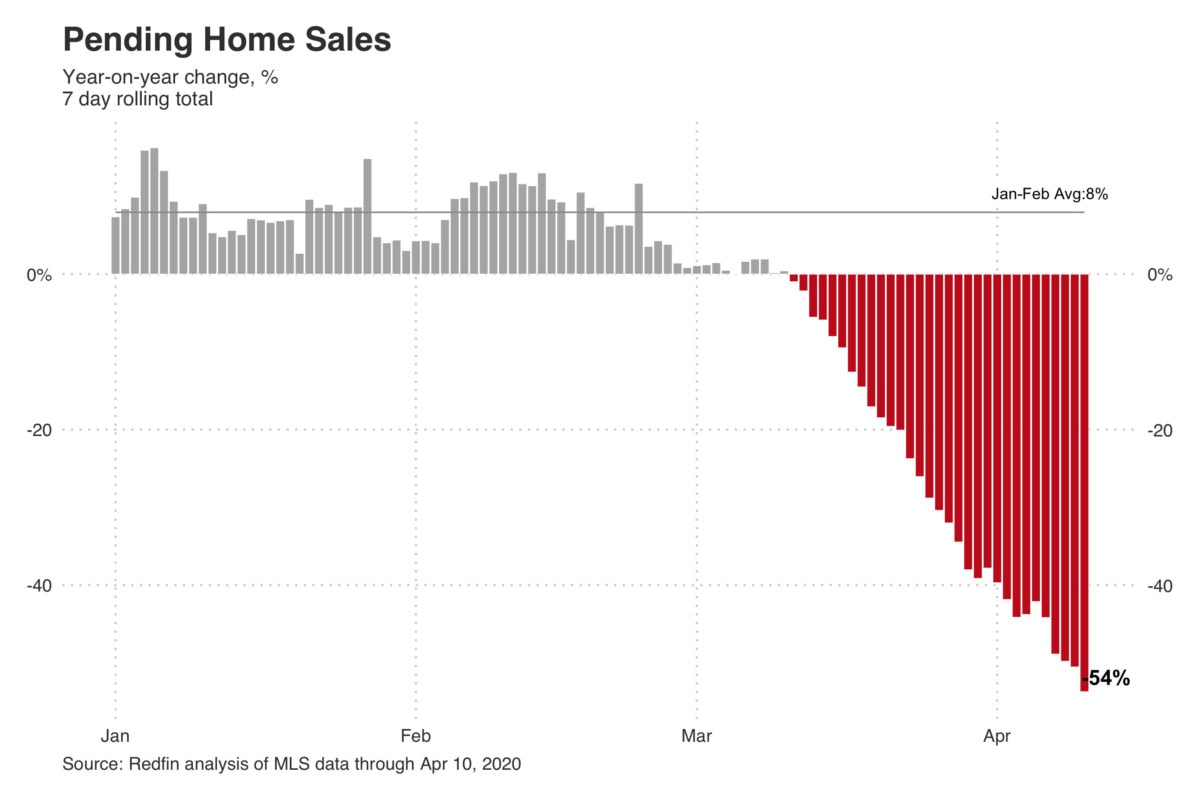
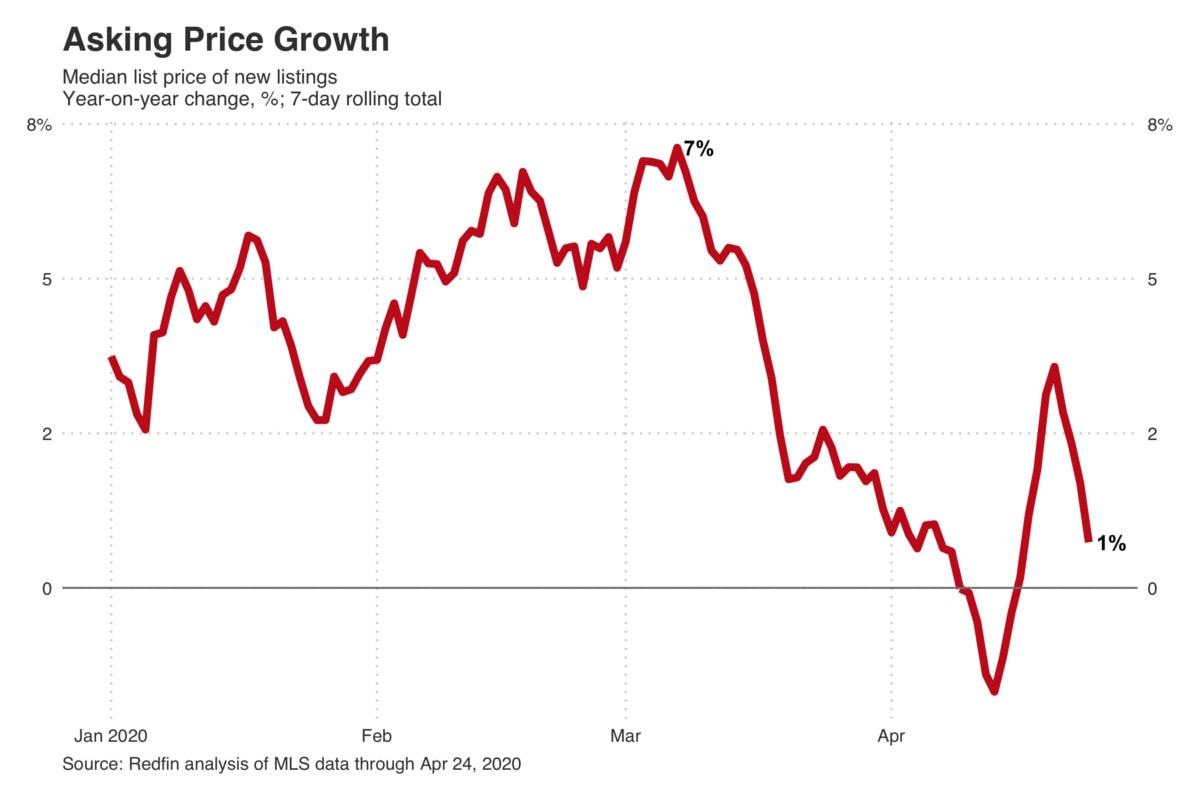
Price Growth Is Now Flat
Growth in asking prices has been declining since the beginning of March and is now officially flat year-over-year. In other words, the median new listing price increased 0% last week to $305,000. Still, that’s only several thousand dollars lower than it was the prior week, marking a less severe drop than the $21,000 decrease we saw at the end of March.