
San Francisco has seen a greater increase in price drops than any other U.S. metro, with the share of sellers slashing prices more than doubling from a year ago as the pandemic drives homebuyers out of the Bay Area.
A quarter (24.5%) of San Francisco-area home sellers cut their list prices during the four weeks ending Aug. 16, the highest share since at least 2015, when Redfin began recording this data. That’s more than double the rate from a year earlier, marking the largest annual increase in the share of active listings with price drops among the 50 most populous U.S. metro areas.
San Francisco’s price-drop rate has held steady at above 24% in late summer, clocking in at 24.1% during the most recent period in our data—the four weeks ending Aug. 23.
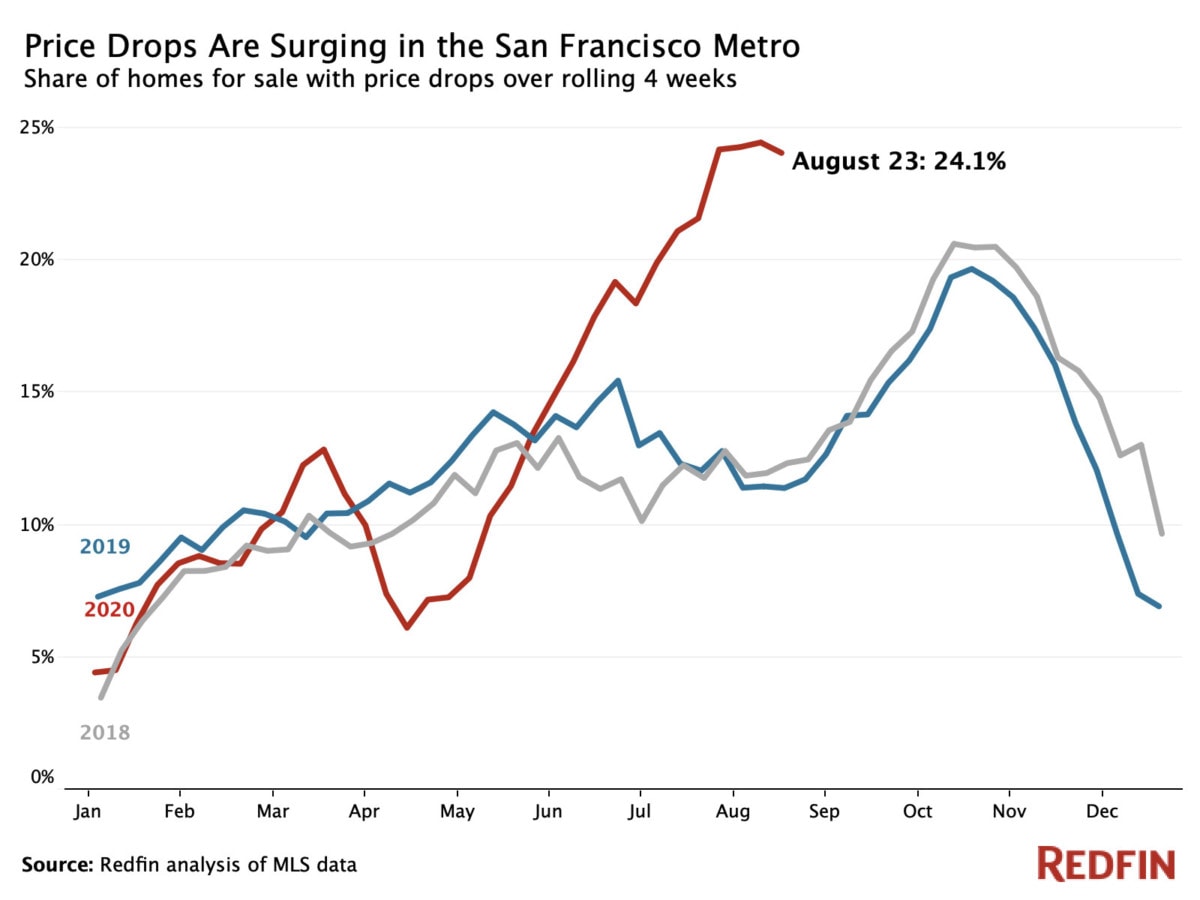
San Francisco was one of just 11 of the top 50 metros that experienced an increase in the share of listings that cut prices, rising to 24.1% from 11.4% a year earlier. Chicago, Philadelphia and New York were among the 10 other places where the rate of price drops rose from the prior year during the four weeks ending Aug. 23.
“Buyers in San Francisco want fire-sale deals, and they’re not settling until they find them. They’re in no rush because there’s so much uncertainty right now—if the price isn’t right, they can just go rent a house in Lake Tahoe for a year until their employer gives concrete guidance on if or when they need to go back to the office,” said local Redfin agent Carlos Barrientos. “I’m seeing a lot of buyers make lowball offers that initially get rejected, but then they get a call back from the sellers a few weeks later saying they’re willing to drop the price.”
High-rise condos and smaller, outdated homes—where it may be uncomfortable or challenging to set up a home office—are the property types that are most commonly seeing price drops, Barrientos added.
San Francisco’s housing market has softened during the coronavirus pandemic as its residents have fled the dense, expensive city in search of more space to make remote work and homeschooling more feasible. In the second quarter, 22.7% of Redfin.com users searching from the San Francisco area looked to relocate—up from 21% a year earlier and the second highest share of any location we analyzed (behind only New York).
As a result of this shift, the number of homes on the market in San Francisco surged 75% year over year during the four weeks ending Aug. 23, forcing sellers to cut prices, and giving buyers the upper hand. The median sale price of homes that sold during the period was up 6.6% year over year to $1.5 million, but this was well below the 11.4% increase nationwide. It’s worth noting that the share of homes with price drops is a leading indicator, so we likely would not see the trend carry over to the median sale price until these homes find buyers and their sales close over the next few months.
“It might not happen immediately, but we’ll probably see home prices fall in San Francisco eventually,” said Redfin chief economist Daryl Fairweather. “It’s clear that many homeowners think San Francisco is past its peak and that they’re better off selling sooner rather than later. Of course, the future of home prices largely depends on whether people will return to the office, or work remotely for the long run.”
Price Drops By U.S. Metro Area (50 Most Populous*) for the Four Weeks Ending Aug. 23, 2020
| Metro Area | Share of Active Listings With Price Drops | Percentage-Point Change in Share of Active Listings With Price Drops, Year-Over-Year |
|---|---|---|
| San Francisco, CA | 24.1% | 12.7 pts |
| Chicago, IL | 25.7% | 5.3 pts |
| Philadelphia, PA | 27.6% | 4.1 pts |
| New York, NY | 16.9% | 2.5 pts |
| Tampa, FL | 31.1% | 1.4 pts |
| Cincinnati, OH | 15.8% | 0.9 pts |
| Houston, TX | 27.0% | 0.7 pts |
| Indianapolis, IN | 37.7% | 0.5 pts |
| Boston, MA | 22.3% | 0.3 pts |
| San Diego, CA | 22.0% | 0.3 pts |
| Los Angeles, CA | 14.8% | 0.1 pts |
| Nashville, TN | 15.1% | -0.2 pts |
| Denver, CO | 41.0% | -0.3 pts |
| Atlanta, GA | 22.4% | -0.5 pts |
| Pittsburgh, PA | 17.7% | -0.7 pts |
| Miami, FL | 12.3% | -0.8 pts |
| Nassau County, NY | 17.0% | -0.8 pts |
| West Palm Beach, FL | 14.6% | -0.9 pts |
| Fort Lauderdale, FL | 15.4% | -1.2 pts |
| Orlando, FL | 26.7% | -1.4 pts |
| San Jose, CA | 24.9% | -1.6 pts |
| Las Vegas, NV | 21.0% | -1.9 pts |
| Seattle, WA | 31.1% | -2.0 pts |
| New Brunswick, NJ | 16.7% | -2.0 pts |
| Newark, NJ | 12.5% | -2.1 pts |
| San Antonio, TX | 25.4% | -2.7 pts |
| Washington, D.C. | 18.1% | -3.0 pts |
| Virginia Beach, VA | 15.6% | -3.1 pts |
| Warren, MI | 28.7% | -3.3 pts |
| Portland, OR | 28.6% | -3.4 pts |
| St. Louis, MO | 25.7% | -3.6 pts |
| Fort Worth, TX | 28.1% | -3.6 pts |
| Minneapolis, MN | 23.0% | -3.6 pts |
| Dallas, TX | 27.5% | -3.7 pts |
| Anaheim, CA | 17.8% | -3.8 pts |
| Milwaukee, WI | 15.5% | -4.0 pts |
| Oakland, CA | 21.2% | -4.1 pts |
| Phoenix, AZ | 18.1% | -4.2 pts |
| Baltimore, MD | 22.5% | -4.4 pts |
| Montgomery County, PA | 20.1% | -4.4 pts |
| Detroit, MI | 22.3% | -4.7 pts |
| Providence, RI | 12.9% | -4.9 pts |
| Jacksonville, FL | 18.9% | -5.5 pts |
| Charlotte, NC | 15.2% | -5.9 pts |
| Riverside, CA | 12.1% | -6.3 pts |
| Austin, TX | 25.9% | -6.3 pts |
| Sacramento, CA | 24.2% | -7.8 pts |
| Columbus, OH | 16.7% | -9.0 pts |
| Cleveland, OH | 24.0% | -23.3 pts |
*Excludes Kansas City, MO


