Since the end of the Great Recession, the homeownership rate for black Americans has fallen 5 percentage points to 40.6%. And while majority-black neighborhoods have seen an average of $121,000 in home-equity gains, it’s $191,000 for majority-white neighborhoods.
Black Americans haven’t benefited from the prosperous U.S. housing market as much as white Americans in the past decade’s economic expansion, during which home prices nationwide have surged 73 percent. Black Americans have fallen further behind white Americans as the race gaps in homeownership rates, home equity and overall wealth have all widened since 2010, and Hispanic & Latino Americans also have relatively low homeownership rates and net worth. While homeownership rates have fallen for all three groups, black Americans have experienced the biggest decline in homeownership—to a current rate of 40.6 percent, the lowest on record—compared to more than 73 percent for white Americans. Read similar: Redlining in Real Estate
And though those who do own homes across majority- black, Hispanic and white neighborhoods have built wealth through home equity gains as home prices rose, the average homeowner in a majority-black neighborhood is still left with just over half as much equity as the average homeowner in a majority-white neighborhood. In part as a result of the inequality in homeownership and home-equity gains, black Americans have seen their median net worth decline in the past decade while for white Americans it rose by double digits.
“With higher unemployment rates and less wealth to begin with, black Americans were less able to buy homes even when prices were at their lowest point, meaning many missed out on opportunities to build wealth and put down roots in their communities through homeownership,” said Redfin chief economist Daryl Fairweather. “The growing racial homeownership gap has widened the wealth gap, as home equity remains one of the most significant wealth-building tools. And now, with higher home prices and tighter lending standards than before the housing crash of 2008, it’s more difficult than ever for minorities to break into the housing market. That’s likely to contribute to growing economic inequality in the U.S.”
We’ve compiled data on homeownership rates, home equity, net worth and unemployment by race below.
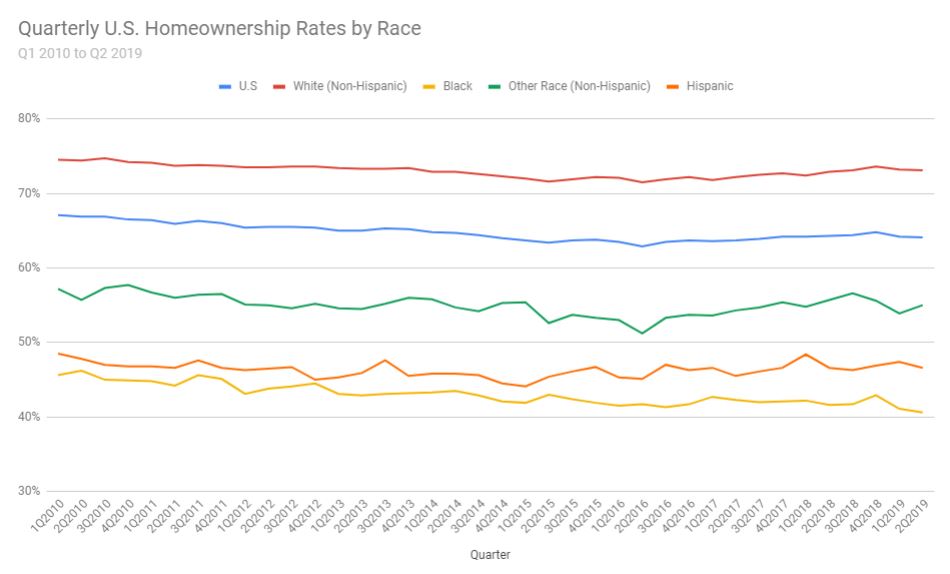
The already-large homeownership gap between black and white Americans has widened since 2010
- The homeownership rate for black Americans dropped 5 percentage points to 40.6% in the second quarter of 2019 from 45.6% in the first quarter of 2010. The rate for white Americans dropped just 1.4 percentage points, from 74.5% to 73.1%, over the same time period. The homeownership rate for Hispanic & Latino people fell 1.9 points (from 48.5% to 46.6%). The nationwide rate dropped 3 points to 64.1%.
- The homeownership gap between black and white Americans has widened over the last decade to a 32.5 percentage-point gap in the second quarter of 2019, from a 28.9 percentage-point gap in the first quarter of 2010.
- The homeownership rate remained over 70% for white Americans from 2010 through the second quarter of 2019, but for black Americans, it never surpassed 50%.
Homeowners in majority-black neighborhoods experienced significantly smaller home-equity gains in dollars than those in majority-white neighborhoods from 2012 to 2018
| Average home equity and equity gains, 2012-2018 | ||||
| Average home equity in 2012 | Average home equity in 2018 | Dollar gain in equity | Percentage gain in equity | |
| Black communities | $38,547 | $159,321 | $120,800 | 213% |
| Hispanic/Latino communities | $77,817 | $283,805 | $206,000 | 165% |
| White communities | $105,776 | $296,712 | $190,935 | 81% |
| Overall | $99,000 | $293,000 | $194,000 | 197% |
- Homeowners in primarily black neighborhoods (those with more than 50% of homes occupied, though not necessarily owned, by black Americans) saw smaller dollar gains in home equity ($120,800) from 2012 to 2018 (the most recent full year for which data is available) than those in Hispanic/Latino and white neighborhoods. Homeowners in primarily white neighborhoods saw a gain of $190,935 during the same time period, and they started and ended with the most equity in dollars. Homeowners in primarily Hispanic & Latino communities gained $206,000 in equity.
- Home prices in majority-black neighborhoods rose 24.9% from 2012 to 2018, higher than the 21% gain for Hispanic & Latino communities and the 12.5% gain for white communities.
- Homeowners in majority-black neighborhoods saw the biggest percentage gain in equity (213%), but started with substantially lower equity in the homes than white and Hispanic & Latino neighborhoods.
- The home-equity gap between black and white Americans widened slightly from 2012 to 2018, from $67,229 to $70,135.
“The large percentage gains in equity in majority-black neighborhoods don’t necessarily mean black Americans have benefited. Home prices in majority-black neighborhoods were substantially lower in 2012 than they were in other communities, meaning there was a huge amount of room for prices to grow. Many of those neighborhoods were ripe for gentrification, with significant demand for affordable homes that pushed up home prices more than in expensive neighborhoods. This likely pushed many black Americans out of those communities and prevented renters from becoming homeowners,” Fairweather said. “So while majority-black communities did see a significant percentage gain in home equity, that doesn’t necessarily mean the black residents were the ones who benefited: They could very well be renting homes from outside investors. And even so, homeowners in majority-black communities still don’t have as much cash to show for their investments as homeowners in majority-white communities.”
Home-equity gains for black Americans haven’t translated into an increase in net worth
- The median net worth for black Americans dropped 2.8% to $17,100 in 2016 (the most recent full year for which data is available) from $17,600 in 2010. That leaves the typical black American more than $10,000 short of the 20% down payment ($27,980) likely needed to purchase a median-priced home in Detroit, one of the most affordable major housing markets in the U.S.
- Median net worth rose 18.5% to $171,000 during the same period for white Americans.
- The net-worth gap between black and white Americans increased 22.8% to $153,900 in 2016 from $125,300 in 2010.
- Hispanic & Latino Americans saw their median net worth increase by 15.1% over the six year period to $20,600, also well below the typical down payment for a home in Detroit.
- In 2010, the ratio of white to black net worth was 8:1. By 2016, the ratio had widened to 10:1.
The unemployment rate for black Americans is nearly double the rate for white Americans
- The unemployment rate for black Americans dropped 10.5 percentage points to 6% in June 2019 from 16.5% in January 2010, while the rate for white Americans fell 5.5 percentage points to 3.3% over the same time period.
- The unemployment gap between black and white Americans has narrowed substantially since the beginning of 2010, from a 7.7 percentage-point gap to a 2.7-point gap.
“Although the unemployment rate has gone down for black Americans, their wealth has also gone down,” Fairweather said. “Homeownership has been the traditional way for the middle class to build wealth, so the fact that the black homeownership rate has gone down helps explain why decreased unemployment hasn’t translated to greater wealth.”
Methodology
For the homeownership rate section of this report, we used the U.S. Census for data on homeownership rates by race. We used the 2016 Survey of Consumer Finances for data on net worth by race and the U.S. Bureau of Labor Statistics Current Employment Survey for data on unemployment rates by race.
For the section on home equity gains by race, we looked at county sale records for homes purchased at anytime during 2012. After cleaning the data, we had a sample of roughly 962,000 sales. Assuming those homeowners are still living in the same house and that they all took out the prevailing 30-year fixed mortgage rate at the time of purchase, we were able to calculate the outstanding loan balance in August 2018 using the total original value of loans (first and second), the 30-year fixed monthly average mortgage rate from Freddie Mac in the month of sale and the total number of monthly payments made thus far. We assumed that none of the homeowners paid down their mortgage and that none borrowed against their home equity. The August 2018 Redfin Estimate was used as a proxy for the current market value of these homes. Home equity in 2018 is then obtained by subtracting the outstanding mortgage balance from the current market value of the home. Home equity in 2012 is simply the difference between the purchase value of the home and the original loan balance. We classified a zip code as black, Hispanic/Latino or white if more than 50 percent of the households were black, Hispanic/Latino or white over the five-year period from 2012 through 2016, according to household race data from the 5-year American Community Survey. Because the sale records are linked to zip codes, we are able to track home equity changes in black, Hispanic/Latino and white zip codes, as defined above. Of the roughly 2,300 zip codes, 74 percent were majority white, 8 percent were majority black and 8 percent were majority Hispanic/Latino. In 10 percent of the zip codes, none of those races is the majority.
Throughout the report, the term “black” refers to “black or African American.” The term “white” refers to “White, not Hispanic or Latino.”