
The homeownership rates for both Black and white families rose slightly over the last 10 years, with part of the increase taking place during the pandemic.
The racial homeownership gap persists. The homeownership rate for Black families rose only slightly over the last decade, with part of the increase taking place during the pandemic–but it still falls far short of the white homeownership rate.
Just 44.7% of Black families nationwide own their home, up slightly from 44% just before the pandemic began. That’s compared with 74% of white families, up marginally from 73.7% two years ago.
The huge homeownership gap between Black and white families–29.3 percentage points–has also barely changed over the last decade, from 30.4 percentage points in the first quarter of 2012. At that time, 43.1% of Black families owned their home, versus 73.5% of white families.
That’s according to U.S. Census data as of the first quarter. The words “family” and “household” are used interchangeably in this report to refer to people living in homes together. This report uses 2012 as a point of comparison because that’s when the U.S. housing market started to recover from the Great Recession.
“The good news is that the Black homeownership rate didn’t decline during the pandemic, even though Black Americans were hit hardest by coronavirus-related layoffs and are recovering slower financially,” said Redfin Chief Economist Daryl Fairweather. “But that’s only a glimmer of hope in a flawed system, where Black families are at an unfair financial disadvantage due to the legacy of racism and discrimination that has caused several generations to miss out on building wealth through homeownership.”
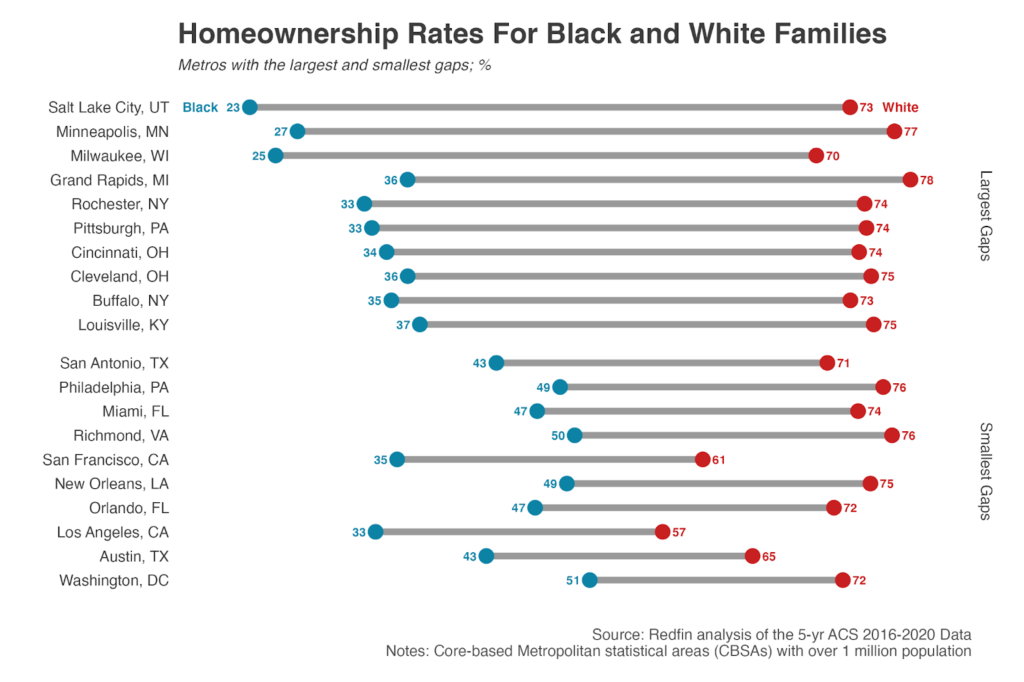
Washington, D.C. and Birmingham, AL have the highest Black homeownership rates; Salt Lake City has the lowest
Just over half (51%) of Black families in both Washington, D.C. and Birmingham, AL own their home, the highest Black homeownership rates in the U.S. of all metros with more than 1 million residents. They’re followed by Richmond, VA (50%), New Orleans (49%), Philadelphia (49%) and Atlanta (49%).
The metro-level data in this report is from a Redfin analysis of the U.S. Census’ 2016-2020 5-year American Community Survey, released in March 2022–the most recent metro data available. Note that the national data above is more recent, from the first quarter of 2022.
Washington, D.C. also has the smallest racial homeownership gap, with 72% of white families owning their home. Austin and Los Angeles have the next-smallest gaps. Forty-three percent of Black families in Austin own their home, versus 65% of white families. In Los Angeles, the gap is 33% versus 57%.
On the other side of the spectrum, just 23% of Black families in Salt Lake City own their home, the lowest Black homeownership rate in the U.S. It’s followed by Milwaukee (25%), Minneapolis (27%), Las Vegas (31%) and San Diego (31%).
Salt Lake City, Minneapolis and Milwaukee also have the largest racial homeownership gaps, with 73% of white families in Salt Lake City owning their home, 77% in Minneapolis and 70% in Milwaukee. San Diego and Las Vegas have smaller gaps, as white families in those places also have low homeownership rates compared with other metros (61% and 63%, respectively).
In most metros, Black families are less likely to own their home than they were a decade ago
The homeownership rate for Black families dropped from 2012 to 2020 in 36 of the 52 metros in this analysis, with the biggest declines in Milwaukee (25% in 2020, down from 33% in 2012), Salt Lake City (23%, down from 30%) and Memphis (45%, down from 51%).
The homeownership rate increased most in New Orleans, where 49% of Black families owned their home in 2020, up from 47% in 2012, Minneapolis (27%, up from 25%) and Boston (35%, up from 33%).
The Black homeownership rate hasn’t changed in Baltimore, Denver, Hartford, CT or Tampa, FL.
Systemic racism, wage gaps, soaring home prices continue to drive the racial homeownership gap
Racist housing policies like redlining and discriminatory housing covenants are a major reason why Black families have missed out on property-value gains. Redlining effectively blocked many Black families from obtaining mortgage loans in the first half of the twentieth century, and a Redfin analysis found that the typical family in formerly redlined neighborhoods have missed out on $212,000 worth of home equity over the last 40 years. That’s money that could have been used to buy more property, and/or passed on to children and grandchildren.
Other factors contributing to the comparatively low Black homeownership rate also stem from systemic racism. There’s a persistent wage gap, with Black men nationwide earning 87 cents for every dollar earned by white men and Black women earning just 63 cents to the dollar, according to one study. Student debt is another obstacle, with the typical Black college graduate owing nearly double the typical white college graduate four years after graduating. Predatory lending during the Great Recession is yet another factor: Nearly 8% of Black households with mortgages lost their homes to foreclosure between 2007 and 2009, versus 4.5% of white families.
Soaring home prices exacerbate the problem, with U.S. sale prices up 34% just since the beginning of the pandemic, and that’s especially problematic for prospective Black homebuyers. Prices rose at double the rate in majority-Black neighborhoods than those in majority-white neighborhoods from 2012 to 2018.
There are some reasons for optimism about Black real estate wealth. The total value of homes owned by Black people in the U.S. increased 31.1% year over year to a record $2.3 trillion in the fourth quarter of 2021, and their total home equity increased $1.5 trillion, up 45%, according to the Federal Reserve.
“It’s worth celebrating the fact that the real estate wealth held by Black Americans is on the rise, and hopefully that wealth will strengthen Black communities” Fairweather said. “But unfortunately, because most Black Americans don’t currently own a home, most of them aren’t earning money through homeownership. Moving forward, the public and private sectors should work together on a major policy overhaul to help Black families buy homes, as that is one of the most important steps in reducing inequality in this country.”
| Homeownership Rates for Black Families, By Metro Area
U.S. metro areas with population of more than 1 million Share of households that own the home they live in |
||||
| U.S. metro area | Homeownership rate: Black households (2020) | Homeownership rate: Black households (2012) | Homeownership rate: White households (2020) | Homeownership rate: White households (2012) |
| Atlanta, GA | 49% | 52% | 76% | 78% |
| Austin, TX | 43% | 42% | 65% | 65% |
| Baltimore, MD | 47% | 47% | 77% | 77% |
| Birmingham, AL | 51% | 53% | 79% | 80% |
| Boston, MA | 35% | 33% | 69% | 69% |
| Buffalo, NY | 35% | 34% | 73% | 73% |
| Charlotte, NC | 46% | 47% | 75% | 76% |
| Chicago, IL | 41% | 42% | 75% | 77% |
| Cincinnati, OH | 34% | 35% | 74% | 74% |
| Cleveland, OH | 36% | 40% | 75% | 76% |
| Columbus, OH | 35% | 37% | 69% | 69% |
| Dallas-Fort Worth, TX | 38% | 42% | 69% | 71% |
| Denver, CO | 41% | 41% | 71% | 71% |
| Detroit, MI | 43% | 47% | 79% | 80% |
| Grand Rapids, MI | 36% | 35% | 78% | 78% |
| Hartford, CT | 42% | 42% | 77% | 77% |
| Houston, TX | 42% | 46% | 72% | 73% |
| Indianapolis IN | 37% | 40% | 73% | 74% |
| Jacksonville, FL | 45% | 49% | 74% | 74% |
| Kansas City, MO | 38% | 42% | 71% | 73% |
| Las Vegas, NV | 31% | 33% | 63% | 63% |
| Los Angeles, CA | 33% | 36% | 57% | 60% |
| Louisville. KY | 37% | 39% | 75% | 75% |
| Memphis, TN | 45% | 51% | 76% | 77% |
| Miami, FL | 47% | 49% | 74% | 76% |
| Milwaukee, WI | 25% | 33% | 70% | 70% |
| Minneapolis, MN | 27% | 25% | 77% | 77% |
| Nashville, TN | 43% | 44% | 73% | 73% |
| New Orleans, LA | 49% | 47% | 75% | 73% |
| New York, NY | 33% | 32% | 67% | 67% |
| Oklahoma City, OK | 39% | 42% | 70% | 72% |
| Orlando, FL | 47% | 46% | 72% | 72% |
| Philadelphia, PA | 49% | 50% | 76% | 77% |
| Phoenix, AZ | 34% | 36% | 72% | 72% |
| Pittsburgh, PA | 33% | 36% | 74% | 74% |
| Portland, OR | 33% | 32% | 66% | 65% |
| Providence. RI | 34% | 32% | 69% | 67% |
| Raleigh, NC | 46% | 48% | 74% | 76% |
| Richmond, VA | 50% | 53% | 76% | 78% |
| Riverside, CA | 43% | 46% | 72% | 73% |
| Rochester, NY | 33% | 35% | 74% | 75% |
| Sacramento, CA | 35% | 36% | 68% | 68% |
| Salt Lake City, UT | 23% | 30% | 73% | 73% |
| San Antonio, TX | 43% | 46% | 71% | 73% |
| San Diego, CA | 31% | 30% | 61% | 62% |
| San Francisco, CA | 35% | 34% | 61% | 61% |
| San Jose, CA | 32% | 34% | 64% | 67% |
| Seattle, WA | 32% | 33% | 66% | 66% |
| St. Louis, MO | 40% | 44% | 77% | 78% |
| Tampa, FL | 42% | 42% | 73% | 74% |
| Virginia Beach, VA | 45% | 47% | 73% | 73% |
| Washington, D.C. | 51% | 52% | 72% | 73% |


