
In our weekly market update, Redfin reported home-buying demand continued to recover last week, as states began making plans to begin to reopen businesses. Here are five additional charts that illustrate the latest developments in the housing market as the world continues to grapple with the coronavirus pandemic. Additional charts and local data are available for download in the Redfin Data Center.
Sellers Continue to Hold Off on Listing
There were almost 53,000 new-home listings last week, down about 40% from a year ago. That’s an improvement from the 50% decline we reported last week. The improvement may be partly due to the Easter holiday falling around this time last year. Looking over the past four weeks, new listings are down 45%, with just 210,000 new homes put on the market. The five preceding years averaged 378,000 new listings during the same period.

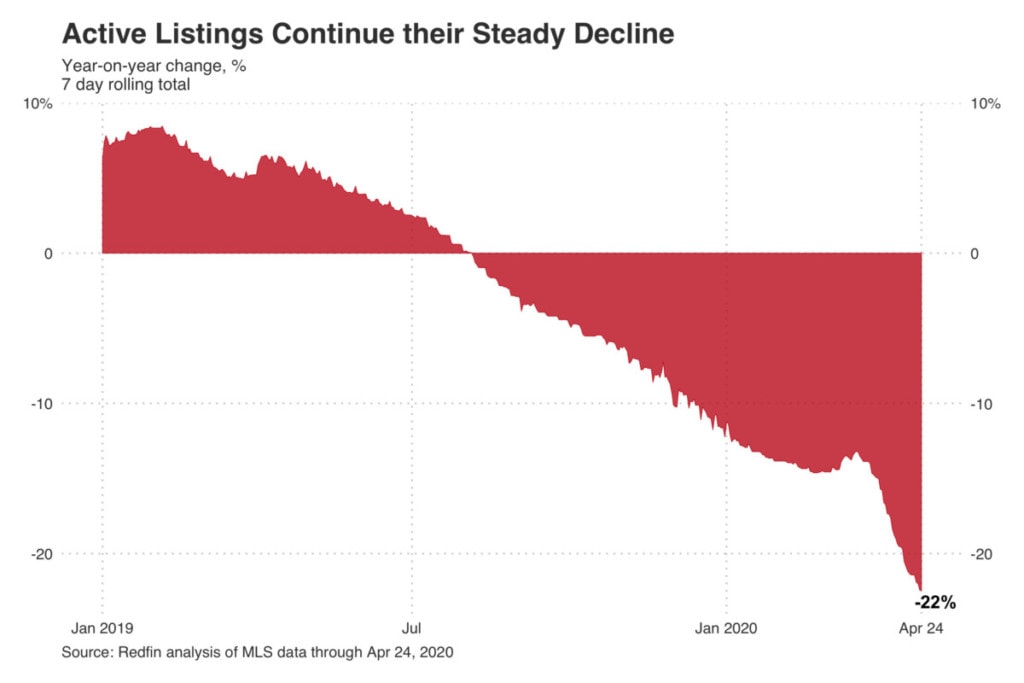
This decline in new listings has contributed to a 22% decline in home supply compared to last year.
Price Growth is Now Nearly Flat
Last week the median listing price was $308,000, up just 1% compared to the same period the prior year. The week prior, we reported that asking-price growth had stopped its rapid descent and reversed course, increasing 3% year over year. Redfin lead economist Taylor Marr says, “Asking prices may be settling into a flat trend line for now. The primary reason for the shift over the past month though hasn’t been an increase in sellers listing below their Redfin estimate, but instead fewer higher-end properties coming to the market—bringing down the average.”

While Redfin agents are still seeing bidding wars, competition has slowed, giving some buyers a chance to negotiate a better price. In the previously red-hot sellers’ market of Seattle, Redfin agent David Palmer says buyers are now able to be a little more aggressive. “There’s fear on both sides. We have a bunch of buyers who want $40,000 price reductions or credit that really should have been $15,000 to $20,000. We’re calling it the ‘coronavirus credit’. I’d say it is getting a little closer to a level playing field, but sellers know that inventory is low and they’re trying to stick to their guns.”
Sellers Aren’t Dropping Prices
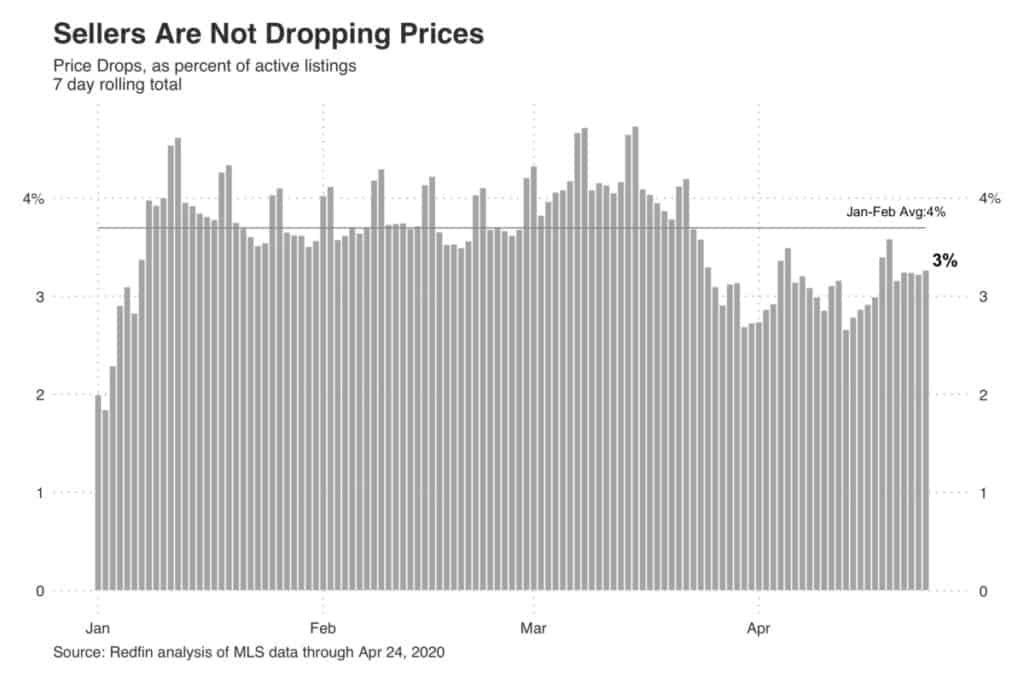
While sellers may be more willing to negotiate, they aren’t dropping their prices. Just 3% of homes on the market had a price drop last week, which is the same as last year and below the average in January and February of 4%.
“Sellers are opting to delist and wait for a more favorable market rather than take a haircut on the price,” says Marr. Sellers who do reduce the price are dropping it by an average of just 1.6% compared to 3.3% last year. “This may be a sign that sellers are using a price drop as a strategy to drum up new interest in the home. They worry buyers overlooked their home in the early coronavirus panic and know that a price drop triggers a notification to be sent to buyers who have a saved search.”
Sellers Continue to Pull Homes Off the Market
In the four weeks ended April 24, 8% of active listings were pulled from the market. While we appear to be past the peak of delistings, sellers are still removing their homes from the market at a significantly higher rate than they were at this time last year. During the week ended April 24, delistings rose 56% year over year to 15,900 homes, down from the peak of over 100% during the final week of March.


